
 Applied
MathematicsTextbook
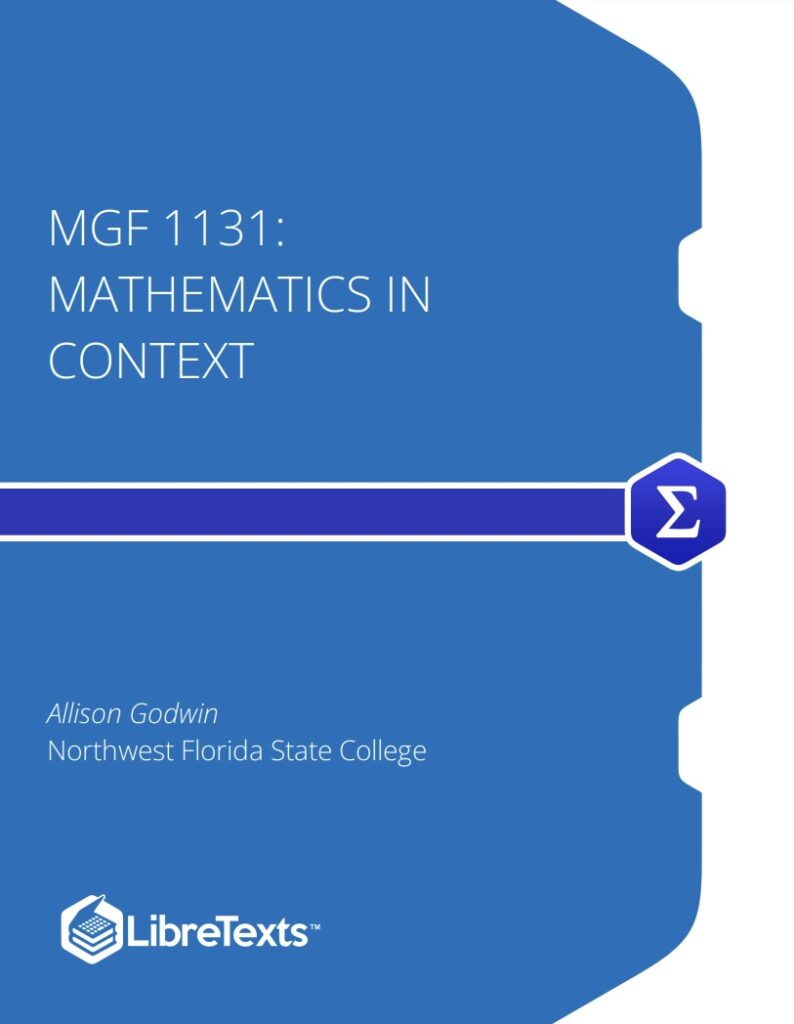
MGF 1131: Mathematics in Context
Not rated yetRate this bookMGF 1131: Mathematics in Context develops quantitative reasoning for everyday situations. Its opening statistics lessons establish what data describe and which kinds of calculations are meaningful.
Free reading is available at the official source. Opens in a new tab.
 Free
About this book
About this book
The Northwest Florida State College resource, associated with Allison Godwin, is organized around data, probability, financial mathematics, voting, and graph theory. The course description identifies a three-credit practical mathematics course.
The first reviewed lessons distinguish populations from samples and parameters from statistics. They also separate categorical responses from quantitative measurements, including cases where a numerical label does not represent an amount.
Book summary
Chapter-by-chapter summaries
1. Organizing Data
The opening chapter establishes the relationship between a statistical question and the observations used to answer it. A population is the group of interest, while a sample supplies a more limited set of evidence. Parameters and statistics describe quantities associated with those different levels. The chapter then distinguishes categorical responses from quantitative measurements, showing why numerical labels do not necessarily represent amounts. Sampling methods and sources of bias explain how a study can become misleading before any calculation is performed. Tables and graphs provide ways to organize the resulting information, with different displays suited to different types of data. The progression encourages readers to ask where a dataset came from, what its entries mean, and what a representation makes easier or harder to see. Good organization is therefore part of sound interpretation rather than cosmetic presentation.
2. Analyzing Data
The second chapter develops numerical summaries that describe a dataset from several perspectives. Mean, median, and mode answer different questions about a typical or common value. Measures of spread, including range and standard deviation, reveal variation that a measure of center alone may conceal. Percentiles locate an observation within a distribution rather than reporting only its numerical size. Examples show why two groups can appear similar according to one summary and different according to another. The chapter asks readers to connect a calculation with an interpretation: what does the chosen measure actually communicate about the data? Selecting a summary requires attention to the shape and meaning of the observations, not only the ability to follow an arithmetic procedure.
3. Probability
Probability describes the likelihood of outcomes within a defined set of possibilities. The chapter begins with rates and proportions before introducing sample spaces, events, and elementary probability calculations. Complementary events, combinations of events, and independence require careful distinctions because different relationships justify different operations. Counting techniques help determine how many outcomes are possible when listing them individually becomes impractical. The chapter’s central habit is to describe the situation before choosing a formula. A result is meaningful only in relation to its assumptions about the possible outcomes and their likelihoods. This approach connects everyday reasoning about chance with a more systematic mathematical framework and prepares readers to examine claims that depend on an implicit model of uncertainty.
4. Financial Mathematics
The financial chapter examines how money changes over time under different arrangements. Simple interest and compound interest treat the accumulation process differently, making the timing and frequency of growth important. Annuities introduce repeated contributions, while payout annuities reverse the practical question by examining withdrawals from an accumulated amount. Loans combine an initial balance with repayment and interest over time. The chapter links these structures with the quantities that must be identified in a problem: rate, period, payment, starting amount, and final amount. Its educational purpose is to make a financial description interpretable as a mathematical model. Comparing scenarios requires consistent time units and a clear account of the cash flows, rather than applying one interest formula to every situation.
5. Voting and Graph Theory
The final chapter explores decision procedures and connected systems. Voting methods can convert the same preferences into different outcomes, so plurality, runoff, ranked approaches, and point-based methods require comparison through fairness criteria. This makes the rules of aggregation part of the result, rather than a neutral background. Graph theory then represents relationships through vertices and edges. Shortest paths, routes that cover connections, and routes that visit locations illustrate different problems that can look similar in everyday language. Euler and Hamiltonian ideas help distinguish those tasks, while algorithms provide systematic procedures for tackling them. Together the topics show how mathematical modelling begins by identifying what must be counted, compared, connected, or visited. A suitable procedure depends on that definition of the problem.
Study instructions
- Propose a small question about a familiar setting and define the target population before deciding how to collect information.
- Describe a realistic sample and identify who might be left out. State how that limitation affects the conclusion you could make.
- Classify each proposed variable by what it represents. For numerical responses, explain whether addition, comparison of amounts, or averaging has a sensible interpretation.
- Write a short account of your hypothetical result using precise language about the sample. Avoid expanding the conclusion to a larger population without an argument for representativeness.
Questions for reflection
- Why might a large sample still fail to describe the intended population?
- When does a number identify a category rather than measure a quantity?
Sources and coverage
These original summaries draw on chapter introductions, selected explanatory passages, examples, and concluding material across the chapters or units listed above. They are a condensed study guide, rather than a page-by-page account of the complete text. Supplementary sections are identified separately.
About access & copyright
This page provides book information and study material. Full-text access is provided by the original publisher or authorised source; a listing does not grant permission to republish the book.
Read our Library Access & Copyright policyPopulation definition
State which group a question concerns.
Sampling interpretation
Relate a statistic to the observations behind it.
Data classification
Choose operations that fit the meaning of a variable.
Reader ratings & reviews
Share your thoughts
Your review helps other students choose the right resources.
KEEP LEARNING
Your next great read
Applied Algebra
Advanced Algebra
View Advanced Algebra — book Analysis
Basic Engineering Data Collection and Analysis
View Basic Engineering Data Collection and Analysis — book Mathematics
Data Analysis in the Psychological Sciences: A Practical, Applied, Multimedia Approach
View Data Analysis in the Psychological Sciences: A Practical, Applied, Multimedia Approach — book Mathematics
Introductory Algebra
View Introductory Algebra — bookAn Intuitive, Interactive, Introduction to Biostatistics
An Intuitive, Interactive, Introduction to Biostatistics
View An Intuitive, Interactive, Introduction to Biostatistics — book Business
 Calculus with Excel
View Business Calculus with Excel — book Algebra
Linear Algebra Done Right
View Linear Algebra Done Right — book Applied
Learning Statistics with R: A tutorial for psychology students and other beginners
View Learning Statistics with R: A tutorial for psychology students and other beginners — book Algebra



