
 Mathematics
AnalysisTextbook
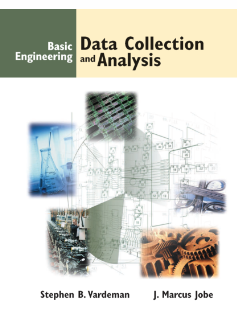
Basic Engineering Data Collection and Analysis
Not rated yetRate this bookBasic Engineering Data Collection and Analysis connects engineering questions with the collection, interpretation, and communication of data. Verified institutional information identifies the book as a practical resource by Stephen B. Vardeman and J. Marcus Jobe.
Free reading is available at the official source. Opens in a new tab.
 Free
About this book
Vardeman and Jobe’s Basic Engineering Data Collection and Analysis makes statistical reasoning part of engineering practice. Nine chapters move from measurement and collection to description, probability, inference, process monitoring, factorial experiments, and regression, followed by probability and reference appendices. Real engineering cases connect calculations with decisions about processes and products. The guide follows the original 2001 text made openly available by Iowa State University Digital Press. It emphasizes the distinctions among describing observed data, quantifying uncertainty, predicting outcomes, and drawing conclusions about an ongoing process; those distinctions are central to the book’s practical approach.
The detailed guide below follows the book’s chapter, unit, or section structure. Read it alongside the study instructions and the complete official text.
Book summary
Chapter-by-chapter summaries
Chapter 1: Introduction
Engineering statistics uses variable observations to learn about physical systems and support decisions. The opening gear heat-treatment example shows why comparing two averages is only a beginning: an engineer also needs to understand variability, uncertainty, and the practical cost of each method. The chapter introduces study types, data types, and data structures, distinguishing questions about an identifiable population from questions about future process behavior. Measurement receives early attention because an apparently precise number may reflect a poorly defined or unstable procedure. Mathematical models simplify reality and can be useful without being exact. The chapter establishes the book's standard for success: a statistical conclusion must be interpreted within the physical problem it was intended to address.
Chapter 2: Data Collection
Good data collection is often more consequential than elaborate analysis after collection. The chapter develops measurement, sampling, recording, and experimental principles, including comparisons, replication, and allocation of resources. Randomization helps manage extraneous influences, while blocking organizes comparisons among conditions expected to differ in relevant ways. Replication means repeating the experimental unit, not simply measuring the same item many times and calling those readings independent experiments. The chapter also distinguishes enumerative sampling from experimentation and outlines practical preparation from problem definition through physical setup. A defensible study records what was done and why, anticipates likely sources of variability, and collects information capable of answering the engineering question rather than whatever is easiest to measure.
Chapter 3: Elementary Descriptive Statistics
Descriptive methods reveal the pattern of observations before formal modeling. Dot diagrams, stem-and-leaf plots, histograms, scatterplots, and run charts emphasize different features, including shape, relationships, and time order. Quantiles, boxplots, and quantile-comparison plots supplement measures of center and spread. The chapter repeatedly connects summaries with the original engineering variables and their units. Two datasets can have similar means but different variability or outliers, and time-ordered behavior may disappear when observations are pooled. Qualitative and count data require suitable summaries of their own. The purpose is not to produce every possible graphic, but to choose displays and numbers that expose the features relevant to the process or comparison under investigation.
Chapter 4: Describing Relationships Between Variables
Least squares fits lines, curves, and surfaces by minimizing squared residuals, allowing several inputs and responses to be related quantitatively. The chapter explains correlation, the coefficient of determination, residual analysis, and cautions about interpretation. A fitted pattern describes observed association; it does not by itself establish causation or justify extrapolation. Factorial data introduce main effects and interactions, showing that one factor's effect can depend on another factor's level. Transformations can make relationships simpler or stabilize patterns, but they also change the scale on which results are interpreted. This chapter deliberately develops descriptive fitting before formal inference, giving readers a model to inspect physically and graphically before attaching uncertainty statements to its parameters.
Chapter 5: Probability: The Mathematics of Randomness
Probability supplies models for variation and the background for inference. The chapter distinguishes discrete and continuous random variables, probability functions, cumulative distributions, means, and variances. Binomial, geometric, Poisson, normal, exponential, and Weibull models illustrate different kinds of engineering phenomena under different assumptions. Joint and conditional distributions explain dependence and independence. Functions of random variables connect uncertainty in measured inputs with uncertainty in derived quantities, including propagation-of-error approximations. Simulation offers another way to investigate a complicated distribution. The central limit effect helps explain the behavior of aggregated quantities, but model conditions remain essential. A familiar distribution is useful only when its assumptions and physical interpretation are appropriate to the process being studied.
Chapter 6: Introduction to Formal Statistical Inference
Inference uses probability models to quantify the reliability of conclusions from data. The chapter develops confidence intervals and significance tests for means, variances, and proportions, including one-sample, paired, and independent-sample settings. Pairing is a design feature that changes the relevant analysis; it should not be ignored merely because two columns are available. Large-sample approximations and small-sample normal-theory methods have different conditions. The chapter also distinguishes confidence intervals for parameters from prediction intervals for future observations and tolerance intervals intended to cover a specified proportion of a population. These answer different engineering questions. A p-value assesses compatibility with a null model, while an interval can better communicate the size and precision of an estimated effect.
Chapter 7: Inference for Unstructured Multisample Studies
Several groups can first be analyzed without imposing factorial or regression structure. The one-way normal model separates group means from within-group variability, and residuals help assess whether its assumptions are plausible. The chapter develops comparisons among means, individual versus simultaneous confidence statements, and one-way ANOVA. An omnibus rejection does not identify every differing pair, and multiple comparisons require attention to the combined error rate. The chapter then connects repeated process samples with Shewhart control charts for measurements, proportions, and counts. Control limits describe expected process behavior under a model; they are not interchangeable with engineering specification limits. Signals invite investigation of process changes rather than automatic adjustment after every random fluctuation.
Chapter 8: Inference for Full and Fractional Factorial Studies
Factorial studies organize combinations of input levels so main effects and interactions can be investigated systematically. The chapter attaches inferential methods to the descriptive effects introduced earlier, including two-level multifactor experiments. Replication supports estimation of random variation, while unreplicated studies require additional assumptions and careful assessment of which effects may be negligible. Fractional factorial designs reduce the number of runs but create aliasing: some effects cannot be separated using that design alone. Resolution describes important aspects of this confounding structure. Efficient experimentation is therefore a tradeoff between resources and what can be learned. An apparent factor effect should be interpreted with the alias structure and physical knowledge in view, rather than accepted as uniquely identified.
Chapter 9: Regression Analysis—Inference for Curve- and Surface-Fitting
Regression inference adds uncertainty to fitted relationships. The chapter develops estimates and tests for coefficients, confidence statements about a mean system response, and intervals for future outcomes. These intervals differ because predicting an individual observation includes variability beyond uncertainty in the fitted mean. Multiple regression extends the model to several terms and connects with ANOVA, factorial analysis, and response-surface studies. Residual checks remain central: a polished coefficient table cannot compensate for a poorly fitting relationship or an inappropriate error model. A model linear in its coefficients can include curved functions of predictors. Interpretation should state the measurement scale, relevant input range, uncertainty, and physical plausibility before using the model for engineering decisions.
Appendix A: More on Probability and Model Fitting
The probability appendix extends the main narrative with events, conditional probability, counting, reliability, survival concepts, and maximum-likelihood fitting. Series and parallel system models illustrate how component reliability combines under stated assumptions, particularly dependence assumptions. Survival and hazard concepts describe failure over time, while likelihood compares parameter values according to how well they account for observed data under a chosen model. These topics deepen the modeling toolkit without replacing the book's emphasis on physical context. Additional mathematical detail is most useful when it clarifies the engineering question and the limitations of the proposed probability model.
Appendix B and answer material: Using references to check reasoning
The distribution tables support calculations throughout the book, while answers to section exercises allow selected numerical results to be checked. A correct lookup requires identifying the distribution, degrees of freedom where relevant, and the intended tail probability. Agreement with an answer is only one check: units, study structure, assumptions, and the meaning of the interval or test also need to agree with the problem. The reference material is best used to validate an independently reasoned solution rather than to reverse-engineer a procedure from the final number.
Study instructions
Begin an engineering data project by stating the decision or question it is intended to support. Define what will be measured, the units, the conditions of collection, and the reason those measurements are relevant. Record instrument details and any limits on what the observations can represent.
Before analysing, document missing values, unusual observations, changes in procedure, and assumptions. Keep the original observations separate from transformed or summarized data so another reader can understand how a result was produced.
In a report, connect each conclusion with the evidence supporting it and state important uncertainty. Distinguish a pattern in the data from a demonstrated explanation of that pattern. Use the full source text and course instruction for the methods appropriate to a particular problem; these general suggestions are not attributed to an unread chapter.
Full-book practice and review: Design a small engineering study before selecting an inferential procedure. Define the response, factors, measurement process, sampling or assignment scheme, and likely sources of variation. Carry those decisions into descriptive displays, probability assumptions, and the later comparison, factorial, or regression analysis. Report the result with units and uncertainty, and explain which conclusions depend on the design rather than on the calculation alone.
Questions for reflection
- What question should the collected measurements answer?
- Which collection conditions must be recorded for interpretation?
- What can the evidence support, and what remains uncertain?
The study suggestions and questions are independent Academic Master editorial material.
Sources and coverage
Coverage follows the nine chapters and appendices of the openly released 2001 text. Legacy software and companion-site references are historical features of that edition. These original summaries draw on the source text, including chapter or section introductions and selected explanations, examples, exercises, and review material. They are condensed study guides, not a page-by-page account or a replacement for the complete resource. Additional synthesis sections are identified separately.
About access & copyright
This page provides book information and study material. Full-text access is provided by the original publisher or authorised source; a listing does not grant permission to republish the book.
Read our Library Access & Copyright policyQuestion
Define the purpose of the investigation.
Measurement
Record units, conditions, and procedures.
Analysis
Preserve the route from observations to results.
Reporting
Connect conclusions with evidence and uncertainty.
Reader ratings & reviews
Share your thoughts
Your review helps other students choose the right resources.
KEEP LEARNING
Your next great read
Mathematics Algebra
Fanshawe Pre-Health Sciences Mathematics 2
View Fanshawe Pre-Health Sciences Mathematics 2 — book Algebra
Fanshawe Pre-Health Sciences Mathematics 1
View Fanshawe Pre-Health Sciences Mathematics 1 — book Mathematics
Math 3080 Preparation
View Math 3080 Preparation — book Algebra
Linear Algebra with Applications
View Linear Algebra with Applications — book Business and Economics
Mathematics of Finance
View Mathematics of Finance — book Algebra
The Essence of Mathematics Through Elementary Problems
View The Essence of Mathematics Through Elementary Problems — book complex numbers
Making up Numbers: A History of Invention in Mathematics
View Making up Numbers: A History of Invention in Mathematics — book Business and Management
Inventory Analytics
View Inventory Analytics — book Challenges and roles for textbooks in a pandemic context