
This edited thesis brings together research by G. Jhansi, K. Sujatha and collaborators. Its three contributions include studies published in 2019 and 2023, listed in the publications section below. The manuscript is presented as a thesis incorporating previously published research.
Chapter 1 Introduction
Aquaculture
Aquaculture refers to the breeding, growing and harvesting of fish, crustaceans, mollusks, aquatic plants and other aquatic organisms. It includes mariculture, the cultivation of marine organisms for food and other uses, and fish farming, the commercial rearing of fish in tanks and other constructed enclosures (Ahmed et al., 2022). Aquaculture has been among the fastest-growing agricultural sectors in recent decades. Since 2013, it has produced more fish than wild fisheries. Its diversity of species, production methods, diseases, products and marketing systems distinguishes it from other agricultural subsectors. Scientific and technological developments have benefited many aspects of aquaculture (Yue and Shen, 2022).
Especially in low- and middle-income countries (LMICs), aquaculture is a significant and rapidly expanding source of animal protein nutrition. Fish supply over 20% of per capita animal protein ingested for exceeding 40% of world's community, while aquatic species account for 17% of all animal protein spent worldwide. “Except for poultry, the growth in worldwide food fish consumption (3.2%) has exceeded the developed in intake of flesh from every terrestrial animal creation sector mixed (2.8%) Schar et al. (2020). Aquatic products can be divided into two categories: exterior physical characteristics (like morphology or size) and internal characteristics (like chemical composition, flavor, or odor). Physical characteristics including size, shape, weight, colour and texture are crucial and frequently simpler to detect than internal characteristics. They help consumers form their initial impressions of whether or not the fish product is acceptable and suitable. Fish producers must therefore carefully assess and monitor exterior features. To maintain an aquaculture farm effectively, fish mass monitoring is crucial” Saleh, A (2020).
Compared to terrestrial farming, aquaculture is a fast-growing sector of food industry that excels for its wide variety of species, could increase flexibility of world food arrangement. Contrarily, only 40 types of land-based creatures are bred for objects, including "meat, milk, and eggs," and the industry is focused in a small number of these animals, despite the fact that variation results from a wide range of breeds and variants”. Out of the 200 plant species with important global creation, two-third of the world's fish production comes from just 10 species Cai, J et al. (2023).
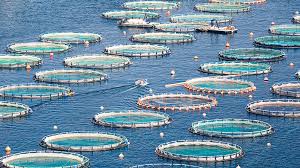
Figure 1.1. Operations of industrial finfish aquaculture
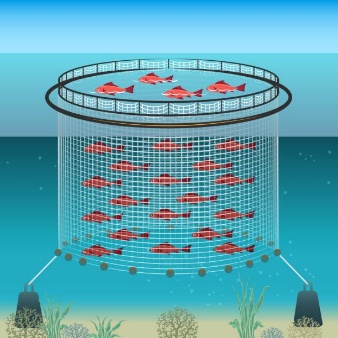
Figure 1.2. Illustration of aquaculture
Fish
Fish are aquatic vertebrates with gills and no limbs bearing fingers or toes. Many fish have an internal structure known as the swim bladder or air bladder. Fish occur in many forms and environments around the world (Raja et al., 2019).
Types of fishes
Ornamental fishes
Lake fishes
Reef fishes
Freshwater fishes
Marine fishes
Ornamental fish
In terms of value per unit weight, ornamental fish are among the most profitable fisheries products. They are produced using many of the same techniques and materials as food fish, although ornamental fish cultivation has not always been treated as a form of aquaculture. Ornamental marine organisms offer opportunities for international trade because of their colour and appearance, but their collection raises environmental and sustainability concerns. More than two billion live ornamental fish are handled in a global trade estimated at $15 billion. Alongside farm-raised species, this trade includes fish and invertebrates collected from the wild. Neon tetras, angelfish, goldfish, danios and discus are prominent species, while guppies and zebra danios account for more than 14% of fish shipped (Nag et al., 2020).
Although ornamental fish are produced using the same fundamental techniques and materials as food fish, ornamental fish cultivation has not historically been considered to be a type of aquaculture
Marine plants that are ornamental have more promise for commerce abroad because of their stunning colour and eye-catching exertion, but there are issues with their gathering from standpoints of the surroundings, ecology, and durability.
Exceeds 2 billion live ornamental fish are handled in estimated $15 billion worldwide ornamental fish trade. Additionally, broadly popular farm-raised ornamental fishes, the trade in ornamental fish also comprises larger quantities of fish and invertebrates that have been taken in the wild
Neon tetras, angelfish, goldfish, danios, and discuss are in charge of world's ornamental fish trade, with guppy and zebra danio value accounting for more than 14% of all fish shipped Nag, SK et al. (2020)
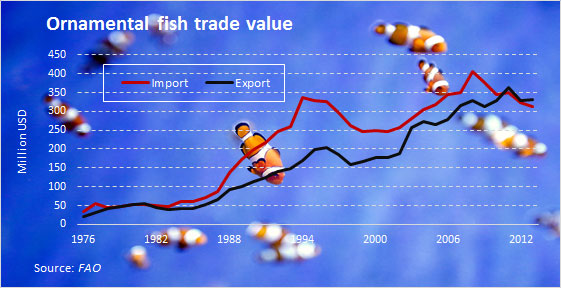
Figure 1.3. Ornamental fish trade values
Lake fish
The lake is renowned for its successful freshwater, brackish and saltwater fisheries. More than 0.2 million fishermen live in and around the lake thanks to its abundant fishery resources. The primary products of the lake's fishery are fish, prawns and crabs. The lake supports a variety of plants and animals, including several rare, sensitive and endangered species, making it a hotspot for biodiversity Sikder, J et al. (2021).
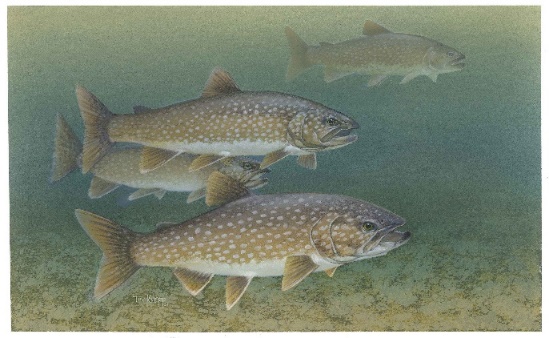
Figure 1.4. lake fishes
Reef fish
More than 8000 different kinds of vibrant, colourful fish call coral reefs home and many of them rely on eyesight to find food, escape predators, find partners and compete for resources. There have probably been more adaptations to the visual system on the reef than anywhere else on earth due to the number of species and the variety of light and lifestyle that can be found there. The specifics of this evolutionary innovation's powerhouse are now unknown and understanding is restricted to a small number of species within a small number of groups. Reef fish have developed visual systems that function effectively in the vibrant, sunny environments around them. This comprises colour vision systems with several spectral sensitivities, such as two, three, four or even five Su, G et al. (2021).
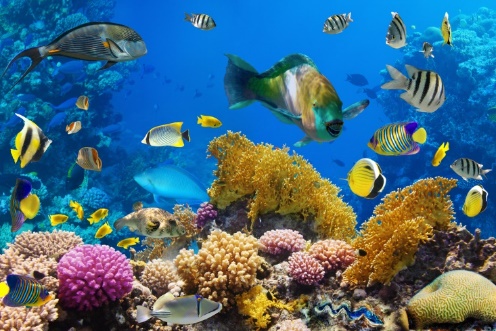
Figure 1.5. Coral reef fishes
Freshwater fish
Freshwater fish make up one-fourth of the world's vertebrates and provide valuable products and ecosystem services, yet human activities increasingly affect them. They regulate trophic networks and nutrient cycles, contribute to biomass production, and support ecosystem health and stability. They also serve as food sources and provide recreational and cultural benefits (Yan et al., 2021).
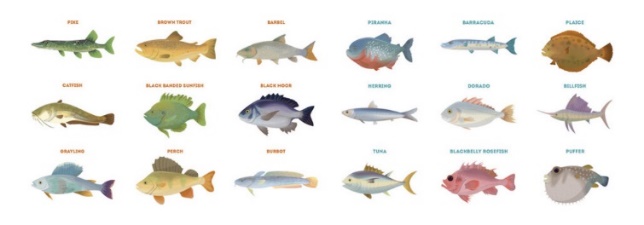
Figure 1.6. Freshwater fishes
Marine fish
Although 99.8% of planet's habitable space is covered by water, its resources are not limitless. The intensity, geographic scope and technical capacity of fisheries have all significantly increased during the past 50 years. Overfishing is therefore definitely the main danger to ocean biodiversity. It is challenging to monitor destruction of marine fish varieties since many exploited species go unmonitored, even while stock health of few regulated, watched fisheries enhances. Statistical methods utilized to gather destruction often rely on time series of alignments data, challenging to collect for widely dispersed species, especially marine fishes Maiti, B et al. (2020).
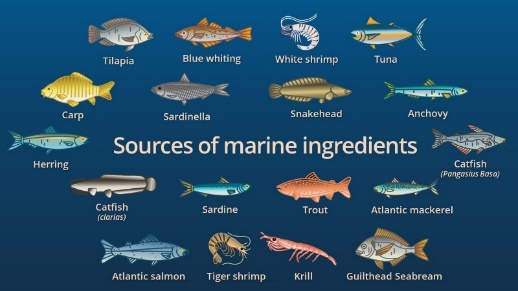
Figure 1.7. Marine water fishes
Human-related effects on fish
Since the beginning of the industrial age, anthropogenic actions have resulted in “cumulative emissions of carbon dioxide (CO2) and another greenhouse gases, most notably increasing atmospheric CO2 from 278 to 400 parts per million over last 4 decades”
This sudden increase in atmospheric CO2 has unavoidably led to significant changes in the environment, particularly those that affect aquatic ecosystems
The accumulation of glacier melt waters raises sea levels even more and this change in salinity will be most noticeable in polar locations
The world's oceans dissolved oxygen (O2) content will decrease as a result of global warming since O2 is lower soluble in warm water, since of higher lamination brought on through heating of surface waters, lower O2 provide to deep ocean
Freshwater habitats are directly impacted by climate change as altered “thermal and precipitation regimes alter flow dynamics and raise water temperature”
Additionally, anthropogenically-caused acid rain will accelerate acidify of rivers and lakes Rajme-Manzur et al. (2020)
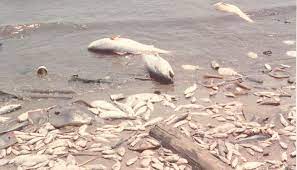
Figure 1.8. Human Effects on Fish
Human activities affect aquatic systems in several ways. Industrial waste discharged into water can harm fish and increase their vulnerability to disease. Excessive water consumption can also contribute to declining fish populations.
Fish diseases
Both in the wild and in aquaculture, diseases can have a devastating effect on fish. One of the most serious risks to aquaculture's economic success is disease, which is widely acknowledged. “A wide variety of pathogenic microbes, including microorganisms, viruses, protozoa, and metazoan microorganisms can cause fish illnesses.”
In Indian aquaculture, bacterial infections are the main cause of finfish disorders. The most widely produced kinds of fish in India are resistant to viruses like "tilapia lake virus (TiLV), nodavirus, koi herpesvirus (KHV), and red-spotted bream iridovirus (RSBIV)". Ichthyophthirius mulifiliis is the main parasite responsible for fish disease in India, albeit it has a less severe effect than bacterial diseases” Yang, H et al. (2023)
The main pathogens affecting fish aquaculture include “Lactococcus, Renibacterium and Streptococcus. Gram-negative organisms include Aeromonas, Edwardsiella, Flavobacterium, Francisella, Photobacterium, Piscirickettsia, Pseudomonas, Renibacterium, Tenacibaculum, Vibrio and Yersinia Laltlanmawia”, C et al. (2023)
Types of fish disease
Some kinds of fish diseases are discussed in this paper. They are,
Ichthyophthirius multifiliis
Acinetobacter (A. baumannii)
Epizootic ulcerative syndrome (EUS)
Velvet disease
Edwardsiellosis
Rhabdoviridae
Ichthyophthirius multifiliis
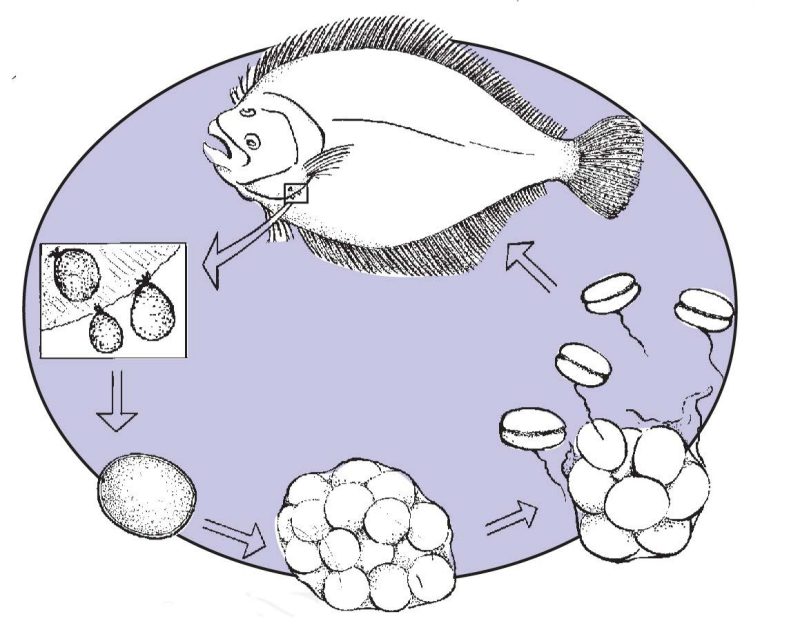
It is an extremely dangerous fish parasite that is present around the world. “Generative tomont, infective theront and the parasitic trophont are the three main stages of its direct life cycle”. Because of this trait, ichthyophthiriasis is also called a "white spot disease" in some circles. It typically results from bad water quality, crowded aquariums or unexpected temperature changes Mia, MJ et al. (2022).
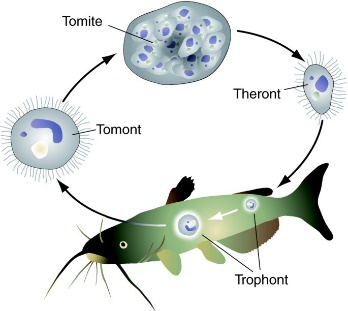
Figure 1.9. Life cycle of the pathogenic ciliate Ichthyophthirius multifiliis
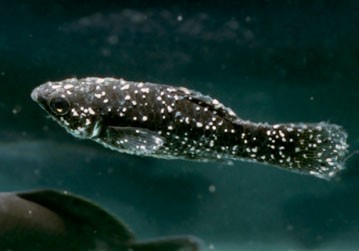
Figure 1.10. Infected fish with White Spot Disease
Acinetobacter (A. baumannii)
In 1995, disease epidemics in Chinese mandarin fish (Siniperca chuatsi) were linked to Acinetobacter (A. baumannii). A. baumannii was later identified as the reason of mass death in prussian carp (Carassais auratus gibelio) and channel catfish (Ictalurus punctatus), respectively. Other Acinetobacter species have been discovered in recent years to be significant fish illness outbreak-causing pathogens. “As emerging infections in farmed fish in Poland, A. johnsonii and A. lwoffii were isolated from sick rainbow trout (Oncorhynchus mykiss) and carp. Pneumonia, urinary tract infections, intravascular catheters and wound infections are the main causes Klūga”, A et al. (2021).
|
Figure 1.11. Fish affected by the A. baumannii |
Epizootic Ulcerative Syndrome (EUS)
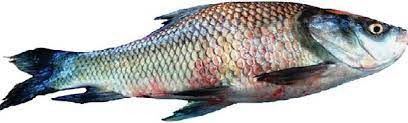
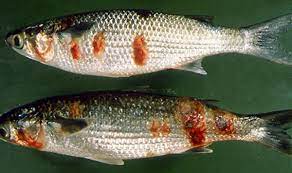
Epizootic Ulcerative Syndrome (EUS) is commonly recognized as red spot disease and is associated with oomycete fungi. Affected fish develop lesions that can occur on any part of the body, although they are most often visible on the surface. The disease can spread rapidly in water. Aphanomyces invadans, also known as A. piscicida, causes EUS (Irshath et al., 2023).
|
Figure 1.12. Fish infection by the disease Red spot |
Velvet disease
It is also called as “Rust or Gold dust disease”. The "dinoflagellates of the genera Amyloodinium and Piscinoodinium" are the cause, and they pose a major risk for heated water fish rearing facilities. As Piscinoodinium pillulare and P. limneticum are severe illnesses found in tropical and temperate freshwater fish, Amyloodinium ocellatum, "the marine equivalent," is a few of among the most serious parasites infesting warm-water marine or brackish water fishes. Piscinoodinium uses photosynthesis to obtain a major amount of its resources even though Amyloodinium lacks chloroplasts and light wasn't crucial to life” Shepherd, JG et al. (2023).
The life cycle of Amyloodinium ocellatum: Adrift swimming Rhizoids help dinospores attach to the host's skin where they eventually develop into trophonts. The reproductive stage, tomonts, is formed when detaching trophonts enclose and split. Dinospores emerge from the capsule following several cell divisions and infect fresh hosts.
|
Figure 1.13. Life cycle of Amyloodinium ocellatum |
Edwardsiellosis
Several Edwardsiella species cause edwardsiellosis in freshwater and marine habitat. For instance, E. piscicida (formerly E. tarda) is a frequent, significant germ linked to serious illnesses in a variety of fish Walker, PJ et al. (2022).
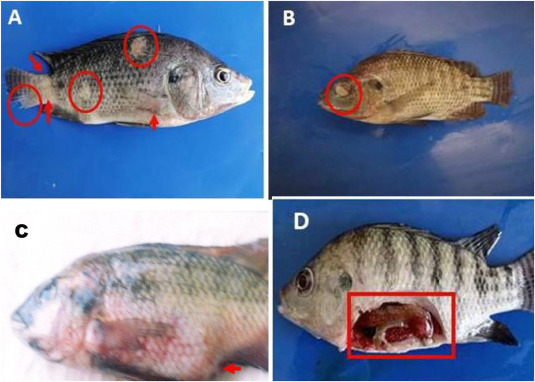
Figure 1.14. Phenotypic and molecular characterization of the causative agents of edwardsiellosis in fish
Rhabdoviridae
A significant group of negative-sense RNA viruses known as the Rhabdoviridae comprises diseases that affect both “ray-finned fish and marine mammals”. “International Committee on Taxonomy of Viruses (ICTV)”, which inspect category of total viruses, uses a process to assign a taxonomic classification to rhabdoviruses. “3 new subfamilies (Alpharhabdovirinae, Betarhabdovirinae and Gammarhabdovirinae), 3 new genera (Cetarhavirus, Siniperhavirus and Scophrhavirus), and 7 new species for viruses infecting fish or marine mammals became established as a result of a past revision of taxonomy carried out in collaboration with ICTV Rhabdoviridae Study Group” Goldberg, TL et al. (2023).
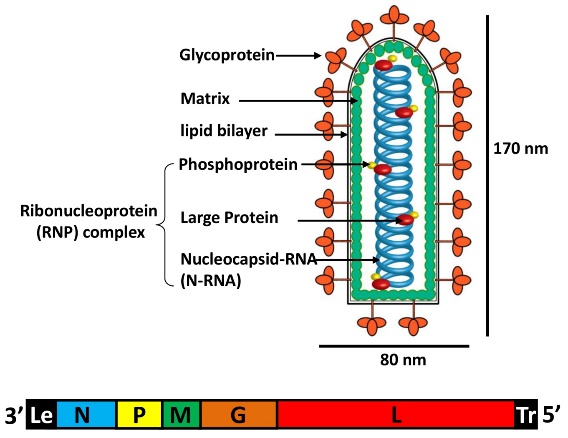
Figure 1.15. Structure of Rhabdoviridae
Alpharhabdoviridae:
The Alpharhabdoviridae, which includes “31 genera and 189 authorized species for viruses infecting mammals, amphibians, reptiles, birds, fish, insects, ticks or nematodes, is largest subfamily currently designated to the Rhabdoviridae”. Dimarhabdo viruses (dipteran-mammalian rhabdoviruses), a colloquial word for viruses belonging to the Alpharhabdovirinae, do not adequately describe the level of ecological diversity present in the group. The subfamily of viruses that infect teleost fish and marine animals today has five genera. According to alliance of the L protein series, every genus creates a “monophyletic clade of viruses”. Clades are divided into genera based on the genetic distances between them and the various ecological environments in which the viruses have evolved. As additional viruses are found and evolutionary linkages are better understood, the designation of genera may change in the future Amosova, V et al. (2019).
Gammarhabdovirinae:
The Gammarhabdovirinae, which consists of just one genus of viruses that infect teleost fish, is “smallest subfamily in the Rhabdoviridae”. There are now 4 kinds of Novirhabdovirus: “Salmonid Novirhabdovirus, Piscine Novirhabdovirus, Hirame Novirhabdovirus and Snakehead Novirhabdovirus”. Virus is enzootic in western North America's coastal regions and river systems, but it has distributed to “Asia and Europe via the movement of contaminated livestock”. IHNV is classified into some subgroups, differ in geography and host specificity, as well as “5 primary genogroups (U, M, L, J, and E)” Chang, CC et al. (2021).
Identification Techniques
Thanks to the advancement of IoT and 5G connections, an immense quantity of ecological information may be continuously and quickly collected by using a variety of sensors, such as underwater photographic equipment, oxygen concentrations in the water metres, and sensors for temperature. Smart aquaculture is a trend that is further accelerated by AI and IoT (AIoT). As the aquaculture sector inexorably involves breeding and selecting brood fish, employing AIoT can provide significant benefits for tracking the health state of produced fish. Deep learning algorithms, which are often based on CNN, are capable of performing End-to-End detecting of examples of semantic objects like “fish without expressly defining attributes. Deep neural networks have recently been applied to numerous fish-related activities to produce cutting-edge outcomes” Raoult, V et al. (2020).
To determine AIoT method for smart culture management, an intended method pattern is used. "Placed on a base in a box with instruments, a submersible the lens, an interpersonal link.”. Information from an “autogiro and a remotely operated vehicle (ROV)” were unified into an Omni IoT method, combine screening, detection method of feed supply. Entire gathered information is sent to an onshore base via communications devices also sent via an “Internet connection to a cloud system” Consalvo, I et al. (2021).
Remotely operated vehicles
Originally, underwater “Remotely operated vehicles (ROVs)” were used to survey or explore marine habitats that were too dangerous for humans to enter, like deep oceans (below 100 meters to ten kilometres deep).
In the past, ROVs were thought of as cumbersome, expensive pieces of machinery that might weigh up to 310 tonnes and be used for underwater mining. Because of new advances in the miniaturisation of "electronics, the incorporation of aerial drone stabilisation hardware, improvements in the resolution and quality of video feeds, and the potential for virtual reality interfaces, ROVs can perform similar functions to human consumers in deeper waters while preserving the advantage of permission to better deeper levels.” Wang, JH et al. (2020)
Small, affordable "mini-ROVs" have sped up growth of new ecological techniques in trivial waters, like behaviour studies of freed sharks and wild Loggerhead Sea turtles. Mini-ROVs are small, less expensive versions of larger ROVs that are under 30 kg in weight and less than 1 m long. Due to the requirement for a large number of repetitive, quick diving also distance of location, research with mini-ROVs would not be feasible for human divers to locate fish
The combination of hardware and software interfaces from drones, such as the “IMU (inertial measurement unit) and full HD video”, has allowed the most recent generation of mini-ROVs to overcome all of these drawbacks. Researchers may be able to evaluate whether the most recent origination of ROVs offers an enhancement over earlier interpretations for studies in shallow marine surroundings for the detection of fish by reconsidering efficacy of contemporary mini-ROVs also comparable them to snorkelers
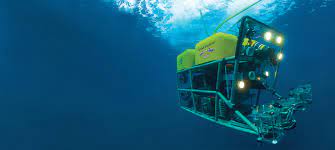
Figure 1.16. Underwater Remotely Operated Vehicles
Early Detection
Farmers must act quickly to prevent a potential epidemic of fish diseases and to determine their root causes to avoid financial losses that could have a detrimental impact on the country's economy. In accordance with to biochemical research, attendance of specific bacteria also viruses be able to “change level of pH, DO, BOD, COD, TSS, TDS, EC, PO43-, NO3-, and NH3- in water, leading to death of fish. Viruses and bacteria are typically the cause of fish diseases” Nayan, AA et al. (2021).
AI algorithms and ML approaches became effectively utilized for categorization and decision-making issues. Intelligent algorithms can infer highly precise departure from the chosen sets of configurations and learn from the parameter space of the system the proper desired categorization based on a real dataset, which may be used for decision-making. Higher performance from learning is guaranteed by the algorithm's hierarchical architecture. Gradient boosting, a machine learning technique, uses the “decision-tree-based in-built hierarchical structure based on a regression algorithm to classify complicated situations and aid in automated decision-making” Nayan, AA et al. (2020).
Gradient boosting technique
Gradient boosting is a machine learning technique used to solve regression and classification problems in complex decision-making settings. The model uses decision trees in successive computational steps. At each step, it performs a classification task by minimizing a differentiable loss function. During training, the models are combined additively using a low learning rate (Upadhyay et al., 2020).
Features of gradient boosting technique: The fundamental characteristic of functional design, performance gradually improves design gains knowledge from each subsequent calculation and learns to reduce errors through estimating damage function. As a result, design gradually learns intricate relationships between “parameters and variables, just as the algorithm does with each new model generation” Vishnoi, VK et al. (2021).
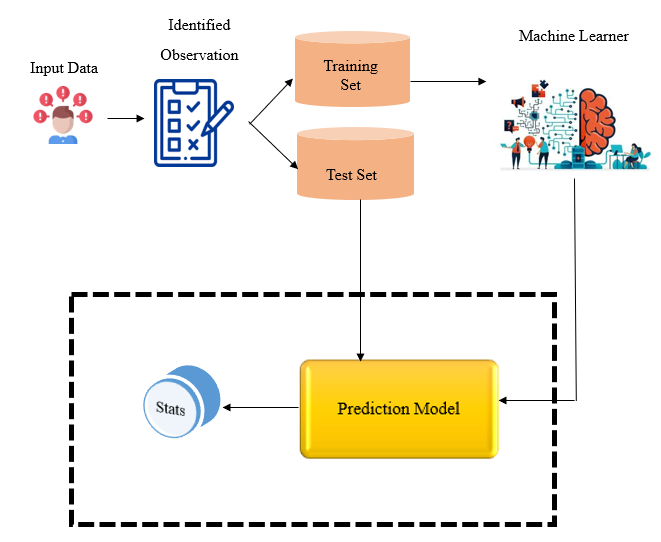
Figure 1.17. Working Procedure of the Gradient Boosting Technique
Image Processing
In terms of fish detection, there are currently sensors and cameras that can pick up any movement. While this movement may be brought on by fish, it may also be brought on by other objects passing by, such as leaves or logs. Inaccurate results may occur from either overestimating the quantity of fish or by arbitrary removal of a portion of the registered objects to account for debris. “Fish can swim in groups, therefore a group of 5 be able to only register as one entity, which is another problem”. To extract the features from the photos, image processing techniques are applied. Image segmentation becomes crucial in many study areas, including computer vision, artificial intelligence etc, Malik, H et al. (2023).
To recognize kinds of fish existence studied, conventional approaches for fish recognition may employ either ML technology or by hand created benchmarks. Growth of intelligent aquaculture is dependent on request of “Computer Vision Technology (CVT)”. Fish aquaculture uses CVT extensively to find, categorize, recognize, quantify and count fish. Understanding the phenotypic characteristics of fish that dwell in aquatic habitats can help with this.
Accurate fish identification is one of the most important jobs in expanding the fish farming industry. Various scholars have begun utilizing DL in their operate on object recognition procedures as a result of its continued advancement. DL can effectively also spontaneously learn new information, extract characteristics. Thus, the DL-based object identification technique has the potential to be utilized to fish for things with broad, unimportant properties Hu, X et al. (2021).
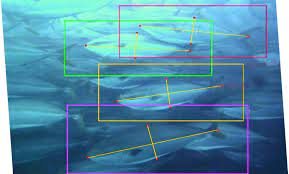
Figure 1.18. Fish identification using DL Technique
“The use of DL techniques can be used to overcome issues with a lack of intelligence and poor output while analysing huge, multisource, and homogenous big data in fishery. To enable intelligent fish farming, DL offers cutting-edge analytical tools for discovering, measuring and comprehending vast volumes of details in big data”.
These tools include “automatic feature learning and high-volume modeling capabilities”. By allowing computers to construct big concepts from simpler ones, Deep Learning (DL) addresses the fundamental issue with representation learning. “Computers have a difficult time directly comprehending significance inherent in raw sensory input data. DL breaks down this complicated mapping into a layered sequence of simpler mappings to address this issue” Reithaug, A (2018).
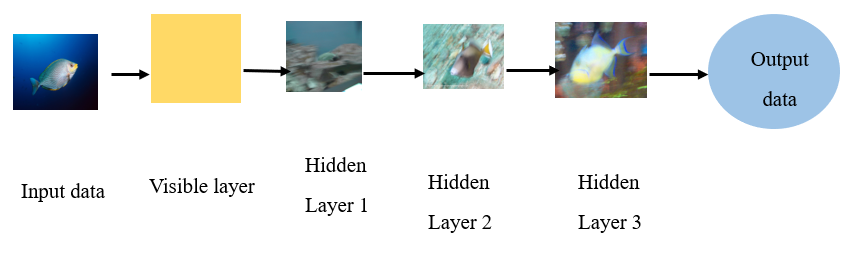
Figure 1.19. Example of fish detection using Deep Learning Techniques
As shown in Figure 1.19, when an image enters the visible layer, successive hidden layers extract increasingly abstract information. The first layer can identify an edge by comparing the brightness of neighbouring pixels.
Machine Learning
Machine Learning was first used by Arthur Samuel in 1959. Some disciplines, including deep learning, have sprung out of machine learning as it has slowly but surely matured over the past few decades. The potential of machine learning was constrained in the early days of the field due to issues with expensive and inefficient technology, a dearth of large datasets and improperly optimized algorithms. The entry barrier has decreased over the past ten years as a result of advancements in other industries. Big data, open-source libraries, powerful hardware, ongoing software advancements, frameworks and more exist today. These factors work together to propel machine learning to its point of overblown expectations, where the general public's interest in the subject is at its strongest Wang, H et al. (2022).
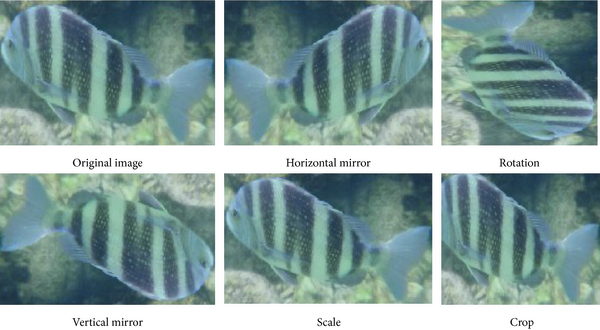
Figure 1.20. Fish Detection using Machine Learning
Support vector machine
Support Vector Machine (SVM) is a widely used supervised machine learning method that has produced useful classification results across different fields. It provides a classification tool for making predictions about unlabelled data. This study considers three kernel functions for identifying fish disease and discusses an architecture that combines SVM with CNN for image classification. SVM can produce accurate results in a variety of settings (Abinaya et al., 2022).
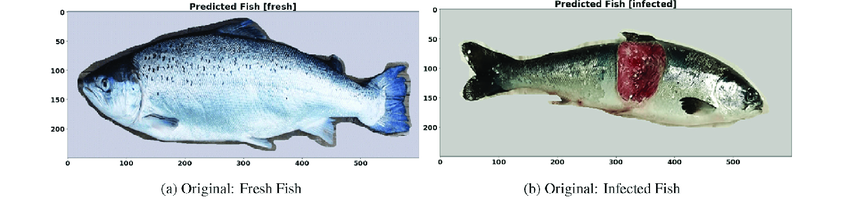
Figure 1.21. Infected fish identified using SVM technique
Deep Learning
Deep refers to a neural network that mimics our brain by having numerous layers. Big data sets may now be gathered, managed and analyzed thanks to the development of powerful computing facilities, high-performance GPUs and ASIC accelerators. Because overfitting issues in deep learning can only be resolved with sufficiently big data sets. Deep learning-based methods are being used more and more in a variety of fields and have some advantages over conventional object detection and computer vision algorithms. Many robotics systems now perform better thanks to making use of deep learning. It is essential to have a sufficient number of instances from the photos that have been gathered in advance for deep learning in computer vision.
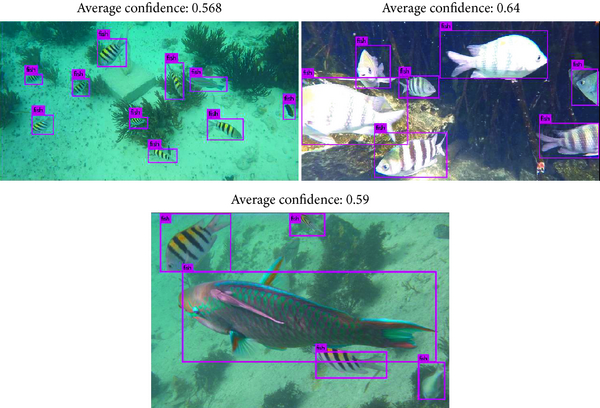
Figure 1.22. Fish detection using Deep Learning
A learning algorithm, however, is also crucial. While deep learning can be used to increase feature extraction accuracy through neural networks, traditional computer vision and image processing technologies suffered from this problem. Deep learning opens up a wide range of opportunities, one of which is the ability to detect fish with little to no human intervention. Numerous useful applications can be made possible by being able to locate and identify any kind of object and there is more than enough data to do so. In actuality, more than “2,500,000 terabytes of data are made every day and 90% of all data made in the last two years”. This wealth of information can assist in resolving a wide range of issues and benefit humanity in comprehending the complexities of almost everything Sveen, L et al. (2021).
Neural network
Deep learning neural networks have gained popularity during past years. “In ImageNet Large Scale Visual Recognition Challenge in 2012, researchers utilized CNN to categorize images also test accuracy was many beyond that of conventional methods”. Quantity of calculation was enormous because each image would include features taken from hundreds of proposals in various sizes. Recently, greater speed of R-CNN has become widely used in artificial intelligence (AI), involving recognising things, detection of targets, and image categorization. This is because it significantly lowered the computing burden Ramos, P (2020).
Prevention
Aquaculture for Atlantic salmon and rainbow trout has seen a sharp rise in disease, especially bacterial diseases like Aeromonas salmonicida and Yersinia ruckeri. As a result, huge doses of antibiotics were utilized, which raised worries about antibiotic resistance. Thus, immediately practical fish vaccines towards enteric red mouth (ERM), vibriosis, and furunculosis were produced. ERM vaccine for salmonid fish, which was authorized in 1976 in the USA, was the first vaccine for aquaculture Caffara, M et al. (2020).
Mercantile vaccines
There are fish vaccines available for a variety of fish species, such as the Atlantic salmon, Rainbow trout, sea bass, sea bream, tilapia, amberjack, yellowtail, catfish and Vietnamese catfish Madrid, R.R et al. (2021)
When using commercial vaccines for fish, there are some important factors to take into account, including the type of fish, immune system status, life cycle and production, when diseases occur, “farming technology, environment, stress factors, nutrition and financial advantages” Ben Hamed, S et al. (2021)
“Responsible Use of Medicines in Agriculture union offers recommendations for the use of fish vaccines. The bulk of business vaccines are managed via intraperitoneal injection and contain adjuvants” Adams, A (2019)
To support the development of new vaccines and the evaluation of existing ones, researchers must assess the immune responses produced by vaccination in teleost fish. T and B lymphocytes play important protective roles in the adaptive immune response. Methods have been developed to extract GALT cells from salmonids. These cells display T-cell, B-cell and dendritic-cell markers and respond differently to panels of PAMPs, cytokines and PHA. Such findings can support the development of oral vaccines (Chen et al., 2022).
For example, methods for the extraction of GALT cells from salmonids became devised, those cells became found to display a variety of T-cell, B-cell, dendritic cell tags as well as to respond differently to a “panel of PAMPS, cytokines also PHA. These details will help in creation of oral vaccines” Chen, W et al. (2022)
Challenges
Finding protective antigens needs some methods and it is difficult.
The bulk of commercial fish vaccinations are intraperitoneal injections of destroyed whole-cell pathogen preparations
When a pathogen species is extremely heterogeneous, it is challenging or expensive to cultivate it, some epitopes immunosuppress immunity and generally when a pathogen is intracellular or complicated (such as a parasite), using entire pathogens in a vaccine might be problematic Mishra, A et al. (2018)
Additionally, some vaccinations may not be best administered via injection and mucosal administration may be necessary for complete immunity; nevertheless, advance in creation of mucosal vaccines became hindered through absence of catalysts and a lack of fundamental information
The expense of renting employees to inject fish and appliance play a significant influence on the availability of “commercial fish vaccines in LMIC, where cost of syringing fish may also be restrictive in some nations” Charlie-Silva, I et al. (2019)
Numerous factors, such as changes in physical, chemical features of pond water, like “elevated turbidity, temperature, salinity, pH, water conductivity and low dissolved oxygen levels, accelerate the spread of bacterial infections also illnesses in fish farms” Buhat, CAH et al. (2021)
Treatment
There are some methods to avoid infection and treat the fishes from diseases like Halting the parasite's cycle of transmission, Raising awareness among consumers and Removal of the infectious phases.
Halting the parasite’s cycle of transmission
To stop the parasites' life cycle and avoid infection, some strategies can be used. For instance, to stop the first-stage larvae of intestinal flukes and tapeworms from reaching their intermediate hosts, it is crucial to identify and treat infected individuals and set up infrastructures for the removal of excreta in homes and population centers. Though controlling parasite infection in fish may seem impossible, breeding fish in enclosed farms with little to no contact with other hosts that are involved in the parasite's life cycle can reduce the likelihood of transmission of the parasite's developmental stages between fish and these hosts, interrupting the parasite's life cycle Arru, B et al. (2019).
Raising awareness among consumers.
Humans can contract fish-borne parasites via eating contaminated raw or rare fish or delicacies made from fish that hasn't been thoroughly prepared, such sushi and sashimi. As raw fish may contain infectious/viable parasite stages, consumers may be exposed to fish-borne parasites more frequently as a result. Therefore, discouraging people from consuming raw fish or seafood that has not been adequately prepared or frozen is a straightforward but highly effective preventive method to control these parasites.
Additionally, people should follow safe food handling, cooking and preparation practices. The infective stage of the majority of parasites can be effectively eliminated from fish by deep-freezing and properly frying them. Regulations provide that fish or fisheries products meant for raw consumption must be frozen at a temperature of −20°C for at least 24 hours in every member state of the European Union; nevertheless, individual consumers do not always strictly abide by these guidelines Cong, W et al. (2021).
Removal of the infectious phases
The best ways to lessen the chance of ingesting the contagious anisakis larvae are to thoroughly cook fish and eviscerate it as soon as it is caught. “Anisakis larvae are rendered inactive by heating to 60 °C for at least one minute, freezing to −35 °C for at least 15 hours or keeping at −20 °C for at least 24 hours”. Anisakis larvae in Arrowtooth flounders are destroyed by microwave cooking.
However, heat may not reach every area of the fish's body in residential microwave ovens (2450 MHz, 700 W), allowing some larvae to survive. Anisakis larvae in mackerel fillets may become nonviable during high-pressure, nonthermal processing (300 MPa for 5 min). Except for Anisakis, which has a high radioresistance (10 kGy), the least effective dose of gamma radiation for fish parasites is >0.1–0.5 kGy. “The larvae of D. latus can be killed by freezing at −18°C for 24 hours or by cooking at 55°C for 5 minutes”. Metacercariae in fish must be inactivated by temperatures as high as 100°C for more than 15 minutes for intestinal flukes like Heterophyes Ziarati, M et al. (2022).
Validated freezing schedules depend on the fish, parasite and processing conditions. FDA guidance describes storage at −20°C or below for seven days, freezing at −35°C or below until solid followed by 15 hours at that temperature, or freezing at −35°C until solid followed by 24 hours at −20°C or below. These conditions may not be suitable for particularly large fish (FDA, Chapter 5).
Drawbacks
A major problem in fish farming practises is bacterial illnesses, which are often categorised as "parasitic, viral, bacteria, or fungal diseases” Maurya, PK et al. (2019).
These illnesses typically have high rates of death and morbidity, which harms “farmers, consumers and environment Hsu, YF et al. (2019). These diseases are caused by a variety of microorganisms.
Fish that are stressed by these environmental variables are more susceptible to diseases. “The aquaculture business in mainland Tanzania has had to deal with a few documented bacterial illnesses because of the way aquaculture is currently practiced there”. Five genera are thought to affect wild and farmed freshwater fish in mainland Tanzania Mzula, A et al. (2021).
In the aquaculture sector, bacterial illnesses caused by more than 13 bacterial species have been reported globally. Aeromonas, Pseudomonas, Edwardsiella, Flavobacterium and Streptococcus are the genera Servili, A et al. (2020).
Summary
This study uses machine vision to classify fish as infected or uninfected. Classification depends on the selected feature set. After image processing techniques extract features, Support Vector Machines (SVM), Deep Learning (DL), Neural Networks (NN) and gradient boosting approaches can be used to classify disease. The research focuses on applying artificial intelligence to fish disease detection.
.
Chapter 2 Literature Survey
Introduction
In developing countries, fishing is a major contributor to social development, money generation, and food security Assefa, A & Abunna, F (2018). In India, fishing is a steadily expanding industry with a wide range of resources. More than 14.50 million students in primary school are thought to be either directly or indirectly dependent on this industry for their financial security Mishra, SS et al. (2017). Aquaculture involves the careful breeding, feeding and management of aquatic organisms to produce seafood for food usage, ornamental use, scientific study and other applications. As natural fish supplies in oceans, rivers and lakes are frequently overexploited or depleted, aquaculture is essential for supplying the growing global demand for seafood products Rodger, HD (2016). To preserve the wellbeing and sustainability of aquaculture activities, prompt and effective fish disease identification is crucial. Fish illness diagnosis has historically relied on manual observation by specialists, which can be labor-intensive, time-consuming and vulnerable to subjectivity Fazio, F (2019). There has been a paradigm shift in identification and screening of diseases as a result of technological breakthroughs, notably in areas of AI and image processing. Way fish infections are identified, treated and managed has the potential to change thanks to AI-driven methods combined with image processing methods Cui, S et al. (2020).
In this context we examine a number of experiments, looked at how ML techniques could be used to identify fish infections. In these studies, fish photos are first processed using image processing and segmentation and then significant features are extracted using ML methods like SVMs, K-means and C-means fuzzy logic clustering and Random Forest. Retrieved traits are then applied to classify the illnesses and locate infections in fish. In diagnosing fish infections, the suggested approaches have demonstrated high accuracy rates ranging from 88.87% to 97.90%. The use of Convolutional Neural Networks (CNNs) for spotting wounds and lice in salmon fish farms is covered in the paper. Compared with other well-known models, the suggested CNN model has demonstrated a high-test accuracy of 96.7% in diagnosing wounds and fish lice. In these investigations, significant features are extracted from fish photos using image segmentation and pre-processing to reduce noise. The retrieved traits are then applied to classify the illnesses and locate infections in fish. When it comes to diagnosing fish infections, the suggested approaches have demonstrated high accuracy rates ranging from 91.42% to 97.90%.
Identification of Fish Disease Using Machine Learning
Ahmed et al. (2022) investigated salmon fish disease in aquaculture, with help of ML algorithm and faultless picture processing, we can detect the fish that have different disease infections. There are two sections to this work, to minimize noise and magnify image respectively, image pre-processing and segmentation became used in basic component. In second section, using ML SVM method with a kernel function, we extract relevant features to categorize the diseases. The outcomes have provided evidence that our applied SVM functions admirably, with accuracy rates of 91.42% and 94.12%respectively, with and without augmentation.
Sikder et al. (2021) presented a K-means and C-means fuzzy logic clustering are used to segment filtered image in fish disease diagnosis applications. Features are extracted from segmented regions utilizing GLCM. At last, test image is classified using M-SVMs. Proposed methodology supplied highest accuracy rate when match to another current process, with K-means accuracy of 96.48% and C-means accuracy of 97.90%.
Mia et al. (2022) accomplished a thorough investigation of expert systems capable of continuing with a smartphone-taken image and identifying a sickness. A segmentation algorithm is used to separate disease-free section from disease-attacked portion using the two sets of features that have been chosen. Eight well-known classification methods are also put into practice in accordance with the performance evaluation matrices. The Random Forest's obtained accuracy of 88.87% is encouraging enough.
Santana et al. (2016) investigated when exposed to LPS from Pseudomonas aeruginosa for 8 hours, rainbow trout develops immune response capacity. Hepcidin, cathelicidin-1 and IL-8 are studied in this process. At 34, 42, 56 and 66 days after hatching (dph), total RNA was isolated from fry. Hepcidin and cathelicidin-1 transcripts were only found at days 34 and 42, but IL-8 transcripts were found from days 34 to 66.
Attia et al. (2021) sought to identify Clarias gariepinus, an African catfish, gets sick with three digenetic trematode species and affected fish exhibits associated morphological impacts. The intestines spores were identified as Orientocreadium batrachoides and Masenia bangweulensis based on their morphological and molecular traits. Through the sequencing of their 28S (LSU rRNA) and 18S rRNA (SSU rRNA) genes. This these parasites were determined to be members of the families Orientocreadiidae and Cephalogonimidae, separately.
Bi et al. (2023) investigated the characteristics of rainbow trout included slow movement, lack of feeding, a dark body colour, exophthalmia and sporadic skin ulcers. Infected rainbow trout livers, heads, kidneys, spleens and eyeballs were used to isolate pathogens. To verify the pathogenicity of the chosen isolate, rainbow trout were experimentally infected. Similar illness symptoms were seen in experimentally infected fish as they were in naturally infected fish.
Sommerville (2012) presented a technique for controlling parasite infection without the use of chemicals. It discusses possible prophylactic strategies, disease management in cultural contexts and non-chemotherapeutic interventions. Both currently accessible and potentially useful approaches are covered. The strategies described here are crucially meant to be employed together as they represent concepts for When pharmacotherapy is the only treatment option, IPM is used to treat infection by parasites in livestock aquaculture
Mosser et al. (2013) looked at the effectiveness of the technique used to catch and move 26 mature spring-run Chinook salmon upstream in Butte Creek, California. Before they reached their summer holding habitat, these fish stopped migrating upstream of their own free will. Temperature tags offer helpful information to estimate thermal exposure and time of death, and radio tagging has proven to be an effective method for tracking survival and movement of relocated fish. Compared to a 10% tag heal rate for a previous study employing fin clips, 23 tags (88%) were healed.
Gupta et al. (2022) proposed a method for detecting wounds and the presence of lice in the ecology of a live salmon fish farm using image-based machine learning. For the identification of wounds and fish lice, a convolutional neural network of 15 convolutional and 5 dense layers is suggested. In comparison to the fixed VGG-19 and VGG-16 models, which have test accuracies of 91.2% and 92.8% respectively, the proposed methodology has a test accuracy of 96.7%.
Yilmaz et al. (2023) approached a Machine learning method that were used in a trout farm to study potential influences on disease-causing condition of the pathogenic bacteria Lactococcus garvieae and Vagococcus sp. At intervals of every two months, physico-chemical parameters of water were recorded, fish samples were taken and microorganisms were identified. The key independent variables in the resulting dataset were identified using the eXtreme Gradient Boosting (XGBoost) technique. As a consequence, all three models gave results that were equivalent, with Support Vector Machine having the highest accuracy (93.3%).
Nayan et al. (2020) introduced an ML method for farmers to take required action to prevent possibility eruption and to avoid financial losses with evident negative effects on national economy, early detection of fish infections and determining the underlying causes are essential. In this research, a state-of-the-art ML method became implemented to identify and predict degradation of water quality quickly and precisely. This decision was inspired by the recent triumphs of machine learning techniques.
Jhansi, G & Sujatha, K (2023) presented a method for categorizing and recognition fish diseases that uses ANN. We present BWO-MA, a novel hybrid approach for resolving global optimization issues. We show BWO-MA-based ANN architecture generates improved execution when we contrast our suggested approach with currently used machine learning techniques. BWO-MA and ANN combination produced a high accuracy rate of 96.439% in identifying and classifying fish illnesses.
Author | Aim | Used Dataset | Technique Used | Advantages | Findings |
Ahmed et al. (2022) | Employing image processing, segmentation and extraction of the relevant characteristics to categorize diseases with aid of a SVM, eliminate noise and exaggerate the image. | lacking the addition of the data (163 diseased and 68 pure), and with the additional information (785 diseased and 320 pure), respectively. | SVM | SVM functioned admirably, achieving accuracy rates of 91.42%, 94.12% with and without augmentation, separately. | In future, plan to employ different CNN framework also utilize several fish datasets |
Sikder et al. (2021) | to create a system for automating the identification and categorization of aquatic animal illnesses | Images of fish were taken in Bangladesh's Sunamganj Hoar and Rangamati Kaptai Lake. | K-means, C-means fuzzy, Gabor’s Filters and GLCM and Multi Support Vector Machine | As evaluated to various existing approaches, the proposed methodology had an outstanding accuracy rate, with K-means accuracy of 96.48% and C-means accuracy of 97.90%. | A better segmentation system, better classification algorithms and DL methods, applied to various feature descriptors will all be presented as guidelines in the future. |
Mia et al. (2022) | Our goal is to identify fish diseases quickly and accurately so that we can assist rural farmers who depend on them for fish farming. | Digital image that a digital camera or smartphone has taken | K-means clustering | The accuracy of the suggested methods is 88.87%, which is encouraging. | Future research might expand datasets, focus on a much wider range of fish diseases. |
Santana et al. (2016) | Studying hepcidin, cathelicidin-1, and IL-8 will help you qualify growth phases at, rainbow trout gains the ability to mount an immunological response to LPS from Pseudomonas aeruginosa for 8 hours. | Fry were harvested at 34, 42, 56 and 66 days after hatching (dph) for total RNA. | DPH | It could be possible to identify compounds with biological effects that can be utilised as a proxy for grown fry health. | Further methods to assess fry vulnerability to PAMPs are currently being researched using aspects from this work as well as other control and effector compounds of immune system response. |
Gupta et al. (2022) | To identify wounds and presence of lice in the ecology of live salmon fish hatchery | The datasets evenly distribute photos of salmon in good condition, sea-louse-infested fish, and wounds taken from live fish tanks. The system was validated using a total of 20% of the dataset. | CNN | Comparing the suggested methodology to confirmed VGG-19 and VGG-16 designs, which have test accuracy of 91.2% and 92.8%, respectively. | Future work could involve employing object detection methods to find wounds and lice on fish. Fish also had a variety of wounds, from minor skin abrasions to significant deep wounds. The classification of these wounds can thus be considered as future research by the scholars. |
Yilmaz et al. (2023) | By immediately observing developments within the aquaculture circumstances, an efficient disease control programme may be conducted to enhance fish safety. | Physical and chemical properties of water and presence of bacteria in fish samples were used to create a dataset. | eXtreme Gradient Boosting (XGBoost), SVM | As a result, the output of all three models was equivalent, with Support Vector Machine having the best accuracy (93.3%). | Aquaculture sector can accomplish more accurate control of hazards and sustaining performance by use of smarter farming systems created by utilising computing power. |
Jhansi, G & Sujatha, K (2023) | For developing a BWO-MA with an ANN-based medical approach to fish disease prevention. | – | ANN | (BWO-MA) classified and detected fish illnesses with a high accuracy rate of 96.439%. | – |
Identification Of Fish Disease Using Deep learning
Hu et al. (2021) described a non-invasive, quick and inexpensive method to accurately identify fish behaviour in a mixed polyculture system using an underwater camera equipment and a deep learning architecture. Specific goals of this work are to construct a low-cost underwater imaging system that can visually characterize and quantify fish behaviour and to develop a lightweight deep learning structure to quickly and accurately recognize fish behaviour in a variety of situations. On a real dataset, the proposed approach was tested and the results were 0.897 for precision, 0.884 for recall, 0.892 for intersection over union and 240 frames per second.
Hong Khai et al. (2022) trained the model by taking pictures of shrimp on a shrimp farm with a robotic eye camera. Based on the density of shrimps, the image data were split into 3 categories: low density, medium density and high density. In order to discover proper parameters and create a better Mask R-CNN model, we employed parameter calibration technique. The improved Mask R-CNN model may therefore achieve an accuracy rating of up to 97.48%.
Yu et al. (2023) proposed to track health of fish skin in deep-sea cage culture and tested for illnesses hemorrhagic septicemia, saprolegniasis, benedeniasis and scuticociliatosis. Results demonstrate, MobileNet3-GELU-YOLOv4 model suggested in this study has a better capacity for learning and a smaller number of model parameters. Its mAP and detection speed improved by 12.39% and 19.31 FPS, separately, over the previous YOLOv4 model.
Petrellis (2021) methods became combined in just one setting with special techniques to assess the fish's relative length, height, all the region that it occupies in the image. The technique can be developed for determining the exact proportions of fish if two cameras are employed for recording fish that are hidden or angled. Fish length evaluation error ranges from 1.9% to 13.2%, which is similar to mentioned algorithms even though they are not fully functional and are trained on much bigger datasets.
Tengtrairat et al. (2022) Tilapia detection and weight estimate steps make up the approach. First, a model of a Mask Recurrent-Convolutional Neural Network is trained to identify the fish and extract its picture dimensions. The second step is the calculation of the Tilapia weight, where the suggested approach calculates depth of fish in tanks then transforms pixels in the Tilapia's retrieved image to centimetres. Weight of the Tilapia is then predicted by a trained model using reversion learning. The ideal models for weight estimation have been created using linear regression, RF regression and SV regression. The obtained experimental findings show that the suggested strategy produces a mean absolute error of 42.54 g, an average R2 of 0.70.
Jalal et al. (2020) introduced a hybrid approach to fish identification and categorization in unrestricted underwater films that combines optical flow and Gaussian mixture models with YOLO DNN. YOLO-based object detection systems were initially used to only record occurrences of fish that were still and easily observable. On both datasets, we achieve fish detection F-scores of 95.47% and 91.2%, as well as fish species classification accuracies of 91.64% and 79.8%.
Yu et al. (2013) identified the 3 main fish pathogens Vibrio harveyi, Vibrio anguillarum and Vibrio alginolyticus, a triLAMP approach was created. The inner primers of each of the three sets of four species-specific primers had 1 or 2 restriction enzyme sites. All three sets of primers are used in conjunction to execute TriLAMP in a single reaction. TriLAMP assays had sensitivities that were 102–103 times greater than those of conventional PCR assays.
Salama et al. (2016) developed strategies for keeping an eye on new disease problems affecting production animals, such as farmed Atlantic salmon. One such technique became creation of measuring standards for coverage of death occurrences, which may be a sign of a new problem, based on data collected from the production database of a single company. Here, we show that, in contrast to remarks of a single company, same creation designs occur for various production cycles and geographic regions using data collected by Scottish Environment Protection Agency between 2002 and 2009 for entire Scottish farmed Atlantic salmon industry. This suggests, reporting criteria can be applied nationally.
Author | Aim | Dataset Used | Technique Used | Advantages | Findings |
Hu et al. (2021) | to create a lightweight deep learning structure and an affordably priced underwater camera system that can quickly and precisely recognise fish behaviour in a variety of environments. | – | YOLOv3-Lite | On a real dataset, the proposed approach was tested and the results were 0.897 for precision, 0.884 for recall, 0.892 for junction over union and 240 shapes per second. | In the future, we want to create a smartphone app that will let us alert the right staff about suspicious behaviour. |
Hong Khai et al. (2022) | To develop a detection and recognition model based on a DL-based Mask R-CNN design for underwater prawn enumeration | The image shows a group of shrimps that served as the dataset for this study. A Canon EOS 80D DSLR camera was used to gather and take the photograph. | Mask R-CNN, ResNet-101 | Improved Mask R-CNN model is capable of 97.48% accuracy. | – |
Jalal et al. (2020) | To combine optical flow and Gaussian mixture models with YOLO deep neural network to develop a cohesive approach for locating and classifying fish in unconstrained subsurface movies. | The suggested methodology was assessed using the LifeCLEF 2015 benchmark from the Fish4Knowledge resource and a collection of data created by State UWA. | YOLO Deep neural network | Our fish detection F-scores on both datasets are 95.47% and 91.2%, and overall fish species categorization accuracy is 91.64% and 79.8%. | Future plans call for us to keep working towards the same objective of fish recognition and classification in unrestricted underwater movies and to suggest further enhancements like fish monitoring using stronger ML methods. |
Yu et al. (2023) | To create an image based on the YOLOv4 model utilising an integration algorithm technique. | – | YOLOv4 | The accuracy of detection is greater than 30 FPS when using Nvidia GTX 1060 (6G) as the training sample machine. | Large-scale, high-quality datasets of fish skin diseases must be developed in order to improve the generalisation of the network's findings in future generations and to integrate deep methods for image processing for immediate recognition and reporting of fish disease. |
Petrellis (2021) | To estimate fish's size, height, and area within image | Fish Image Dataset | Edge or corner detection and pattern stretching | Though the outlined methods are not completely functioning and have been tested on considerably larger historical data, the fish width prediction error ranges from 1.9% to 13.2%, which is comparable to them. | Future research will concentrate on training and evaluating DL methods with fish species, more readily available datasets. |
Tengtrairat et al. (2022) | In turbid water settings, a 2D computer vision system is intended to non-intrusively estimate weight of Tilapia fish. | We employ a Tilapia-file dataset with a range of Tilapia ages and an internal selected Tilapia-image dataset | Linear regression, random forest regression, and support vector regression | Obtained a MAE 42.54 g, R2 of 0.70 and average weight error of 30.30 (±23.09) grams in a turbid water environment | – |
Identification Of Fish Disease Using Image Processing
Chakravorty (2020) purposed a model of identifying fish disease, image processing methods currently exist. A novel method to recognize fish disease using a smartphone is expanded model and Image Processing. Utilizing image processing techniques. On-site detection of diseased fish became exceeded through AR model method. For the suggested method, a single diseased fish model with Epizootic Ulcerative Syndrome (EUS) was used.
Chakravorty et al. (2015) introduced a fish picture sick area segmentation using K-means clustering and colour features. HSV pictures and morphological operations are available for improved diseased area assessment and detection accuracy. Four photos of fish with EUS condition were used as a case study to assess suggested methodology. Experimental results give a strong sign of usefulness of the suggested strategy to enhance diseased diagnosis with more accuracy and correctly compute diseased area.
Dutta et al. (2016) introduced an entirely automated, effective and non-destructive image processing technique for tissue segmentation and fish sample freshness prediction. Fish sample's gill tissues are spontaneously sliced utilizing a clustering-based technique and the Haar filter is used to carefully extract their characteristics in the wavelet transformation domain. To forecast freshness of fish sample, 1, 2 and 3 level decomposition in wavelet domain is carried out, and coefficients produced at every level became evaluated.
Chakravorty (2021) introduced a technique, one fish with Epizootic Ulcerative Syndrome (EUS) was used in the research for the mobile AR app. The on-site use of image processing techniques to sick fish is impractical. Photos were captured using the AR method for Image Processing HSV to detect illness and improve quality.
Guo et al. (2020) investigated the ascaridoid nematode species composition and infection rates in “N. japonicus from South China Sea were investigated. The most common species was Hysterothylacium amoyense. For the first time, Hysterothylacium thalassini and R. lophii were found in Japanese threadfin bream”. For first time, A. typica was discovered in two distinct genotypes (total prevalence: 3.4%; mean intensity: 1.7 0.9).
Liu et al. (2021) presented a work to detect ClO- in real time and ratiometrically (0.58 lM detection limit), a lysosomal-targeted fluorescent probe called Cou-Lyso was developed. This probe had a considerable fluorescence change after reacting with ClO-, going from red emission (kmaxem = 610 nm) to green emission (kmaxem = 535 nm), with the ratio of I535 nm/I610 nm showing an increase of 76-fold from 0.04 to 3.03. The confocal imaging tests for Cou-Lyso demonstrated that this probe could find ClO- in zebra fish and live cells. Based on co-localization imaging tests, this probe has been successfully used to stain lysosome and visualize lysosomal ClO-.
Muniesa et al. (2022) an evaluation of disease incidence and mortality in Spanish marine fish farming has been made possible thanks to data from interviews and surveys. Although there were no significant differences between the species, the median survival rate data for seabream and seabass showed that the latter had a marginally higher rate. Since the causes of illnesses or losses were frequently not categorized and varied between companies, it was impossible to further distinguish between them. Additionally, EU Regulation 2016/429 mandates that Member States put disease surveillance programs in place to look into instances of "increased mortality" in order to be on the lookout for potential emerging diseases.
Ponpukdee et al. (2021) created monoclonal antibodies (MAbs), arrangements of OMPs produced from pathogenic Flavobacterium columnare were employed as antigens. At 24 hours after infection, an immunohistochemical assay utilizing two F. columnare specific MAbs identified bacterial infection sites in the gill, epithelium and intestine of fish. However, when four distinct MAbs were combined, detection limit rose to 5 102 cfu/dot, which is near to PCR assay. Experimental immersion-based F. columnare infection led to mortality in guppies (Poecilia reticulata).
Author | Aim | Data used | Technique used | Advantages | Findings |
Chakravorty (2020) | To develop a model in the detection and prevention of fish illness. | disease fish image was taken by the AR Mobile App | HSV | The outcomes of the experiment indicate that the diseased area is accurately segmented using the newly developed method. | The potential for fish disease identification via augmented reality and image processing is greater in the future as a means of overcoming the limitation. |
Chakravorty et al. (2015) | To more accurately calculate the diseased area and increase the accuracy of diseased diagnosis | EUS were gathered from several Barak Valley, Assam locations and identified by human experts. | K-means clustering and PCA method | Instead of using a broad diagnostic, it helps to adopt preventative and therapeutic measures to stop the transmission of disease amongst fish farms. | To improve the performance NN, genetic algorithms, SVM and fuzzy logic. |
Dutta et al. (2016) | To determine the fish's freshness using a non-destructive image processing technique. | Samples gathered from NIASM | k-means clustering and Haar filter. | coefficients at the third level of decomposition exhibit a monotonic variation pattern, and these coefficients provide a measure of the fish's quality. | Future applications of the protocol could include a variety of important fish species, and the suggested approach could be used to develop a fish-specific barcode scanner. |
Guo et al. (2020) | To determine whether Japanese threadfin bream N. japonicus has its nematode parasites | Samples collected by commercial trawlers from South China Sea | min – max, MI with ± SD | A simple and effective method to perform thorough surveys of Hysterothylacium for the seafood industry is RFLP evaluation of the ITS region using enzymes that restrict HhaI and RsaI. | large-scale investigations into the species of Hysterothylacium |
Liu et al. (2021) | Real-time detection of ClO- in a ratiometric manner | – | intramolecular charge transfer | Monitor would properly measure ClO- in RAW264.7 cells by targeting lysosomes. | To provide a helpful tool for detecting ClO- in pathogenic and biological situations in the future. |
Identification Of Fish Disease Using Artificial Intelligence
Zan et al. (2022) developed a LAMP approach (loop mediated isothermal amplifcation) for the quick and accurate identification of S. algae in aquatic animals. The 16 S rRNA gene sequences of the S. algae strains that have been deposited in GenBank were used to construct the specific LAMP primers. The LAMP method for S. algae detection was established and specificity and sensitivity tests were conducted, based on adjusting the primer concentration and optimizing reaction conditions. This approach worked well at a constant temperature of 65 C for one hour. In contrast to Pseudoalteromonas pisicida, Aeromonas hydrophila, A. veronii, Vibrio parahemolyticus, S. decolorationis, S. xiamenensis, Enterobacter cloacae, Bacillus cereus and Staphylococcus epidermidis, the LAMP amplifcation reaction was positive for S. algae. The LAMP approach required a minimum concentration of 8.15 10 5 g/L of S. algal template DNA.
Wang et al. (2020) combined a deep learning object detection, directed cycle graph, fish tracking and dynamic time warping to propose an underwater fish anomalous behaviour detection approach. The technique is effective for anticipating the biologically abnormal behaviour of underwater fish so that quick countermeasures can be prepared for and carried out. Additionally, through post-analysis, it is feasible to determine the origin of illnesses or fatalities, thereby preventing needless loss, facilitating precision breeding selection and also achieving ecological conservation education. Researchers and the aquaculture sector in particular can benefit from a smart aquaculture system that incorporates the suggested technique and IoT sensors since it enables comprehensive data collection when the system is operating in different farming fields and helps to create ideal culturing conditions.
Ranjan et al. (2023) supplemented by the proposed tool (i.e., "MortCam"), which uses Artificial Intelligence (AI) and the Internet of Things (IoT) placed at the edge to enable around-the-clock mortality monitoring and send alarms when mortality thresholds are surpassed. For use in underwater applications, MortCam combines an image sensor with an edge computing system. To gather the images data under both ambient and supplemental lighting circumstances, MortCam was placed in a 150 m3 circular dual-drain RAS tank at 0.6 m above the bottom drain plate. Throughout the 90-day period, pictures were taken every fifteen minutes. A proprietary YOLOv7 mortality detection model was trained using acquired photos that had been labelled as "alive" or "dead" fsh and divided into training datasets (70%), validation datasets (20%) and test datasets (10%). Mean average precision (mAP) and F1 score for the improved mixed model were 93.4% and 0.89, respectively.
Van den Boogaart et al. (2023) the two species that contribute most to aquaculture in Europe are Atlantic salmon and rainbow trout, both of which are raised in cages in Northern Europe. On potential welfare problems, a thorough literature review was done. According to a framework for animal welfare that was customized for fish, these issues were divided into five provisions and welfare goals. A Delphi evaluation was used to rank the issues in order of severity, duration and prevalence. For this assessment, experts had to rate each issue. In order to address the primary challenges, the participants were also asked to suggest interventions. Ineffective illness prevention, problems with sea lice treatment and inadequate husbandry conditions were identified as the three main welfare issues. This study offers helpful insights into which fish welfare issues in European salmonid aquaculture need to be addressed more quickly.
Jin et al. (2020) largemouth bass (Micropterus salmoides), a commercially significant freshwater fish species raised in south-east China, is infected with the Large Mouth Bass Virus (LMBV), which results in the deadly condition known as ulcerative syndrome. A quick and accurate approach for this viral detection was created using probe-modified gold Nano-Particles (AuNPs) as a colorimetric biosensor. In order to increase the resistance of AuNPs to NaCl-induced aggregation, a species-specific probe was affixed to their surface. The assay was optimized to only detect the LMBV DNA sequence after the NaCl concentration and probe to AuNPs ratio in the reaction mixture were assessed. Under ideal circumstances, a linear relationship between the ratio of A670/A520 and LMBV DNA quantities was seen over the range of 2.33 to 23.3 ng/L and unamplified virus DNA as low as 6.99 ng/L could be seen with the unaided eye.
Huntingford et al. (2020) gave a brief explanation of how wild fish, like other ectotherms, promote efficient functioning (such as digestion and reproductive development) by navigating temperature gradients they encounter in their natural environments (demonstrating behavioural thermoregulation). The occurrence of "behavioural fever," which is defined as an abrupt, reversible increase in preferred water temperature in response to pathogen detection, is one example of behavioural thermoregulation in fish that is then examined in more detail. Behaviour fever encourages survival by triggering a powerful immune response to the disease that is causing it. The idea of employing this behavioural fever to encourage disease resistance in fish in Nile tilapia farms is investigated in a current project that is described. When discussing this topic in-depth with seasoned tilapia farmers, it became clear that some of them were already aware of how their fish utilize thermal gradients. We then change our attention to the substantial traditional knowledge of fish ethology held by seasoned fish farmers and fishermen using this discovery as a pivot, and we examine potential implications for fish culture.
Bashorun et al. (2023) Aquaculture feed and fish tissue samples were gathered for examination of mycotoxins and isolated fungi. Three fish species' levels of ochratoxin A (OTA) and aflatoxins (AFs) in the muscles and organs (liver and kidneys) were compared. Additionally, the growth and mycotoxin production of Penicillium species, Aspergillus species, and Fusarium species were examined for resistance to the Volatile Organic Compounds (VOCs) released from a novel Bacillus Cereus BC344-2 strain. With 1.30 102 2.6 102 (mean SD) CFU/g, the aquafeed had a considerable fungal burden, with a significant contribution from the fungus Aspergillus and Penicillium. In 95% and 66.7% of the analyzed aquafeed samples, OTA and AFs, respectively, were found, with 66.7% of the samples also containing both mycotoxins.
Sheng et al. (2013) discussed about the virus that causes lymphocystis illness in marine and freshwater fish worldwide is called the Lymphocystis illness Virus (LCDV). Here, LCDV in fish was discovered using an antibody microarray. As a capture antibody, anti-LCDV monoclonal antibody (MAbs) linked to Cy3 was added to the array of rabbit anti-LCDV serum on agarose gel-modified slides. With the aid of a laser chip scanner and the appropriate software, the signals were photographed and analyzed. Different substrate binders (poly-l-lysine, MPTS, aldehyde, APES and agarose gel modified slides, as well as commercially available amino-modified slides) were tested to increase sensitivity, as well as markers (fluorescein isothiocyanate, Cy3, horseradish peroxidase, biotin, or colloidal gold) conjugated to anti-LCDV Mabs. The storage time of the antibody was also evaluated. The findings demonstrated that when Cy3 and HRP conjugated anti-LCDV MAbs were used as the detection antibody, the antibody microarrays based on agarose gel-modified slides gave a lower detection limit of LCDV of 0.55 g/ml; and when streptavidin-biotin conjugated anti-LCDV MAbs were used as the detection antibody, the lowest detectable LCDV protein concentration was 0.0686 g/ml.
Laltlanmawia et al. (2023) discussed Acinetobacter pittii strain COF_AHE14, which caused mass mortality in rohu (Labeo rohita) during a post-monsoon disease epidemic in the aquaculture farm of Tripura, India, was isolated and identified by our team. The species was confirmed through molecular characterization of the 16S rRNA gene sequence and phylogenetic analysis after the isolate's initial identification based on morphological and biochemical data. The pathogenicity of the isolated bacteria was confirmed by an experimental infectivity research in healthy rohu (Labeo rohita), haemato-biochemical and immune-pathophysiological analysis, histological study, and fulfillment of the Koch's postulate.
Li et al. (2023) proposed a one-stage object detection deep learning algorithm YOLOv4, a visual system that can quickly recognize and count these three types of parasites was developed using Python. In the beginning, we created a dataset of parasites that contained 27,930 photos. Furthermore, network (backbone indeed) freezing was used to obtain a good performance predicting model with less time and higher accuracy. This demonstrated that Transfer Learning could meet the training requirement for detecting these three fish parasites by using self-made data set. A total average accuracy (mAP) of 95.41% was attained by the YOLOv4 algorithm when it was compared to other one-stage algorithms, including YOLOv3, YOLOv4, and others.
Li et al. (2023) discussed about the high plateau of Tibet, China, young Schizothorax macropogon Regan, 1905 (Cyprinidae: Schizothoracinae) fish were found to be infected with I. multifiliis, which led to mass host mortality. A morphological, histological and genetic analysis was carried out to compare with another strain of I. multifiliis from Tachysurus fulvidraco Richardson, 1846 in Guangdong province, China, in order to understand the peculiarities of this isolate in Tibet. Despite their distribution at various elevations, the two isolates did not clearly differ from one another in terms of the infection site, morphology, ultrastructure or histology. The COX-1 gene was the most successful marker to distinguish different isolates of I. multifiliis, according to the analysis of COX-1 gene, SSU rDNA and ITS1-5.8S rDNA-ITS2 sequences cloned from the two isolates in the current study. All I. multifiliis isolates can be classified phylogenetically into three genetically distinct groups and the two isolates found in the current investigation were assigned to various categories. Further research on the potential differentiation of I. multifiliis is interesting given Tibet's high plateau and chilly water temperatures.
Author | Aim | Dataset used | Techniques Used | Advantages | Findings |
Zan et al. (2022) | to develop a LAMP technique for the quick and accurate identification of S. algae in aquatic creatures. | The S. algae strain CSG-15 that was previously isolated from the ill tongue sole C. semilaevis was used in this study. | LAMP method | For the detection of S. algae, affordable, rapid, and simple to use and it can also satisfy the demands for specificity and sensitivity. | – |
Wang et al. (2020) | To foresee the physiologically anomalous conduct of submerged fish in order to plan and implement early interventions | AI training dataset and open dataset | RNN and LSTM | Outcomes have also confirmed, despite Faster-rcnn's great performance, faulty instance segmentation may still happen. | More behavioural models or classes as well as environmental factors like temperature and salinity will be employed in the future. |
Ranjan et al. (2023) | To create a monitoring and alert system for undersea mortality that is AI and IoT enabled for RAS operations. | AL or SL | YOLOv7 | Attained an F1 score of 0.89 and a mAP of 93.4%, respectively. | In future, to further increase strength of alert system by include more mortality data from full fish creation cycle in mortality model. |
Li et al. (2022) | To detect the Ichthyophthirius multifiliis in fishes | In July 2021, Schizothorax macropogon with the characteristic clinical signs of "white spot disease" was discovered in a fish farm in Shannan City, Tibet, China. | PCR amplification | S. macropogon and T. fulvidraco's fins, skin, and gills have several white dots on them. | To better understand their evolutionary process, more genes and variation sites will be required in the future. |
Jin et al. (2020) | To detect Largemouth bass virus (LMBV) in a freshwater fish species using a simple and sensitive method | Sigma Co., Ltd. Sinopharm Chemical Reagent Co., Ltd and trisodium citrate (Na3C6H5O7) | AuNPs | Simplicity, low-cost, speedy. | |
Bashorun et al. (2023) | To detect mycotoxins in fish farms | A total of twenty-one pieces of food for fish were gathered in Qatar from two separate sources. | – | In 95% and 66.7%, respectively, of the examined aquafeed samples, OTA and AFs were found. | – |
Sheng et al. (2013) | To detect LCDV (Lymphocystis disease virus) in fishes | The fish farm where the LCDV-free flounders used in the PCR test was in Qingdao, Shandong Province, China. | immunofluorescence assay technique (IFAT) | With an enzyme-linked immunosorbent assay (ELISA) concordance rate of 100% and an immunofluorescence assay technique (IFAT) concordance rate of 98%, respectively, were found for LCDV spotting results of microarray in fish gills or fins (n = 50). | |
Li et al. (2023) | Based on a one-stage identification of objects DL technique called YOLOv4, it has been possible to identify and enumerate three different types of protozoa using Python. | Carassius auratus weighing 7.36 ± 2.18 g were obtained from an ornamental fish market in Guangzhou, Guangdong, China | YOLO v4 and K-means clustering | one-stage object detection algorithm YOLOv4 was then fine-tuned to train it for greater speed and mAP. | – |
Summary
This essay provided a survey of the literature on several studies that have looked at how to identify fish diseases using AI and image processing methods. The studies discussed in the paper address a variety of issues, such as the use of machine learning algorithms and image processing techniques to identify specific diseases in various fish species and the evaluation of welfare concerns in European salmonid aquaculture. In order to evade financial losses and detrimental effects on national economy, the study emphasized the significance of early fish infection diagnosis and the requirement for preventative actions.
Chapter 3 Objectives of the Research
Introduction
Identifying fish illness at an early stage is challenging, but early detection can help prevent its spread underwater. Fish disease detection has traditionally been a manual procedure. This unique technique for identifying fish with and without Epizootic Ulcerative Syndrome (EUS) is proposed here as a way to support aquaculture. Image processing algorithms are displayed to discover the EUS ailments autonomously rather than through traditional recognition.
Contribution 1 offers the purpose of the classification of Fish conditions utilizing UKF and Elman Neural Networks. It recommends cutting-edge fish illness detection methods that combine the Unscented Kalman Filter (UKF) with other correlated evaluations. Under the help of the Elman Neural Network (ENN), GLCM is developed for the classification of fish that are unaffected by the EUS and fish that are. A simulation programmed in MATLAB was used to do the test.
Contribution 2 shows the objective of an improved ML approach with “A Hybrid Metaheuristic Algorithm” to recognize Fish illness. Also recommended an ML method-based ANN for fish disease recognition, categorization. It presents a hybrid system called the “BWO Algorithm with MOA for resolving worldwide optimization challenges”.
Contribution 3 presents the objective of HRFSVM-Identification of Aquarium Fish conditions Utilizing an HRF and SVM. Also, suggests a Deep Convolutional Neural Networks technique for recognizing and classifying fish diseases. To address issues including “global optimization WOA-GA and Ant Colony Optimization are presented. For classification, the hybrid Random Forest algorithm is employed. Proposed detection approach is done with MATLAB”.
Contribution 1: Diagnosis of Fish Disease Using UKF and Elman Neural Networks.
Fishing and aquaculture serve a vital part in offering the global population an essential protein source and are the main contributors to global food security. As world's populace increments and advantages of fish as an animal protein resource has been extensively acknowledged, demand for fish is continuing to rise. Since aquaculture is a more sustainable method of maintaining the constant demand for fish, there is an increase in interest in this industry. So, it is essential to maintain the aquaculture industry's economic and ecological sustainability. As the aquaculture fish industry expands, several challenges arise from current practices, such as the persistent occurrence of transferrable diseases in farms or brooders, ecological issues, limit fish production. Since fish diseases are the biggest hazards to many fish farms, efficient tools for accurate detection are also necessary in addition to experience and knowledge of fish health.
Enteric Septicemia of Catfish (ESC), also referred to as EUS (Enteric Septicemia of Catfish), is a serious bacterial disease that affects catfish, especially those raised in aquaculture environments. In nations like Australia, Eastern USA and Africa, Japan, freshwater and backwater fish are susceptible to the deadly ulcerative disease known as EUS. Only two of the over 100 different fish species that have been identified by EUS have had their findings confirmed by demonstrating the most significant investigative modifications in the attribute examination. The survival of mullets and snakeheads in both brackish and freshwater is significantly impacted.
This disease is mainly made by a bacteria called Edwardsiella ictaluri and poses a significant threat to catfish farming. It propagates effortlessly through contaminated water, infected fish and equipment, with stressors like overcrowding and poor water quality exacerbating its effects. Infected catfish show a range of clinical symptoms, including lethargy, loss of appetite, haemorrhages and abdominal distension. The effects of EUS on fish might result in high death rates and diminished growth, have a significant negative financial influence on aquaculture operations. Laboratory testing and molecular methods are used for diagnosis and immunization, antimicrobial treatments, and maintaining ideal water quality are used as control measures. To maintain health also continuity of catfish populations in aquaculture systems, ongoing search attempts to create more effective prevention and management measures.
Identifying fish disease at an early stage is challenging, but early detection can help prevent its spread underwater. Fish disease identification has traditionally been performed manually. Precise discoveries of EUS are required to avoid disorientation with another festering circumstances. It is important to remember that an ulcer is a non-open clinical damage that can be brought on through a variety of circumstances. Therefore, this unique approach used to categorise and separate EUS diseased and non-fishes is proposed here with the aim of advancing farming. Since they do not occur in an epizootic setting or even in the natural setting, not all blisters are EUS ulcers.
The necessity for an image-based computerized procedure emerges since manual process of recognition is extreme. Instead of manually identifying the EUS disease, image processing algorithms are expected to do it as well. Numerous individuals eat fish as their primary source of sustenance. With the aid of several fish images, various edge recognition performances have been employed to restore the excellence of fish. The earlier database from the information fusion study of integrated GPS/INS navigation is what this work is dependent on. The study suggests a distinctive approach for identifying fish diseases using the Unscented Kalman Filter (UKF) with varied covariance to handle with doubt of fault correlation, disturbance in fish ailment diagnosis.
A total of roughly 233 samples related to the photos of fish with and without EUS infection are gathered. The remaining 60 samples are utilized for testing, while over 173 samples are used for training. Noise may or may not distort these images. UKF is used to remove noise if it has corrupted the samples. With the aid of Elman Neural Network (ENN)-based machine learning algorithms, characteristics such as GLCM are extracted for the classification of fish that are not impacted by the EUS and fish that are.
The Unscented Kalman Filter (UKF) plays a crucial part in the area of diagnosing fish diseases using sophisticated methods. In this situation, UKF acts as a powerful data fusion as well as a filtering tool, which is especially helpful when navigating the complexities of non-linear systems present in fish health monitoring. Unlike conventional linear techniques, UKF succeeds because it uses a collection of unscented points that, even in the presence of non-linearity, accurately describe the probabilistic distribution of state variables. UKF produces a precise estimation of the current state by expertly propagating these unscented points via the non-linear functions of the system, which, in terms of fish disease detection, incorporates important factors relevant to the fish's health status.
When this method operates in perfect balance with Elman Neural Networks, providing them with precise condition estimates, the effectiveness is witnessed. The UKF-refined inputs are used by these Elman Networks, known for their capacity to identify temporal trends in data, to categorize fish health. To provide more accurate and trustworthy fish disease diagnoses in the complex environment of aquaculture settings, UKF and Elman Neural Networks work together to provide an improved diagnostic technique.
The evaluation has been carried out through MATLAB pretence software along a real-time dataset including images of EUS-infected fish. The proposed study indicates that after using this sophisticated approach to learning, the suggested combination provides an optimal classification effectiveness of 98% for distinguishing fish with and without the EUS. Extended Kalman Filter provided a way to remove interference for a better improvement in categorization effectiveness. The problem was solved using real-time photographs of fish suffering and unaffected by the EUS sickness. It mechanically recognizes fish impacted through EUS disease.
Contribution 2: An Enhanced Machine Learning Technique with A Hybrid Metaheuristic Algorithm to Identify the Fish Disease.
Worldwide, the fishing sector and quantities of wild fish are both very concerned about fish disease. Aquaculture fish ailments are a dangerous hazard to the availability of nutrients and the profitability of the fishing business. A vast variety of illnesses brought on by fungi, viruses, parasites, bacteria, and other pathogens can affect fish. However, the lack of the required infrastructure makes it difficult to identify infectious fish. It is important to identify contagious fish immediately possible to stop distribute of infections. These illnesses can harm wild fish populations and the aquatic environment, as well as generate major financial losses for the aquaculture business. Early disease detection is essential for effective disease treatment and control. It can limit the influence on the fish populace and stop the spread of disease. It's crucial for guaranteeing the security and calibre of fish products intended for human consumption.
In recent decades, there has been a growing desire to develop new knowledge and tactics for detecting fish illnesses. For instance, biosensors that can find certain infections in fish or water are being established. These biosensors can efficiently and accurately identify fish infections, reducing economic losses and preventing disease outbreaks. The management of fish well-being and ailment control includes the discovery of fish illnesses as a key component. Fish population impacts can be reduced and transmission of diseases can be stopped through early disease identification. Fish infections can be found using a variety of techniques, from pictorial examination to advanced molecular studies. The most popular and simple way to identify fish illnesses is visual inspection.
This includes perceiving fish for any nonstandard signs like discolouration, variations in behaviour, or physical irregularities. A Graphic examination is not constantly accurate, though, as some sicknesses may not have apparent symptoms or symptoms alike to those of other ailments. Fish disease detection using the PCR is extremely delicate and precise. In PCR, a specific DNA segment from a sample is amplified to detect the presence of particular diseases. Another method for identifying fish diseases is immunohistochemistry, which uses antibodies to identify particular antigens in tissue samples. To ensure the viability of the aquaculture sector and the well-being of wild fish inhabitants, novel and innovative methods for fish illness detection must be developed.
In respect of nutrient fixture, fish diseases in aquaculture harvest a higher danger. Moreover, due to their propensity to spread swiftly through the aquatic, fish infections are considered a severe issue by fishermen. Fish producers with experience have been making manual, cost-effective diagnoses of fish diseases using only their own eyes for decades. These seasoned farmers base their conclusions on their observations of obvious indicators such as modifications in fish behaviour, skin colour, fin condition, or the presence of external parasites. For small-scale fish producers with limited resources, this system enables quick assessments and prompt response in cases of suspected disease outbreaks. However, manual diagnosis has its limitations because many fish ailments are brought on by invisible microorganisms. Additionally, it may be subjective, producing inconsistent results and unable to identify diseases in their early stages. Many aquaculture companies are currently implementing more advanced molecular techniques and technologies to improve disease detection and management. These strategies and technologies offer more precise and thorough insights into fish health, enabling more enhanced disease management and prevention.
In this paper, to determine the illness of fish, happened at aquaculture. They quickly identify infected fish brought on by bacteria by using ML and clean image processing systems. There are two sections to this work: fundamental “image pre-processing and segmentation have been utilized in first part to improve the image, reduce noise”. Second part is where the feature selection and classification took place.
This present research suggests a machine-learning technique for classifying and sorting fish diseases based on Artificial Neural Networks (ANN). A computational model known as an ANN was developed to simulate how the human brain analyzes and processes information. It connects multiple processing devices, each of which is comparable to a single node, and is based on artificial intelligence (AI). Neurons are the interconnected processing units that make up an ANN. Each node generates a single output from a variety of incoming signals based on internal weight. Another neuron receives its input from the produced output. “Input layer, numerous hidden layers, and output layer are some of different layers that collectively make an ANN's architecture”.
During the learning process, “ANN adjusts its arrangement based on internal or external data, travels over system. ANN can give high-speed data while also reducing inaccuracy and the chance of recall”. As a result, it is used to resolve challenging issues like prediction and categorization. In several fields, including prediction, character acknowledgement, and data prediction, ANNs have been used. Artificial Neural Network learning can be either supervised or unsupervised. The most common way of training a neural network is supervised learning, which involves giving the neural network a set of sample data along with the results that are to be expected from each sample. Unsupervised training is identical to supervised training; the main distinction is that it does not give the neural network the desired outcome. The neural network classifies the input into several classes, which results in this unsupervised training.
This research presented the BWO approach with the MOA, a novel hybrid approach for resolving global optimization issues. In the ongoing effort to improve fish disease detection techniques, this research takes an innovative approach by combining two different yet powerful nature-inspired optimization algorithms: BWO Algorithm, MOA Algorithm. The BWO, which derives its inspiration from the black widow spider's hunting method, emphasizes accuracy and adaptability when looking for the best solutions. The MA, on the other hand, emphasizes quick convergence and flexibility in changing settings and was inspired by the brief yet adaptable lives of mayflies. The BWO-MA hybrid metaheuristic, which combines these two bio-inspired algorithms, promises to be an effective tool for improving machine-learning methods in the context of fish disease identification. This combination makes use of the BWO's accuracy and adaptability as well as the MA's speed and agility.
This hybrid technique aims to substantially improve the reliability as well as productivity of disease detection procedures by optimising model parameters and feature selection. The BWO-MA hybrid metaheuristic has wider implications for optimization and machine learning synergy than just its immediate uses in aquaculture. It serves as an example of a creative strategy for addressing challenging, dynamic issues across a variety of sectors. The prospective results of this research could improve disease management techniques in the context of aquaculture, thereby enhancing the sustainability of fish populations and the aquaculture sector. In essence, the combination of the BWO- MA highlights the revolutionary potential of hybrid metaheuristics in machine learning and marks a promising step towards enhanced disease detection approaches. This study may lead to improvements in illness detection methods as well as optimization strategies, providing a fresh approach to tackling urgent problems in aquatic health monitoring.
In the presented study, a well-known ML-based BWO-MA with ANN was presented to identify pathogenic fishes. Enormous matrices and classed output with pictorial interactivity from the categorization results were displayed together with several models. Furthermore, it strengthened filters and changed the supplied images into one that was more favourable to the filter by using machine learning techniques like "histogram equalisation and canny algorithm segmentation. To improve the degree of forecasting and classification of the fish images in this investigation, pre-processing, segmentation, hybrid feature selection, and ANN classifier methods are utilized”. Simulation results showed that suggested ML method on fish image data is much superior to those of the convolutional ML prediction models. Comparing the suggested method to the current high-accuracy machine learning-based classifiers, the proposed model has a high computational productivity for fish illness forecasts.
It shows, BWO-MA-based ANN framework produces improved execution while contrasting the suggested approach with currently used machine learning techniques. Extensive research demonstrates that the proposed technique delivers cutting-edge performance. BWO-MA and ANN were used in combination to reach a high precision rate of 96.439% in identifying, categorizing fish diseases.
3.4 Contribution 3: HRFSVM: Identification of Fish Disease Using Hybrid Random Forest and Support Vector Machine.
In a food chain, fish are regarded as one of the most significant connections and serve a vital role in human life too. Modern aquaculture requires increasingly more attention to fish welfare. With a large variety of species in the sea, the aquatic environment plays a vital part in preserving balance of nature. Management of aquaculture and marine biology sustainably depends on research on fish species. Relative plenty of fish species in their ecosystems presents a substantial challenge for aquatic researchers, and environmentalists frequently monitor population trends. These days, fishing is a significant source of revenue all around the world. Fish constitutes about 15% of total animal protein consumed by world's population.
Fish play an important part in both nutrition security, national safety in nation and throughout world. Therefore, increasing fish production is essential. It has decreased as a consequence of serious illnesses, which might harm the economy of the nation. It can take the necessary safeguards to stop the disease from propagating by early diagnosis of infected fish.
By contributing significantly to food security, the global economy, and the provision of a significant amount of protein, aqua farming and fisheries play a significant role in the global. Fish demand is growing globally as it has become a source of animal protein. Fish intake has recently become trendy in both industrialized and developing nations. It is difficult to recognize infectious diseases in fish in aquaculture at previous point right to a deficiency of adequate foundation. It is essential to quickly recognize infected fish if desired to stop the sickness from spreading. Numerous pathogenic organisms, including bacteria, viruses, protozoa, and metazoan parasites," can cause fish diseases.
Fish infections spread significantly as a result of both polluted water, erratic water temperatures from one season to another. Noise, varying illumination, and the environment make it difficult to classify fish species in the real world. Early detection and treatment of fish infections as well as predicting basic reasons are crucial for fetching right operation to prevent financial losses for farmers that have obvious negative effects on the nation's economy.
Due to epizootic ulcerative syndrome (EUS), unexpected deaths of freshwater fish have been occurring since 1988. EUS, a frequent disease in fish, affects both freshwater and brackish water fish. Aphanomyces in vadans, a fungal pathogen with a high death rate and clinically diagnosed as causing deep ulcers, is the culprit. To assess the characteristics of EUS for an exact and rapid diagnosis, the region that is relevant to the affected fish might be taken into consideration. Fish disease is detected using “Augmented reality (AR) and an image processing technique on a smartphone for spread prevention, fatality rate reduction, and early disease diagnosis. The AR technique is capable of resolving the key problem of recognizing infected fish”.
The detection of fish and subsequent estimation of their assemblage has been accomplished using a variety of approaches through the use of video and image processing algorithms. Constrained and unconstrained sampling methodologies are classified based on the available medium sampling. Based on feature selection and combination concept amongst the main obtained components, a model that could recognize fish items in an image employing appearance, anchors, and statistical information may be created. Image processing can be a helpful technique for assessing and locating fish disease. Numerous studies have been conducted in this area in the fields of agriculture and fishing. The application of deep DL to adaptive fish farming is examined. It was found, DL can mechanically remove attributes while maintaining accuracy of the output.
This research's primary objective is to provide an ML-based technique for identifying and classifying fish illnesses. Essentially, using their capacity to automatically learn features from images, Deep Convolutional Neural Networks (DCNNs) are used as the primary method for image-based diagnosis, categorization of fish diseases. To improve and optimize the performance of the ML model, this work introduces the WOA-GA, a revolutionary hybrid optimization approach as well. The Whale Optimization Algorithm and Genetic Algorithm were combined to generate the WOA-GA hybrid, which is a powerful optimization strategy. This combination produces an adaptable and reliable optimization technique by fusing the exploration and exploitation abilities of WOA with the evolutionary principles of GA. In WOA-GA, the WOA component contributes its exceptional capacity to investigate a variety of solution spaces, deriving inspiration from the humpback whales hunting habits. Maintaining diversity among options and preventing early convergence require this investigation phase. The selection, crossover and mutation operators that GA offers, on the other hand, allow the algorithm to iteratively enhance and improve solutions, and converge over time to maximum or nearly optimal solutions.
WOA-GA is particularly appropriate for a variety of optimization problems, including engineering design and parameter modifying in machine learning as well as difficult logistical and scheduling issues, due to the synergy between these two techniques. The ability to effectively combine several optimization paradigms to enable fish disease detection is demonstrated by the hybridization of WOA and GA.
Ant Colony Optimization is also indicated to be employed for particular objectives. An optimization technique that derives its inspiration from nature and the eating patterns of ants is called Ant Colony Optimization (ACO). ACO, which was first developed in the early 1990s, is especially efficient in resolving challenging combinatorial optimization issues. ACO functions by modeling how ants find and travel via pathways while looking for food. Ants create pheromone trails during this operation to transmit the calibre of found passageways. By creating and refining solutions iteratively, the algorithm simulates this behaviour. ACO is an effective optimization tool that aids in the exploration of challenging problem spaces and improves the effectiveness of the disease detection operation.
This method makes use of the algorithm's capacity to locate the best routes or solutions within enormous and complex datasets, much like the difficult process of identifying diseases in fish populations. ACO assists researchers in navigating the complex terrain of fish disease diagnosis, just like ants do while navigating complex terrain, ultimately leading to more accurate and effective diagnostic results in the field.
A hybrid Random Forest algorithm is used for the classification challenge, utilizing methods for ensemble learning to boost overall model accuracy and generalization. The Hybrid Random Forest algorithm combines the SVM's discriminative ability with the ensemble learning capabilities of Random Forest. By building numerous decision trees and pooling their outcomes, Random Forest excels at identifying intricate patterns in huge datasets. By using an ensemble technique, over-fitting is decreased and generalization is improved. SVM, however, is recognized for its capacity to identify the best hyper-plane boundaries across classes, making it successful in discriminating between healthy and unhealthy fish. The Hybrid Random Forest algorithm combines these two approaches to benefit from their complementing advantages. In particular, image-based fish disease identification applications gain from Random Forest's ensemble-based flexibility and ability to handle many features. SVM, on the other hand, strengthens the model's accuracy and discriminative capabilities, ensuring that the algorithm can distinguish between healthy and unhealthy fish with accuracy.
In demonstrating the efficiency of the suggested technique, the studies make comparisons with existing machine-learning methods relevant to the field of fish disease identification. They put their research into practice using MATLAB, a programming environment well suited for machine learning and scientific computing tasks like model construction, training and evaluation. A wide range of efficacy indicators, such as “sensitivity, specificity, accuracy, recall, precision, recall, F-measure, Negative Predictive Value, False Positive Rate, False Negative Rate and Matthews Correlation Coefficient are used to assess execution of recommended approach”. These metrics provide a quantitative evaluation of model's capacity to recognize fish diseases with accuracy, as well as how well it can minimize false positives and false negatives. Overall, this research integrates deep learning, optimization techniques and ensemble learning to provide a reliable system for fish disease identification and applies a comprehensive assessment of performance to prove its efficacy.
Summary
The diagnosis of fish infections was notoriously challenging, but early discovery may prevent the illness from spreading underwater. Fish illness diagnosis had previously been performed manually. A new categorization and identification approach for fish with and without EUS infection was proposed here to promote aquaculture. Due to how time-consuming manual identification is, an automatic image-based procedure was created. The usage of an automated image-based procedure is necessary due to the laboriousness of the manual identification process.
Contribution 1 was built using previously collected data from a GPS/INS navigation system. The research suggested a unique method for identifying fish diseases where the UKF has varying covariance to solve the uncertainty of error covariance. By utilizing ML-related algorithms to extract traits like GLCM, the classification accuracy of fish that were not impacted by the EUS and fish that were was enhanced with the aid of ENN. This testing made use of MATLAB simulation tools.
Contribution 2 suggests an ML method based on ANN for recognizing and categorizing fish illnesses. A new hybrid algorithm known as BWO-MA was presented to overcome problems with global optimization. Then, by contrasting it with currently in-use ML approaches, it was shown that the BWO-MA-based ANN design performed better. To identify and classify fish infections, ANN and the BWO-MA were used in conjunction, and a high accuracy rate of 96.439% was achieved.
Contribution 3 presents a DCNN-based ML approach for organizing and identifying fish diseases. The WOA-GA and Ant Colony Optimisation hybrid algorithm was suggested in this research to address global optimisation challenges. For classification, the hybrid Random Forest method was employed. MATLAB was used to evaluate the recommended detection method's efficacy. Recall, precision, recall, accuracy and recall performance indicators were compared to the performance of the suggested technique.
Chapter 4 Experimental Work
Introduction
Fish diseases can be difficult to diagnose, but early detection can help prevent their spread underwater. Fish disease diagnosis has traditionally been performed manually. As a result, this new system to classify and distinguish fish with and without EUS infection is proposed here with the goal of advancing aquaculture. The laborious nature of manual identification calls for the development of an automated image-based process. Contribution 1 relies on a prior data set that was gathered from an information fusion study of integrated GPS/INS navigation. In order to address the uncertainty of error covariance and noise in fish disease treatment, the paper presents an unusual method to fish identifying illnesses whereby UKF has varied combination. Algorithms related to ML are used to extract characteristics like GLCM for the categorization of “non-EUS and EUS pretentious fish in order to increase categorization accuracy with aid of ENN”. This testing was carried out using “MATLAB simulation software and a live database that contained pictures of fish that were affected by the EUS”. Contribution 2 suggests an ML method based on ANN for recognizing and classifying fish diseases.
We present a “brand-new hybrid algorithm called BWO-MA for resolving issues with global optimization”. The proposed approach aims to develop a "BWO-MA with an ANN-based diagnostic model for early detection of fish diseases. We matched suggested approach to currently used ML models and show, BWO-MA-based ANN framework performs better. The thorough analysis demonstrates, proposed method accomplishes cutting-edge performance. “A high accuracy rate of 96.439% was attained when ANN and the BWO-MA were used together to identify and classify fish diseases. Contribution 3 offers a ML method for classifying and identifying fish diseases that is based on the DCNN method”. This article proposes “a novel hybrid algorithm, the WOA-GA and Ant Colony Optimization, to solve global optimization problems”. In the contribution 3, “hybrid Random Forest algorithm is employed for classification”. Differences among “proposed WOA-GA-based DCNN framework and currently employed ML techniques have been made in order to facilitate the improved quality”. MATLAB is utilized to assess effectiveness of suggested detecting process. Performance indicators such as sensitivity, specificity, accuracy, recall, precision, and recall are compared to the performance of the suggested technique are used.
Contribution 1: Diagnosis of Fish Disease using UKF and Elman Neural Networks
The removal of noise from images is a problem that many state estimation filters are intended to handle. When dealing with linear systems that have a dynamic nature, the standard KF is frequently used and is an effective tool. Understanding the system processes that will be observed by the Kalman filter is necessary. A metric for approximation assurance is provided by calculated "Kalman-gain and forecasting state-covariance, as the model is very robust to measurement noise and does not necessitate adequate main variables. Use of improved versions of KF is necessary to meet the growing demand for complex nonlinear systems.
UKF
The stability and complexity of the EKF, which are assessed through the computation of the Jacobian matrix, significantly limit its performance. The accuracy of the estimated “mean and covariance of the subsequent Gaussian random variable, which could go up to third order, is increased by using UKF by unscented transformation” and the flowchart is shown in Fig.4.1.
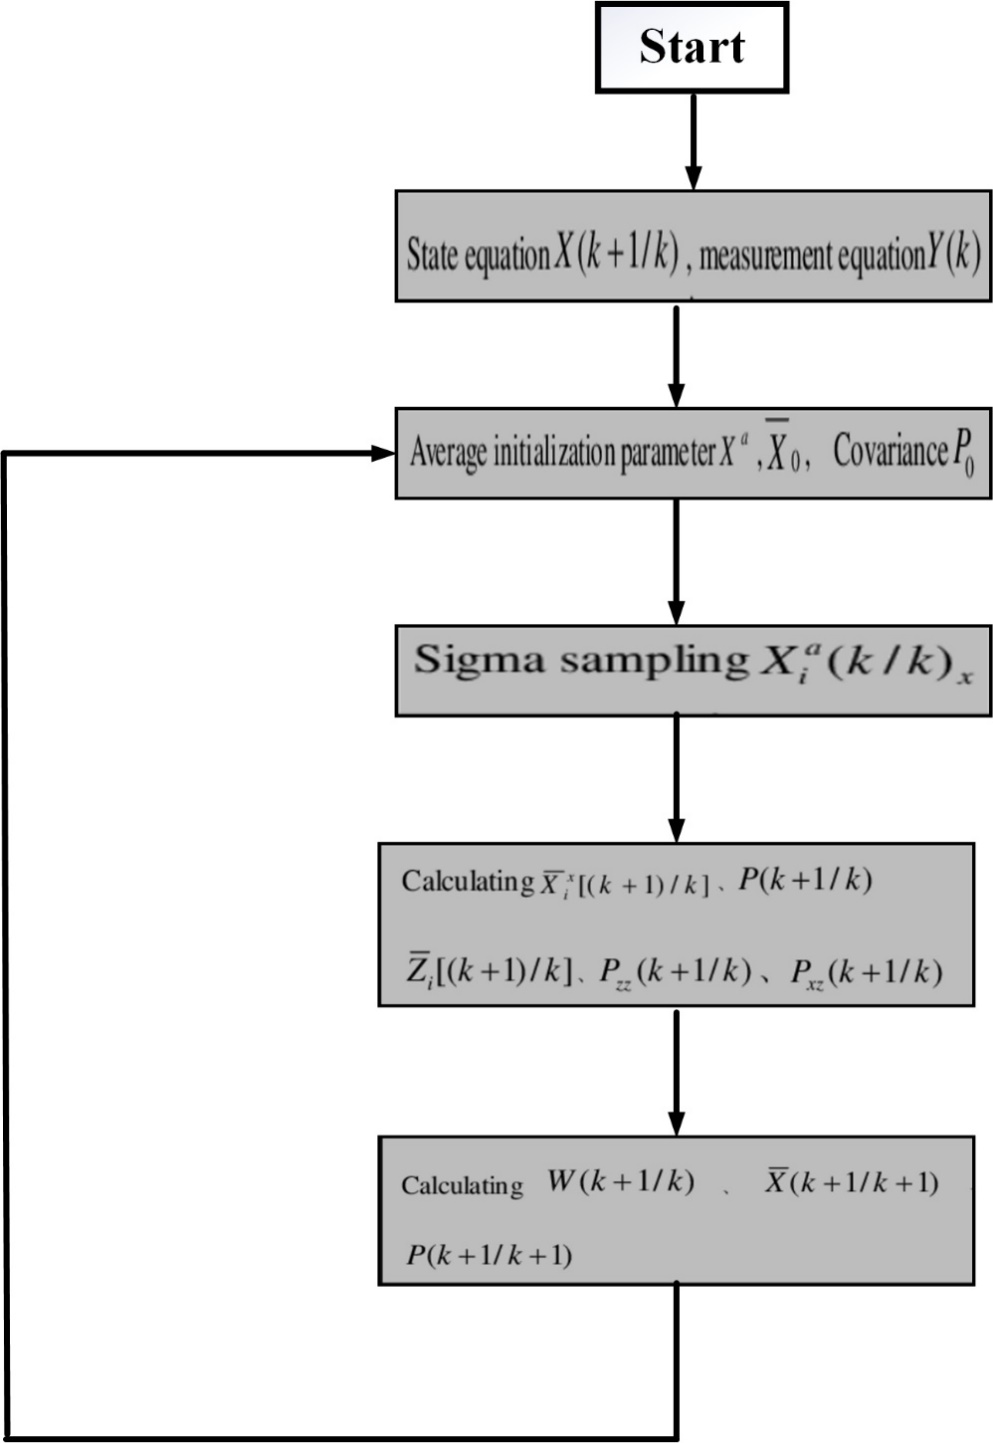
Figure 4.1. Flow chart of UKF
GLCM
In order to quantify the spatial relationships of pixel intensity values within an image, image processing professionals use the texture analysis technique known as GLCM. For obtaining details about the texture and patterns present in an image, it is especially helpful. Within an image, the GLCM calculates how frequently pairs of pixel values appear at particular distances and angles. Several statistical measures, including contrast, correlation, energy and homogeneity, can be obtained by examining these co-occurring pixel pairs. By helping to distinguish between various materials or structures, these measurements offer insights into an image's texture characteristics. The understanding of texture variations is crucial for accurate analysis and decision-making in areas like remote sensing, medical imaging, and quality control, where GLCM is widely used.
Noted intensity values at specific areas in relation to reference image are computed statistical distribution in statistical quality analysis. The statistics are broken down into first, second, and other statistics based on the number of pixels. GLCM is one of the features of second order for extracting quality data. For the computation of third order statistics and higher, the relationship between three or more pixels is required. Equation (4.1) to Equation (4.4) shows the characteristics derived from standardized symmetrical GLCM. Fig.4.2 shows the flowchart.
Correlation: It demonstrates how grey levels are linear subordinate on close pixels. This shows statistical relationship amid two variables
\({F}_{3}=\frac{\sum_{a}^{}{\sum_{b}^{}{\left(ab\right)q\left(a,b\right)-{μ}_{c}{μ}_{d}}}}{{σ}_{c}{σ}_{d}}\) …Eqn. (4.1)
Homogeneity: It offers a degree value that compares the origins of two images that are closest to one another based on their respective GCLM models. Homogeneity is represented in Equation (4.2)
\(Homogeneity=\sum_{x,y}^{ }{\frac{p\left(x,y\right)}{1+\left|x-y\right|}}\) …Eqn. (4.2)
Contrast: Contrast is the degree of visual contrast between elements; it frequently involves changes in colour, brightness, or texture, and it can improve the impact and clarity of the visuals
\(Constrast=\sum_{i,j=0}^{N-1}{{P}_{i,j}{\left(i-j\right)}^{2}}\) …Eqn. (4.3)
Energy: An element's perceived brightness or intensity is referred to as energy in a visual context
\(Energy=\sum_{i,j=0}^{N-1}{{{P}_{i,j}^{2}}^{ }}\) …Eqn. (4.4)
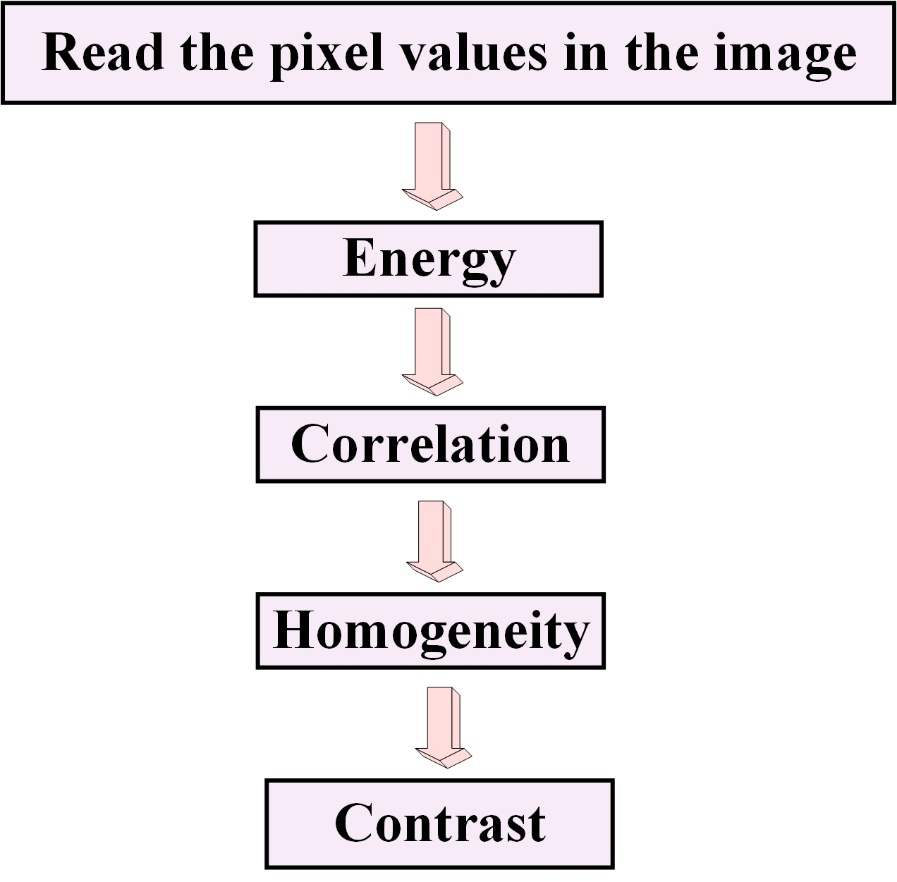
Figure 4.2. GLCM computation flowchart
ENN by BPA
Such network architecture lacks a feedback link because information only flows in one direction from “input to output neurons”. Used networks along repeated links to link serially ordered output patterns with static patterns. The hidden layer nodes, which are hidden nodes that are visualized, use their own prior output as a channel for future behaviors. Recurrent connections offer network memory. The architecture of a supervised FFNN, whose learning and prediction processes use two techniques, is depicted in Fig.4.3. Both the inputs and the desired results are necessary for the learning process. After computing the MSE in its forward phase, the weight updating occurs in the reverse propagation phase. Always strive to have the designed output match the desired output as closely as possible. “The intended process receives input and, using hidden state, produces most likely result in accordance with its prior "training experience". Due to this, ML is also referred to as model fitting”.
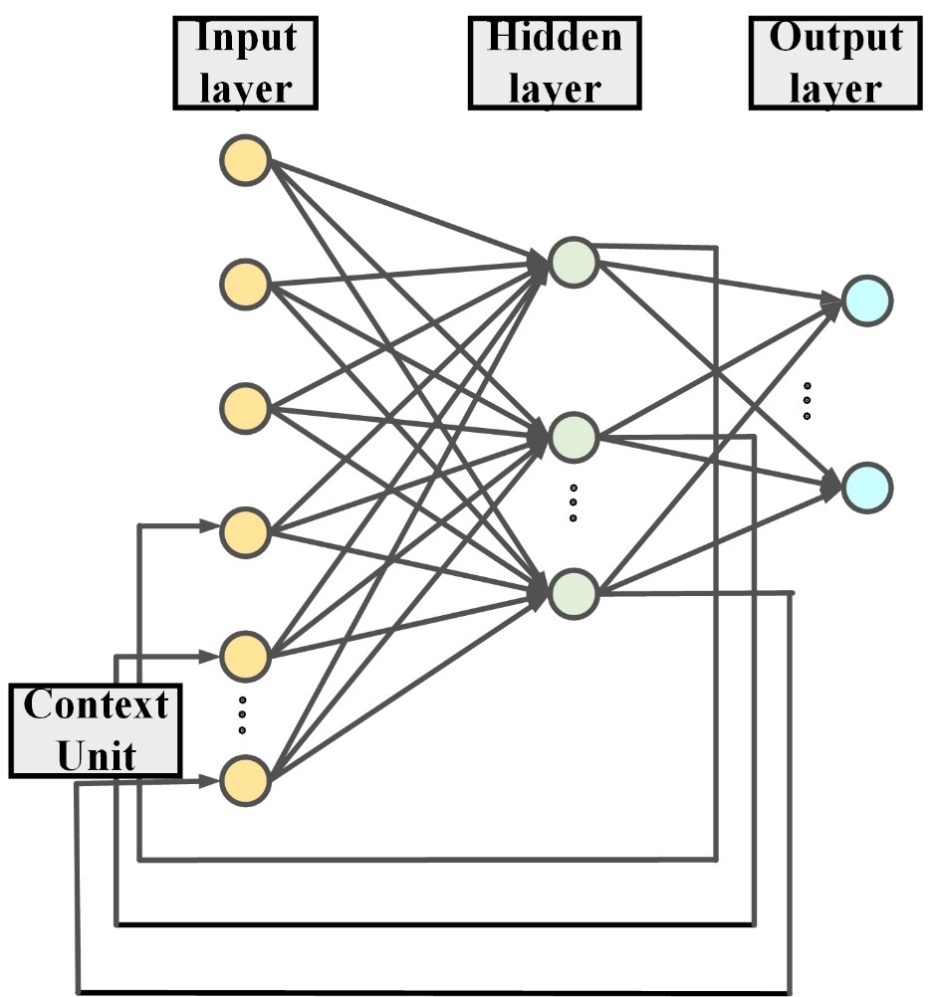
Figure 4.3. Framework on ENN
The ship's bottom is equipped with a water-resistant video camera that records fish footage as it travels through the ocean. There are separate frames in this video. Following GLCM feature extraction, UKF is used to remove noise. The characteristics are evaluated and tested for ENN with BPA to categorize EUS non-infected also infected fishes, as shown in Fig.4.4. Freshwater and brackish water fish species are the main victims of the deadly aquatic disease EUS. Fish infected with EUS develop extensive skin lesions, ulcers and tissue damage. EUS is carried on through fungus Aphanomyces invadans. In warm water, the disease frequently spreads quickly, especially under stressful circumstances. Fish populations can be impacted and there may be significant economic and ecological effects as a result of EUS. To stop the fungus from spreading, control measures include reducing stressors, enhancing water quality and putting biosecurity procedures in place. Aquaculture, wild fish populations and ecosystem health are all still at risk from EUS, making monitoring and management plans crucial to reducing its effects.
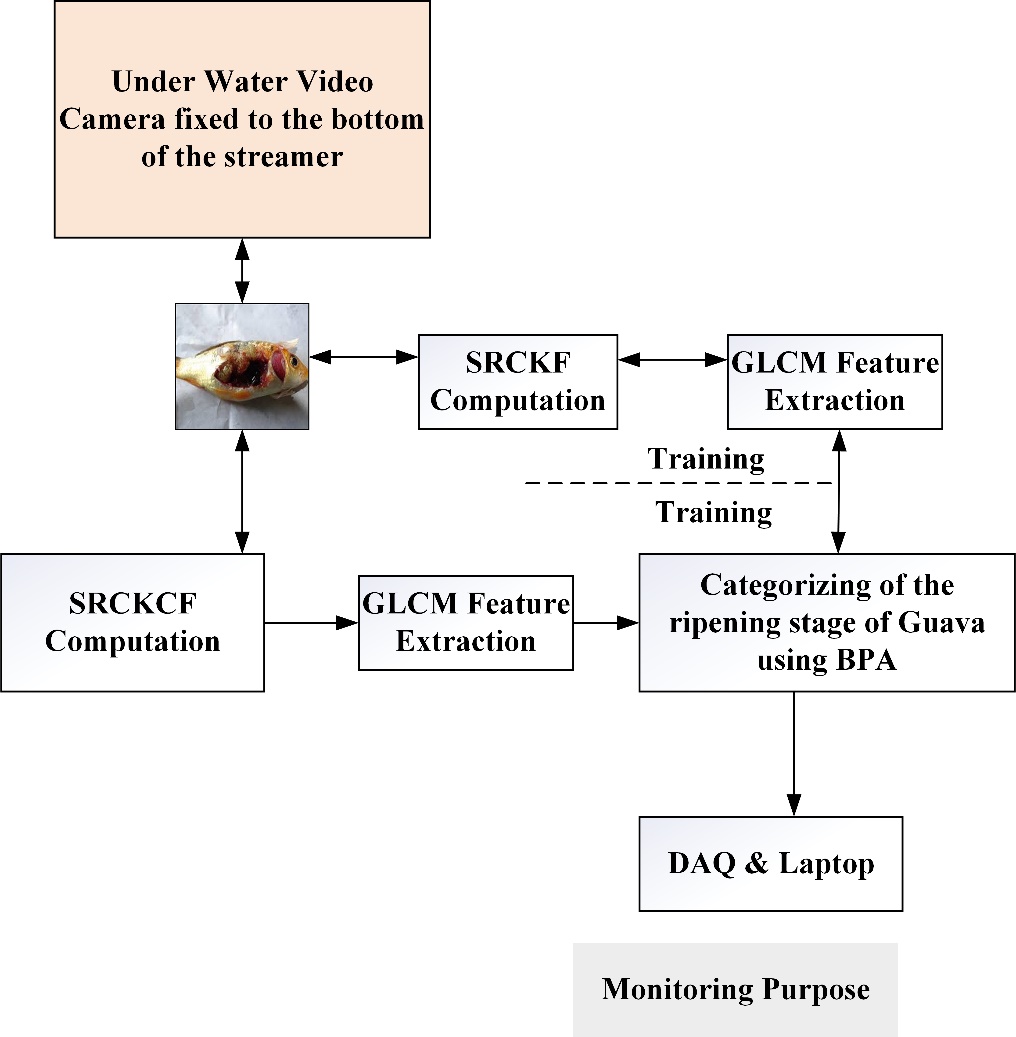
Figure 4.4. EUS detection in fishes submerged in water
Contribution 2 Using ANN with Hybrid BWO-MA Optimization
Fish diseases present a greater risk in aquaculture relating to nutrient security. Fish diseases, however, are regarded as a serious issue by fishermen due to their propensity to distribute rapidly via water. Experienced fish farmers have manually diagnosed fish diseases with their unaided eyes for decades. Then identified the fish disease that occurred in the aquaculture. Then quickly identify the infectious fish brought on by germs by combining ML and clean image processing techniques. There are two sections to this work: “The first section is the most basic and it implements image pre-processing and segmentation to improve image also reduce noise. Second part is where feature selection also classification took place. Second part contains the feature selection and classification. Fig.4.5 displays the suggested approach. Pre-processing, segmentation, feature selection and classification” are four distinct phases of fish disease categorization also recognition method. Preprocessing is the first step, during which fish images are put together also used with preprocessing stage, where filtering approach (median filtering) became carried out. Filtering procedure typically aids in removing undesirable noise from input image, after which histogram equalization process is utilized to improve difference of image. After preprocessing is finished, the fish image segmentation is carried out using the improvised canny algorithm. After the image has been properly segmented, the feature selection process uses the segmentation output. A hybrid algorithm known as a BWO-MA for resolving global optimization issues is a novel contribution to feature selection process. The primary explanation is that the mayflies changed in order to improve the algorithm's capacity for exploration. outcome from feature selection procedure is then forwarded to categorization method. A diagnostic model based on the combination of (BWO-MA) and ANN that enables previously diagnosis of fish diseases. Suggested approach involves spontaneously extracting a set of features for categorizing also determining fish diseases. The proposed approach is very effective at raising classification accuracy.
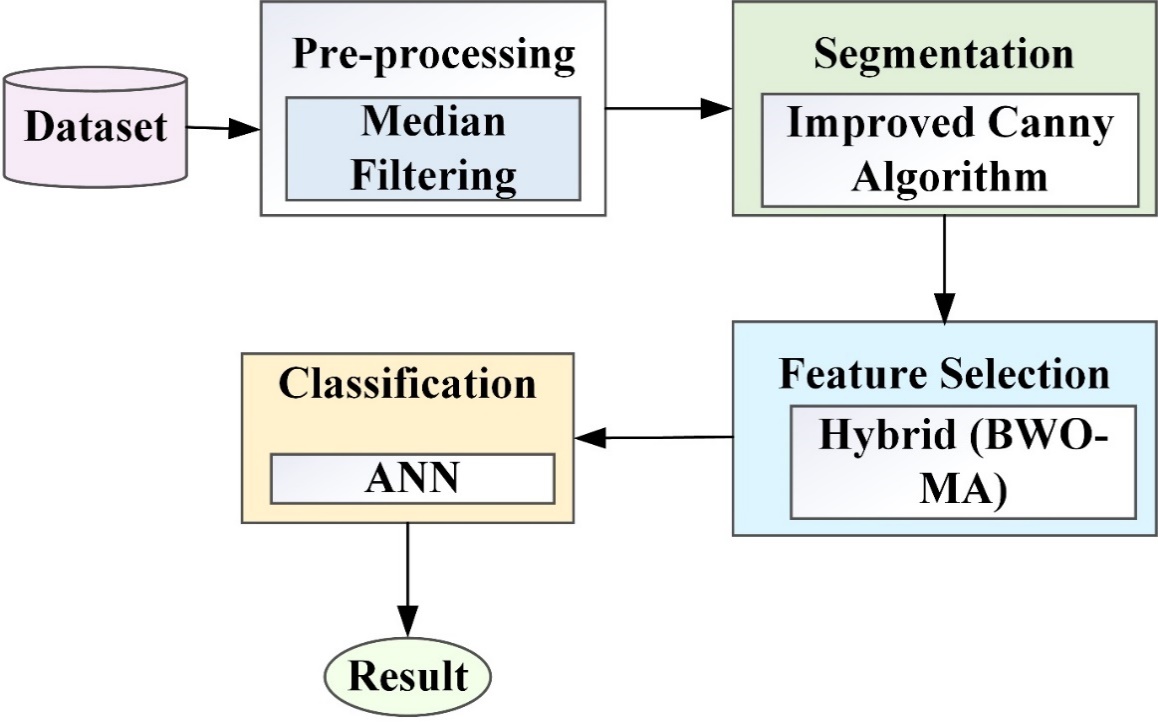
Figure 4.5. Overall flow of the contribution 2
ANN
It is a computerized model created to mimic how human brain evaluates also processes details. It links different handling components, every of which is comparable to a single node, and is based on AI. Neurons are the interconnected processing units that make up an ANN. Each node generates a single output from a variety of input signals based on internal weight. The created result serves as a stimulus for an additional neuron. Several of layers that make up framework of an ANN include input layer, numerous hidden levels, and output layer. Input layer accommodates and processes input. Output layer offers finished product. The mathematical operation is carried out in the background layers without any direct interaction from the user programme. ANN alters its structure based on internal or external data while learning, travelling via a system of connections. ANN can deliver rapid information eliminate inaccuracy, and has a probability of learning. As a result, it is used to resolve complex problems like classification also prediction. In many fields, including prediction, character recognition, and data forecasting, ANNs have been used. Either supervised or unsupervised ANN instruction is possible. Common methods of training NN is supervised learning, involves giving NN a set of sample data along with expected results from every sample. Only distinction between supervised and unsupervised training is that the latter does not give the neural network the anticipated results. When NN divides input into various bands, unsupervised training results. ANN's basic structure is depicted in Fig.4.6.
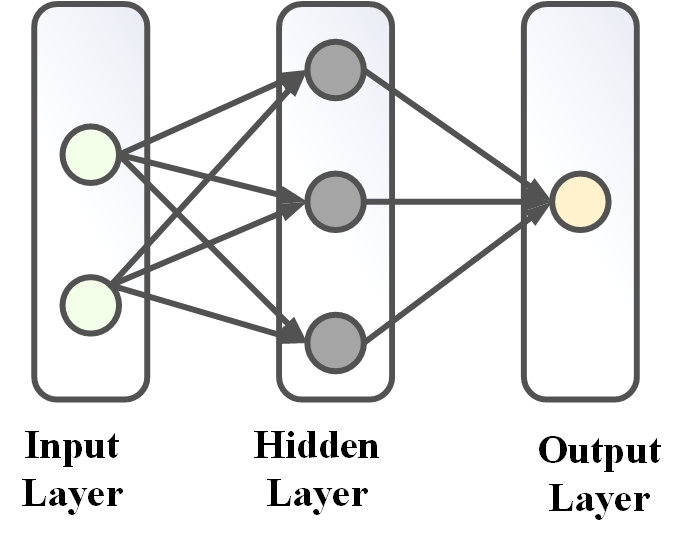
Figure 4.6. Structure of ANN
Mayfly Optimization
MFO's main sense is influenced by mayfly behaviour, particularly during mating. A suborder of the early Balaenoptera swarm, the mayfly belongs to the Ephemeroptera order. Since they are most prevalent in the UK in the month of May, the term "mayfly" was coined. This optimization technique combines the benefits of PSO, GA and FA and is based on PSO. The unaided eye can see adult mayflies once hatching is complete. A mayfly adult only has a short lifespan of one or two days before reproducing, which is its ultimate goal. The male entices the female by forming swarms and engaging in a nuptial dance a few meters above the water. The female fly mates with a male once she has entered the swarm. This mating process only lasts a brief time. After mating, the female mayfly's body discharges the eggs onto the water's surface, and the cycle continues. Each mayfly position during the search denotes a potential solution to the problem. First, mayfly populations of both sexes are randomly split into two groups. Motion of male mayfly, which signals his location, draws the swarm. The female mayfly, on the other hand, fails to collect swarm; instead, she flies to male to breed. Parents are chosen from among “male and female populations”. A parent draws a child in the same way that a female does. They are either picked at random or according to how fit they are. Finally, the cycle is completed when the best female and best male mayflies breed.
Male Mayflies Activity
Male mayflies swarming together reveal each male mayfly's location using either their own sense of direction or that of their nearby neighbours. Examine, the ongoing situation of fly is \({b}_{c}^{Y}c\) in search space at time step \(a\). Location of flies is mixed located on adjunct to speed \({v}_{c}^{Y+1}\) to the existing situation. It stated in Equation (4.5).
\({b}_{c}^{Y+1}={b}_{c}^{Y}+{v}_{c}^{Y+1}\) …Eqn. (4.5)
In addition, the male mayfly's \(a\) velocity is assessed in the Equation (4.6).
\({b}_{ce}^{Y+1}={b}_{ce}^{Y}+{∝}_{1}{d}^{-β{{g}_{r}^{2}\left({pbest}_{ce}-{b}_{ce}^{Y}\right)}^{ }}+{∝}_{2}{d}^{-β{{g}_{g}^{2}\left({gbest}_{e}-{b}_{ce}^{Y}\right)}^{ }}\) …Eqn. (4.6)
where \({b}_{ce}^{Y}\) suggests mayfly velocity, \({pbest}_{ce}\) is best conditions of mayfly, \({∝}_{1}\), \({∝}_{2}\) are positive attractive constant which is exercised to scale contribution of intellectual and social constituent. \({p}_{r}\) also \({p}_{g}\) is cartesian distance within \({b}_{c}^{ }\) and \({pbest}_{c}\) also \({b}_{c}^{ }\) and \({gbest}_{ }\). Equation (4.7) is an assessment of these distances.
\(\left‖{b}_{c}^{ }-{B}_{c}\right‖=\sqrt{\sum_{e=1}^{j}{{\left({b}_{ce}^{ }-{B}_{ce}\right)}^{2}}}\) …Eqn. (4.7)
where \({b}_{ce}^{ }\) point out the \(e\)th element of mayfly \(c\), \({B}_{c}\) is capable of the \({pbest}_{c}\) and \({gbest}_{ }\).
Female Mayflies’ Movement
In order to breed, female fly in guidance of the male. Consider \({h}_{c}^{Y}\) as existing state of female mayfly \(c\) in search space at time frame \(Y\). Situation of flies is mixed based on accretion to velocity \({b}_{c}^{Y+1}\)to present position. However, appeal process happens at random. Because best male will attract best female, second-best male will tempt second-best female, and so on, this process is described as a categorised technique based on the principle of fitness. After considering depreciation issue, its accelerations are estimated as accompanying. The mathematical model is shown in Equation (4.8).
\({b}_{ce}^{Y+1}=\left\{\begin{aligned}{b}_{ce}^{Y}+{∝}_{2}{d}^{-β{{p}_{cf}^{2}\left({b}_{c}^{Y}-{h}_{c}^{Y}\right), if f\left({h}_{t}\right)>f\left({b}_{t}\right)}^{ }} \\ {b}_{ce}^{Y}+A*p if f\left({h}_{t}\right)≤f\left({b}_{t}\right)\end{aligned}\right.\) …Eqn. (4.8)
where \({p}_{c}\) demonstrate cartesian distance amongst female and male, \(A\) demonstrate coefficient of random walk hence estimate of \(p\) extend upon \([-1,1]\). \({b}_{ce}^{Y}\) is quickness of female fly \(c\) in proportions \(e = 1, , … ..x\) at time step \(Y\).
Mating of Mayfly
Two mayflies are about to mate when they exhibit crossover driver. During pairing process, male or female population is selected as the parent. The parent selection procedure, however, made the male attracted to the female. Typically, a fitness function or a random process is used in the selection process. Best female crosses with most excellent male, followed by a second-rate female crossing with third-best male, and so forth. Crossover results in establishment of two offspring, who are as in Equation (4.9) &Equation (4.10).
\(off spring1=R*male+\left(1-R\right)\) …Eqn. (4.9) \(off spring2=R*female+\left(1-R\right)\) …Eqn. (4.10)
where \(male\) and \(female\) suggest male and female parental, \(rand\) demonstrate random value internally specific line. While offspring's primary velocities are set at zero.
BWO
BWO is created using the black widow spider as a model. The black widow is primarily nocturnal in nature; during the day, the female spider is blind, but at night, she spins her web. Additionally, female invests much of her time in a similar web. Typically, the female spider initiates mating. As a component of this ongoing process, the female spray’s specific locations in web with a liquid known as scent to attract male spiders. Peculiar thing about this situation, is following pairing is complete, female spider eats male spider while saving egg for egg sack. There is a chance that the child will cannibalize its mother if it is not physically fit once the egg breeds, offspring has made, and it is prepared for sibling cannibalism.
The first type of cannibalism involves a woman eating her husband after pairing in order to maintain fitness. Second type of cannibalism involves stronger spider eating its healthier siblings. The idea is used in accordance with the cannibalism rate. Only the healthiest young people survive in population, and rests are eliminated. The practise is known as sibling cannibalism. While ideals are less strong the third act is child cannibalism, when a youngster consumes its mother. The mother spider puts her eggs in the stockings over an 11-day maternity period, wherein embryos are developed and prepared for sibling cannibalism. In this instance, young, strong spider eats its weaker brother. Currently, there have been numerous instances of sibling cannibalism due to Black widow spiders' 7-day communal living for the maternal web. The size of population is determined by density-dependent cannibalism, which may be important in black widow populations where mother even quickly expand young spiders. The spiders that are still alive are thought to be the most physically fit. The BWO is thus based on the idea of the black spider.
Mathematical Evaluation
The black widow optimisation process has begun using random initial population of black widows. For purpose of creating offspring, this kind of indiscriminately generated population includes both male and female black widows. The black widow's initial population is in Equation (4.11).
\({A}_{N,k}=\left[{x}_{1,1}{x}_{1,2}{x}_{1,3}…….{x}_{1,M}\right]\) …Eqn. (4.11)
where the populace of the black widow is \({A}_{N,k}\), the decision variable's number is \(k\), upper bound population is \(ub\) and population number is \(N\). Effective solution population of the \(({A}_{N,k})\) is indicated in Equation (4.12), and it is worthwhile in minimising or maximising the core function.
\(objective function=f\left({A}_{N,k}\right)\) …Eqn. (4.12)
A number of predefined parameters are specified in proposed BWO model which are described in the sections before this one. The upper \({P}_{M}\) and lower bounds \({P}_{s}\) are indicated by these parameters.
Upper bound of \({P}_{d}\) is \({P}_{dmax,}\) lower bound of \({P}_{d}\) is \(\frac{{Ω}_{C}-P{pt}^{{Ω}_{ts}}}{{Ω}_{sp}},\) upper bound of \({P}_{s}\) is \(\frac{{Ω}_{P}-P{M.max}^{{Ω}_{dp}}}{{Ω}_{ds}}\), upper bound of \({P}_{s}\) is \(\frac{{Q}_{P}-\left({Q}_{E}-{P}_{rt}{pt}^{{Ω}_{ts}}\right){Ω}_{Mp}/{Ω}_{ds}}{{Ω}_{sp}}\) and lower bound of \(\frac{{Q}_{P}-P{M.max}^{{Ω}_{dp}}}{{Ω}_{ds}}\).
BWO moves on to mutation. The mutation rate is utilised when selecting young spiders. A young spider is picked out and given a small amount of random information to experience mutation. For the purpose of the mutation process, a selected young sibling spider is combined with smaller, randomly generated values. The mathematical model is shown in Equation (4.13)
\({Z}_{l,k}={Υ}_{l,k}+α\) …Eqn. (4.13)
\({Z}_{l,k} \)is the mutated black widow species. random muted value is produced \(α\), then chosen number at random is \(l\) and youngest spider that is accidentally chosen is \({Υ}_{l,k}.\)
Preprocessing
The brightness of image is altered to improve contrast of fish image, making it useful for pre-processing. Let’s assume \({Input}^{ }\) as input image with the matrix of \({j}_{R}*{j}_{S}\) integer pixel lies among 0 and 1. \(INV\) are defined as the possible count of intensity values. Most common value captured is 256.
In Equation (4.14), NHS histogram of InHE with a bin feasible force is referred. However, term \(im=0,1,…, INV-1\) with a bin feasible force is explained.
\(NHS=\frac{number of pixels with density he}{pixels sum}\) …Eqn. (4.14)
NHS histogram of \(E\) with a bin workable force is stated in Equation (4.15).
\(histo=floor\left[\left(INV-1\right)\sum_{he=0}^{{Input}^{ }}{NHS}\right]\) …Eqn. (4.15)
\(floor ()\) typically rounds the values from the equation above to the closest integer value. In order to remove the noise, histogram converts even \(histo\) fish photograph to a median filter. Filter enhances edges of fish images while removing the noise and keeping the pixel whether it is rise or fall. It is nonlinear to use a median filter. The filter's main principle is to replace noisy pixels with the nearest pixels' median values, which are sorted based on fish images with varying levels of grey. When applying the median filter to the input fish image \(histo\), the outcome \({Input}^{ }\) is given based on Equation (4.16).
\(F\left(a,b\right)=med\left\{histo\left(a-x,b-y\right)u, xϵ mask\right\}\) …Eqn. (4.16)
In the Equation (4.16), \(F\) and \(histo\) stand for median filtered images and original filter. The final preprocessed image as a result is \(F\). Additionally, this stage is advanced into the segmentation stage.
Fish Image Segmentation Model adopting Improved Canny Algorithm
Otsu's fish image division method maximises separability of generated groups when choosing appropriate thresholds. The Otsu method is an automatic image segmentation method that uses image thresholding. By maximizing the difference between the intensities of the foreground and background pixels in a grayscale image, it determines an ideal threshold. Otsu's method effectively distinguishes objects of interest from the background, assisting with a variety of image analysis tasks by minimizing intra-class variance and maximizing inter-class variance. Its fundamental concepts are that middle ground and centre of image are separated, maximising differences between classes, and optimal thresholds are then obtained to correspond with grey features of fish photographs.
For an \(L*M\) fish image \(Im (x, y)\) segmented threshold of foreground and background denotes as \(Q\), rate of foreground is \(ω1\), its average value is \(u1\); rate of background is \(ω2\) and average value is \(u2\), \(u\) is image's the mean, variance of the inter-class is \(ic\). Then, get Equation (4.17) & Equation (4.23).
\({ω}_{1}=\frac{{M}_{1}}{L*M}\) …Eqn. (4.17)
\({ω}_{2}=\frac{{M}_{2}}{L*M}\) …Eqn. (4.18)
\({M}_{1}+{M}_{2}=L*M\) …Eqn. (4.19)
\({ω}_{1}*{ω}_{2}=1\) …Eqn. (4.20)
\(u={u}_{1}*{ω}_{1}+{u}_{2}*{ω}_{2}\) …Eqn. (4.21)
\(ic=ω1*{\left(u-{u}_{1}\right)}^{2}+ω2*{\left(u-{u}_{2}\right)}^{2}\) …Eqn. (4.22)
\(ic=ω1*ω2*{\left({u}_{1}-{u}_{2}\right)}^{2}\) …Eqn. (4.23)
The traversed method is finally used to achieve the threshold that maximizes \(ic\), and the best threshold is \(Q\). The lowest threshold of \(Q\) is obtained as, and the highest threshold as in Equation (4.24).
\({Q}_{h}=k*{Q}_{1}\) …Eqn. (4.24) where \(k\) is a constant, the assumed value of \(k\) is 2.
Measures of Improved Canny Algorithm
Step 1: Use the median filter to blur an image. While it takes into account both the relative the domain and the relation Distance, this median filtering strategy reduces images in an effort that eliminates superfluous noise from the inputting image.
Step 2: Determine the gradient's magnitude as well as its trajectory. Once step (1) is finished, this section explains the magnitudes, direction, and gradient.
Step 3: Suppress without going to the maximum. This action resembles the canny operator more closely.
Step 4: Edge detection and connection are carried out, and the double thresholds are adaptively determined.
Calculate the magnitude gradient of the histogram. The Otsu algorithm is then run and provided to the \({Q}_{h}\) & \({Q}_{1}\) of doubly made thresholds, after which algorithm searches entire image of the fish also any marks it may have for potential edge points. The automatic threshold system is applied to the segmentation of the fish. In the segmentation process described above, the interclass between setting and foreground objects is used to calculate the noisier level.
Fish Image Feature Selection Using Hybrid BWO-MA
Black widow spiders' predation-based behaviour served as inspiration for BWOA. It employs the idea of capturing prey and web development to iteratively optimise solutions. Individuals are represented as webs in the population of solutions that the algorithm maintains. Solutions (nodes) are joined with threads (edges) to form webs. Higher fitness values can be found for solutions that are closer to the web's centre. Through the exploration of the search space, BWOA incrementally improves solutions, replacing weaker ones with stronger ones based on fitness. By balancing exploration and exploitation, this algorithm aims to achieve effective optimisation.
The behaviour of mayflies, which have a brief lifespan and a set window for mating and egg-laying, served as the basis for MOA. This algorithm mimics the process by which mayflies look for the best places to breed. Using the idea of flight trajectories, it starts by generating a set of potential solutions and iteratively updates them. Mayflies are divided into various groups, each of which represents a distinct mating method. These tactics have an impact on how solutions are updated, encouraging variety in the search procedure. In order to effectively explore and take advantage of the optimisation landscape, MOA attempts to mimic the reproductive strategy of mayflies.
BWOA and MOA are two examples of how natural behaviours can be converted into optimisation algorithms to deal with challenging issues. They demonstrate the adaptability of nature-inspired techniques in delivering creative answers to optimisation problems.
Fish diseases are identified using a hybrid BWO-MA, and the descriptions of each technique are given below: BWO-MA is a new approach in feature extraction that uses a hybrid algorithm to solve global optimisation issues. The algorithm's ability for discovery is thought to be primarily enhanced by the mayflies transformation. which primarily combines the MA's mutated behaviours with the BWO's black widow mutation mechanism, significantly enhancing the algorithm's local and global search capabilities. In the part that follows, numerical representations of earliest populations, reproduction, cannibalism, changes and convergence are provided.
Initial Population
BWO, where two classes of populations are needed, similar to male and female, the population is at first accomplished randomly. Future generation offspring are created built on this initialization. The calculation of fitness value is important in this process; fitness work is identified as \(fit\) at a widow. Initial group of black widow spiders is described precisely in Equation (4.25).
\({X}_{N,k}=\left[\begin{aligned}{x}_{1,1} {x}_{1,2}{ x}_{1,3 }………{x}_{1,d} \\ {x}_{2,1} {x}_{2,2}{ x}_{2,3 }………{x}_{2,d} \\ {x}_{N,1} {x}_{N,2}{ x}_{N,3 }………{x}_{N,d}\end{aligned}\right]\) …Eqn. (4.25)
\[lb≤{X}_{i}≤ub\]
Here, \(N\) denotes the population's size, the black spider population is represented by \({X}_{N,k}\), the decision variable in the problem is represented by \(k\), and the population's upper and lower bounds are represented by \(ub\) and \(lb\). Populations \({X}_{N,k}\) that are useful in lowering or raising the objective function are represented by Equation (4.26). The mathematical model is shown in Equation (4.26).
\(RMSE=\frac{1}{n}\sum_{i=1}^{n}{{w}_{a}{\left({t}_{a}-\hat{{t}_{a}}\right)}^{2}}\) …Eqn. (4.26)
\(N\) is the no. of samples, \({t}_{a}\) is the true value of sample, \(\hat{{t}_{a}}\) corresponds to value of predicted.
Procreate
Each pair in the group is autonomous, and they work together to reproduce a new origination through mating. As was previously stated, they all test the effectiveness of other species of spiders mating in the web. Therefore, during the live process, they generated about 10 K eggs. However, only the strongest or most fit spider in web survives. An array is used in this algorithm's breeding process. Until a widow array with random numbers is obtained, this array-based reproduction continues. Using the later Equation (4.27) & (4.28), the term \(μ\) is then exploited to denote manufacturing an offspring:
\({y}_{1}=μ*{x}_{1}+\left(1-μ\right)*{x}_{2}\) …Eqn. (4.27)
\({y}_{2}=μ*{x}_{2}+\left(1-μ\right)*{x}_{1}\) …Eqn. (4.28)
\(i\) and \(j\) can be determined randomly between 0 and 1, \(μ\) portrayed in the range of 1 to N.
Cannibalism
Cannibalism comes in three flavours. In an act of sexual cannibalism, the female spider consumes the male before or after mating. The importance of fitness is heavily considered in this situation. The second type of cannibalism occurs when a child eats one of their parents to see which one is stronger or weaker based on fitness. When a spider eats its weaker sibling, it engages in sibling cannibalism, which is similar to cannibalism. This algorithm calculates the cannibalism rate and evaluates the survivor rate.
Mutation
The further invented offspring are advanced in order to increase their capacity for exploration. A customarily originated random number is as well as the offspring variable as explained in Equation (4.29).
\({offspring}_{e}^{'}={offspring}_{e}^{ }+k\) …Eqn. (4.29)
where \(k\) represents a normally distributed random number.
Convergence
A 2-stop status is captured as follows, just like another evolutionary algorithms: a predetermined number of iterations; during some iterations, fitness value of ideal widow, an observer who has achieved a certain level of accuracy, remains the same.
PseudoCode of the BWO-MA Algorithm
Input: Max-num of iterations, no. of cannibalism rate, procreate rate to num. of reproduction is “nr”, mutation rate.
Output: Objective function’s -RMSE.
//Initialization |
1. Original black widow spider population |
For a D-dimensional problem, each pop is an array of chromosomes in D dimensions. |
1. Up until termination is reached, fitness value (RMSE) evaluation |
2. Find nr and best response in population 1. |
// Cannibalism & procreating |
3. For \(i = 1 \)to nr do |
4. Choose two solutions at random from population 1 to serve as parents; |
5. Create D children using Eq. 16; |
6. obliterate the father; |
7. Depending on the rate of cannibalism, get rid of some of the kids; |
8. population 2 will receive the remaining solutions; |
9. End for |
// Mutation |
10. Offspring mutation |
11. Substitute the best new offspring produced by applying Eq. (20) to the worst mayflies. |
// Updating |
12. Revisit population |
13. Get best answer from pop; |
14. Input best answer into ANN classifier. |
15. Effectiveness is assessed to determine best classifier. |
16. Stop |
Fish Image Classification Using (BWO-MA) through ANN
An ANN is used, which is a softer computing method, for processing a wider range of information. The nodes in this method are modelled after artificial neurons, and the weights are determined by the directed edges between the neurons. A recurrent network and a feedforward network are the two categories under which this network is classified. While feedforward networks are by their very nature static, recurrent networks are dynamic. For the given inputs, this produces output as a single set instead of sequentially. This allowed decision support systems for disease diagnosis to successfully implement multilayer neural networks. Multiple layers of neurons are present in MLP, but input layer, hidden layer, and one output layer are 3 essential layers. The results in this case are handled by the output layer. With the exception of input layer, every neuron in other layers acts as a computational component thanks to the nonlinear activation function. When data is present in the input layer, the neural network's goal is for the neurons to calculate sequentially until the desired result is reached at each output neuron. Appropriate classes for the input were indicated by the neural network's output. Each hidden layer neuron and its inputs are connected to other hidden layer neurons as well as weight values in the very next layer. The hidden layer's inputs are in charge of calculating the weighted inputs and adding up the threshold. Fig.4.7 illustrates the MLP structure of the input, hidden and output layer structures. The input layer contains the dataset’s constituent parts. The data that cannot be separated linearly is secured by the hidden layer and the output layer then delivers the desired outcomes. A threshold node is added to the input layer of the weight function. The sums of the results achieved the neurons activity by applying the sigmoid function. The entire procedure is described in Equation (4.30).
\({p}_{j}=\sum_{i=1}^{e}{{w}_{j,a}{x}_{a}+{θ}_{j,}{c}_{j}={f}_{j}\left({p}_{j}\right)}\) …Eqn. (4.30)
where \({p}_{j}\) is assumed to be the linear input combination of \({x}_{1},{x}_{2},….{x}_{e}\) and \({θ}_{j}\) consider as the threshold, then \({w}_{j,a}\) is the connectivity between the neuron \(j\) and the input \({x}_{a}\), also, the activation function here is \(j\)th neuron and \({c}_{j}\) as the output. As described sigmoid function is the general choice for activation function. The mathematical model is shown in Equation (4.31)
\(f\left(t\right)=\frac{1}{1+{e}^{-t}}\) …Eqn. (4.31)
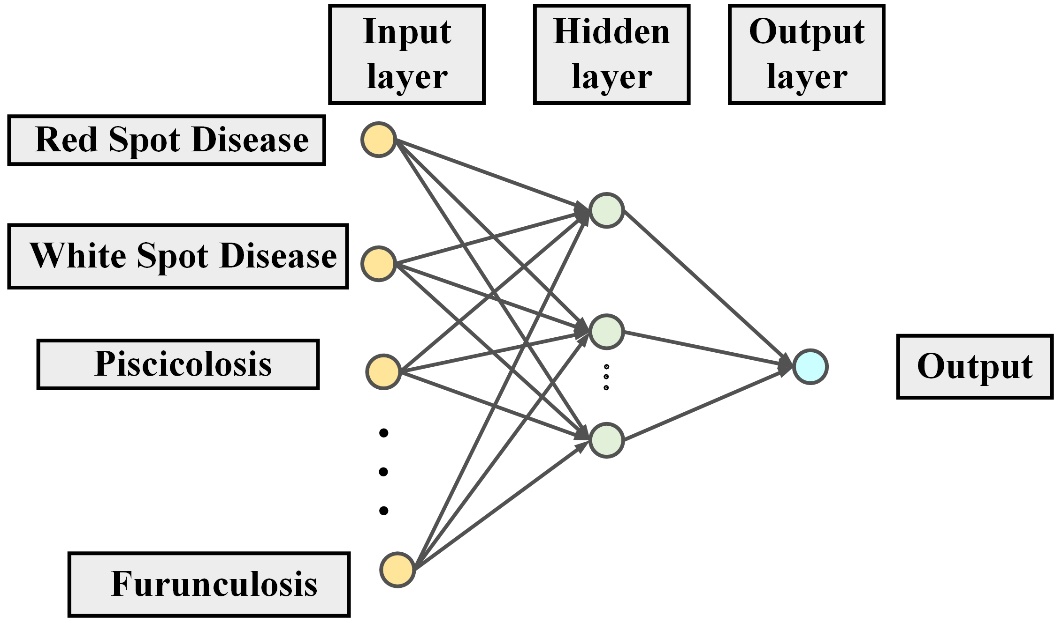
Figure 4.7. Fish disease prediction using an ANN structure
Hyperparameter Tuning With BWO-MA
Choosing the right hyper-parameters is essential for enhancing machine learning performance because it has a direct impact on how a model learns and generalises from data. The predictive ability of a model can be significantly improved by choosing the proper hyperparameters. Employing the proper hyperparameter tuning methods is crucial to achieving this. Grid search, random search, and more sophisticated strategies like Bayesian optimisation and genetic algorithms all aid in the systematic exploration of the hyperparameter space and the discovery of optimal values that enhance model performance. These methods automate the process and eliminate manual guesswork to conserve time and resources.
By fine-tuning hyper-parameters, models are made more appropriate for the particular dataset, which decreases overfitting and improves predictive accuracy—each of which contributes to a higher level of efficiency for machine learning algorithms as a whole. This is the rationale behind why ML performance is greatly impacted by the incorporation of effective optimising. Here, a hybrid meta-heuristic algorithm with BWO-MA is taken into consideration. Additionally, the BWO-MA method of solving optimisation problems involving choosing and fine-tuning hyper-parameters differs significantly from other optimisations. The BWO-MA was chosen in order to improve the ML algorithm's exploration capabilities. Because of the faster convergence speed enabled by this algorithm, the performance and outcomes can be as efficient as possible. According to the discussion in the previous section, optimising the ANN's parameters using the BWO-MA strategy enhances its performance. In this study, three layers—one input, one hidden and one output—were used to model the parameters that would be used to predict the detection of fish diseases.
Contribution 3: HRFSVM: Identification of Fish Disease Using Hybrid Random Forest and Support Vector Machine
In contribution 3, a suggested methodology for this model is presented. Pre-processing, feature extraction, feature segmentation, and feature classification are all involved. Pre-processing is the process of preparing raw data for analysis by cleaning, normalising, and changing it. Outliers can be eliminated, missing values can be handled, features can be normalized or scaled, and data imbalances can be addressed. Pre-processing makes sure the data is in a format that is appropriate for effective analysis, reducing noise and enhancing the quality of input for ML algorithms. The process of identifying and choosing the most pertinent and instructive features from a larger available feature set is known as feature selection. In order to enhance computational efficiency, decrease overfitting, and improve model performance, this is done. With the help of pertinent features that effectively capture key information, feature extraction involves re-presenting raw data. The process of dividing an image or set of data into useful chunks or regions according to predetermined standards is known as feature segmentation. This can be used to segment an image into different objects or areas of interest in image processing.
Partitioning data points into groups or clusters based on their feature values may be necessary for other types of data. Segmentation aids in isolating pertinent data elements for additional examination or processing. The proposed method's operation is described in detail in Figure 8. The data image is used as the input, and noise is removed during pre-processing using a Gaussian filter. DCNN method and multi-layer formation are used to extract the images. Hybrid WOAGA is used to segment the extracted features, and the ACO optimization method is used to choose the best features before the best data is classified using the H-RF method. Placing boxes over the provided image data displays the accurate output. Giving data instances class labels based on their features is the task of feature classification. In order to do this, ML algorithms are utilized to identify patterns in features and forecast the corresponding class labels. The untrained classifier can then be used to categorize newly acquired information.
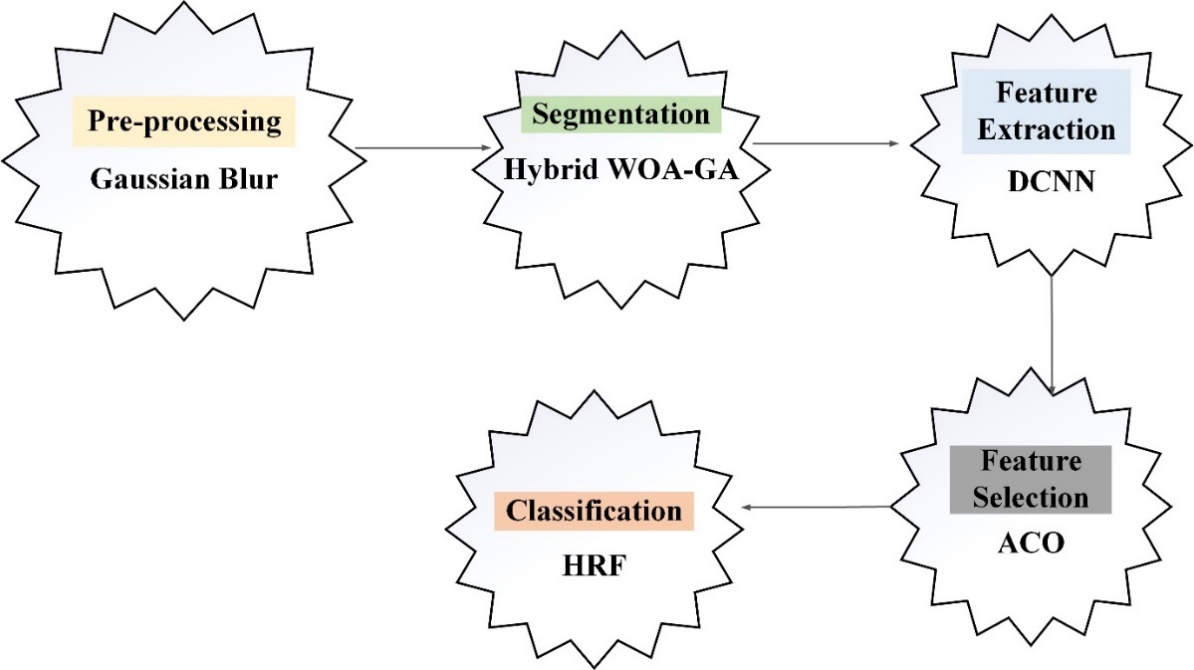
Figure 4.8. Flow of Contribution 3
Pre-processing by gaussian filter
An image or set of data is subjected to a smoothing operation during pre-processing by being convolved with a Gaussian kernel. By reducing noise and pronounced variations in pixel intensities, this filter effectively blurs the image. The Gaussian filter softens the image by giving nearby pixels more weight and farther ones less, making it more suitable for subsequent analysis tasks like feature extraction or object detection. The noise generated by the camera is reduced using a Gaussian filter. This technique reduces noise near edge of image. Equation (4.32) is an expression for the Gaussian Filter method.
\(G\left(x,y\right)=\frac{1}{{2πσ}^{2}}{e}^{\frac{-{x}^{2}+{y}^{2}}{2{σ}^{2}}}\) …Eqn. (4.32)
The distances represented by horizontal axis are \(x\), vertical axis is \(y\), and standard deviation is \(σ\).
Feature segmentation using Hybrid WOA-GA
The way humpback whales hunt served as inspiration for WOA. It imitates the hunt for prey by segmenting the optimization process into Exploration and Exploitation phases. During exploration, solutions (whales) randomly search the search space. Solutions converge on promising areas during the exploitation phase. To strike a balance between exploitation and exploration, WOA uses strategies like encircling prey and bubble-net hunting. It updates solutions by combining movement and prey pursuit tactics, increasing the effectiveness of the search. A population-based optimization method called GA was developed in the spirit of natural evolution. It begins with a population of potential solutions (individuals), which go through multiple generations of selection, crossover, and mutation operations. GA encourages the survival of fitter people through these operations, pushing the population in the direction of ideal solutions. GA excels at handling challenging optimization issues and exploring solution spaces.
The benefits of both algorithms are combined when WOA and GA are integrated. For instance, the WOA's exploration features could be applied early in the optimization process to quickly cover a large solution space. The population could switch to a GA framework as the optimization develops, taking advantage of its selection, crossover and mutation mechanisms for fine-tuning and convergence to optimal solutions. This hybrid approach makes use of both the convergent nature of GA and the wide-ranging exploration of WOA, potentially improving optimization performance in challenging situations. The versatility of optimization techniques is demonstrated by combining nature-inspired optimization algorithms like WOA and GA, enabling practitioners to adapt their strategies to particular problem characteristics and objectives.
To effectively balance the extraction and research phases of optimisation, the WOA-DE hybrid whale optimisation approach is introduced. GA are utilized as a local search strategy to increase potential to exploit results. WOA-GA algorithm is then used to overcome difficulty of multilevel color image segmentation, which is comparable to challenging optimization work. An efficient method for segmenting pictures is discovered using Kapur's entropy.
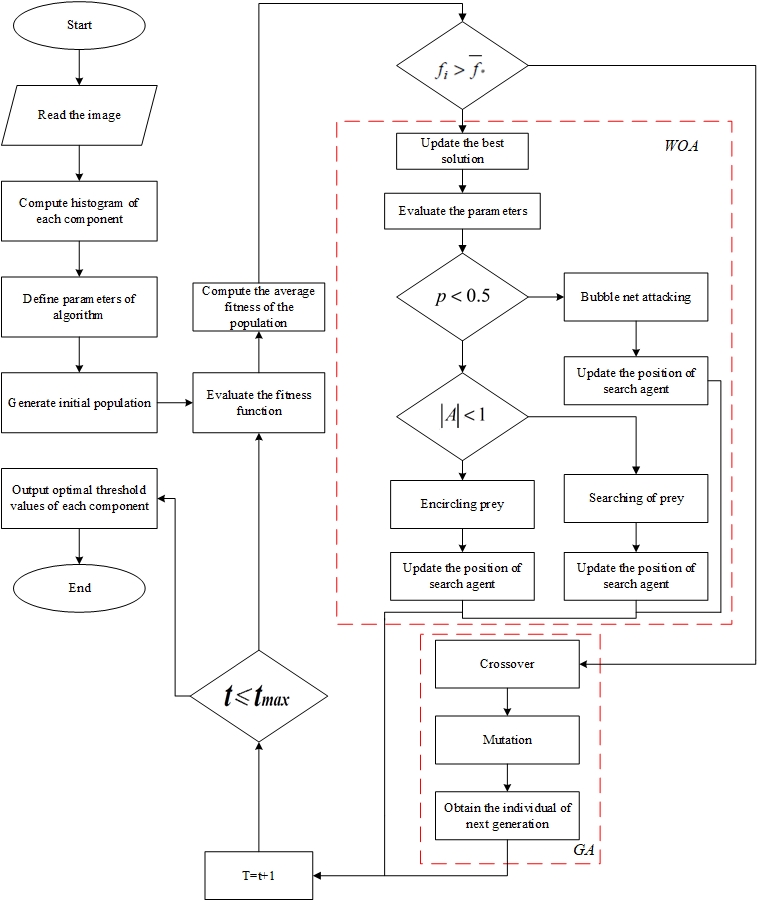
Figure 4.9. Structure of WOA-GA
All picture thresholding techniques fall into one of two main groups: multi-level thresholding techniques or bi-level thresholding techniques. However, the bi-level thresholding method is less effective in images with a large diversity of objects and a high degree of complexity. It separates the image into two main classes using a single threshold setting. Since the RGB image also has the three basic red, green, and blue colour components, these thresholding algorithms are applied on three occasions to determine the appropriate threshold values for each of the three colours. WOA-DE flowchart for selecting ideal threshold values is shown in Fig.4.9. By achieving a better balance between exploration and exploitation, an algorithm's capacity to optimize itself is increased. As a result, a useful hybrid strategy is employed to better harmonise and counterbalance these two periods. The WOA system, the world-wide search method, excels at probing the space of possibilities. GA algorithm, on other hand, is used as a search tool and can increase accuracy of outcomes.
Feature extraction using DCNN
Recent developments in computer vision have been made by DL using the enormous variety of image datasets. Through the use of multiple layers and deep learning, numerous features are extracted. For collecting profound features, the present study uses two pre-trained ResNet series models, such as ResNet-50 and ResNet101. ResNet-50 has 175 elements total, including fully linked, total accumulating, batch normalisation, and summed layers. The operation is subsequently carried out on the probing layer using a function called sigmoid activation. Later, a 347-layer pre-trained ResNet101 model is employed. This model generates output of preferred size N 2048 using FC layer (fc1000). Activation function is described in Equation (4.33).
\(x=\frac{1}{1+{d}^{-y}}\) …Eqn. (4.33)
\(\frac{dx=\left[1-{xe}^{\left(y\right)y}\right]x\left(y\right)}{\frac{dydx}{dy}={\left(1+{e}^{-y}\right)}^{2}}\) …Eqn. (4.34)
\(\frac{dx}{dy}=\frac{{e}^{y}}{{\left(1+{e}^{y}\right)}^{2}}\) …Eqn. (4.35)
4.4.4 Feature selection using ACO
In order to choose a subset of qualities based on ant hunting behaviours, the population-based meta-heuristic technique known as ACO is applied. An ant is going to pick a route with the highest level of signal if given the option since it may indicate the presence of a desirable source of nutrition. As pheromone trail ages, it starts to lose its attraction, which prevents convergence on a locally optimal solution. The discovery of new routes would not be possible without evaporation. An optimisation strategy for ant colonies aims to simulate similar behaviour in ants. A fully integrated undirected graph is used to represent the test process G =V, E, with V as set of vertices. \(v1,v2…vn\) correspond to the features \(F = \{f1, f2…{f}_{n}\}\). \(E\) stands for the collection of data repository edges that link the graph's vertices, and "\(n\)" stands for total number of vertices. The quantity of nodes in the graph equates to the quantity of attributes stored in the picture database because each function is given a vertex. In this study, \(N\) ants, the total number of ants utilised for examining the feature space is equal to \(n\) the number of variables. At a graph vertex, each ant starts out. Using estimated dependence and matching metrics, each ant visits a set of vertices and chooses a feature on its own.
Cosine similarity measure
Cosine value of the angle formed by the two features is calculated using proximity measure metric. Orientation of two features is determined without regard to their sizes. It is calculated using Equation (4.36).
\(sim\left({z}_{j},{z}_{i}\right)=\left|\frac{\sum_{b=1}^{n}{ }\left({z}_{jh} {z}_{ih}\right)}{\sqrt{\left(\sqrt{\sum_{h=1}^{n}{ }{{z}_{jb}}^{2}}\right)\left(\sqrt{\sum_{h=1}^{n}{ }{{z}_{ih}}^{2}}\right)}}\right|\) …Eqn. (4.36)
where the "\(m\)" feature vectors' features \({z}_{j}\) and \({z}_{i}\) may be present. Two aspects are deemed to be oriented in the same direction if their cosine similarity score is 1. when only the extent is considered, features that are 90 degrees apart have a resemblance value of 0, while characteristics, are diametrically opposed have a resemblance worth of 1. Low similarity features are chosen to create the feature subsets.
Rough dependency measure
IS equals \(U\), \(A\), \(C\), and \(D\), where \(U\) stands for universe, a non-empty finite set of objects, \(A\) is a nonempty set of features, \(C\) is a set of conditional features, and \(D\) is decision feature. \(C\) and \(D\) are also included. For any feature subset \(S A\), Equation (4.37) defines an unidentifiable relation denoted IS by \(IND(S)\).
\(IND\left(s\right)=\left\{\left(y,x\right)∈u*u:∀b∈S,b\left(x\right)=b\left(y\right)\right\}\) …Eqn. (4.37)
The letter "\(A\)" in this case denotes how crucial feature "\(A\)" is to object "\(X\)." In Equation (4.38) it is determined what \(X\)'s lower and upper approximations are for S for any \(S ⊆ A\), for any \(X ⊆ U\).
\(\overline{S\left(Y\right)}=\left\{\begin{aligned}Y∈∪:{{\left[y\right]}_{IND (S)}}^{⊆Y} \\ \end{aligned}\right.\) …Eqn. (4.38)
\(\overline{S\left(Y\right)}=\left\{\begin{aligned} \\ Y∈∪:{{\left[y\right]}_{IND (S)}}^{∩Y}≠∅ \\ \end{aligned}\right.\) …Eqn. (4.39)
\({{\left[y\right]}_{IND \left(S\right)=\left\{x∈∪:b\left(x\right)=b\left(y\right)∀b∈S\right\}}}^{ }\) Is \(y\)'s equivalent class in \(U/IND(S)\)
The positive region refers to the objects from \(U\) that can be correctly classified into one class of \(U/IND(S)\) using characteristics from "\(C\)". It is calculated using Equation (4.40).
\(\frac{POS}{\left(S\right)}\left(D\right)={U}_{Y}∈U/{IND}_{\left(p\right)}S\left(Y\right)\) …Eqn. (4.40)
As shown in Equation (4.41), the dependence of "\(D\)" on s is computed.
\({γ}_{s}=\frac{\left|{POS}_{S}\left(D\right)\right|}{\left|∪\right|}\) …Eqn. (4.41)
where \(|U|\) stands for the universe's cardinality of objects. The decision model in this method is defined by \(Is =\left\{U,A,C,D\right\}\)
\(U\) shows a learned set with characteristic vectors and their associated class values: \(A\) refers to \(\{f1, f2…fn, classlabel\}\); \(C\) refers to \(\{f1, f2…fn\}\); and \(D\) refers to \(\{Classlabel = yes∕no\}\). For these two features, \(zj ∈ C\), the heuristic information is given as in Equation (4.42).
\(γ{z}_{j}{z}_{i}\left(D\right)=\frac{\left|{POS}_{{z}_{j}{z}_{i}}\left(D\right)\right|}{\left|∪\right|}\) …Eqn. (4.42)
If the dependence attribute of two features equals one, then two features are dependent on one another; otherwise, metric returns a value of zero.
Classification using H-RF
The proposed system adopts a hybrid approach and integrates Random Forest features to address the categorization challenge. Classification is based on total of all predictions made by various parts that make up classification system. The outcomes of every unit, which is made up of smaller units, are determined by feature extraction unit, kernel, and bootstrap sample. A decision fusion technique is used to combine the output of the units. With this method, SVM subunits can be changed without affecting the Random Forest's architecture. In Fig.4.10, the H-RF flowchart is displayed.
Classification unit: These units are composed of a number of smaller units, and they are all classified using the same unit. One subunit for decision fusion and \(M\) subunits altogether make up a complete unit.
Classification subunit: Different grouping subunits indicate the various classes of the test sample. A parameter that can be chosen when creating an algorithm is typically the quantity of subunits. This research makes use of eight subunits.
The final decision is made using the output data, which is then sent to the RF, which also produces precise output samples.
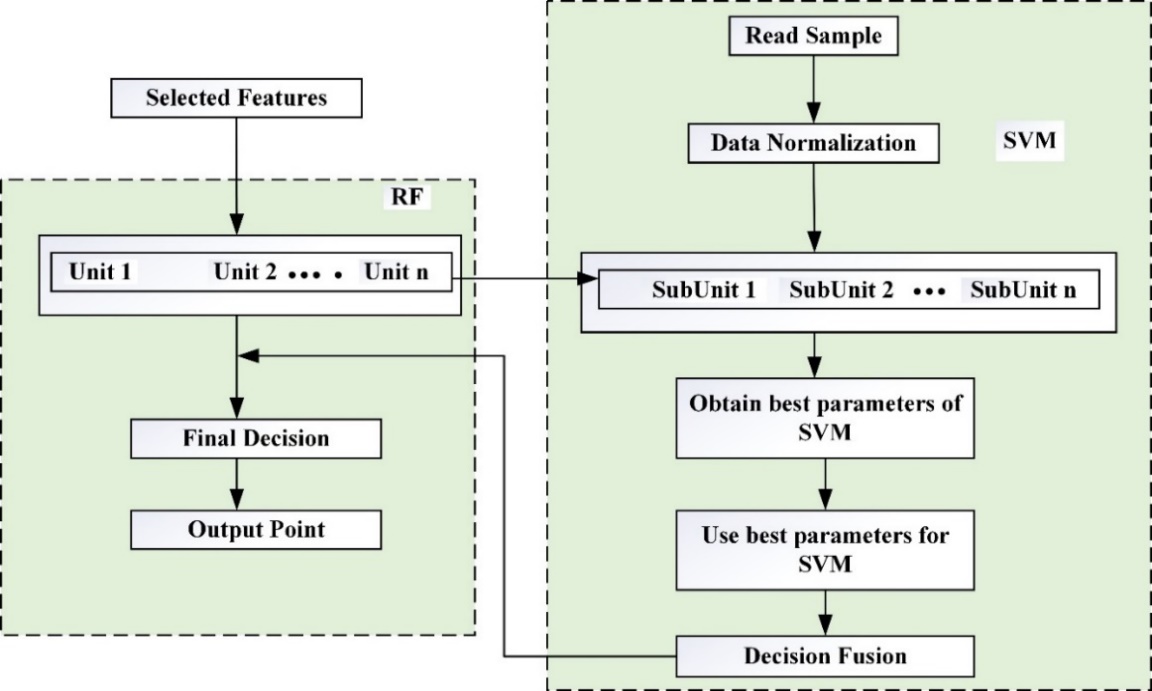
Figure 4.10. Flowchart of H-RF
Conclusion
Fish diseases were difficult to diagnose, but early detection could stop the disease from spreading underwater. To date, manual diagnosis of fish disease was used. In order to advance aquaculture, a new classification and identification system for fish with and without EUS infection was suggested here. An automated image-based process was developed due to how time-consuming manual identification is. The tedious nature of the manual identification process necessitates the use of an automated image-based process. Contribution 1 was based on a prior data set that was gathered from a research project on information fusion for integrated GPS/INS navigation. The analysis suggested a unique method for diagnosing fish sickness because the UKF has distinct autocorrelation in order to overcome the risk of error covariance and noise. With help of ENN, classification accuracy of non-EUS and EUS impact fish was improved by using ML-related algorithms to extract characteristics like GLCM. A live database with images of fish that were impacted by the EUS and simulation software from MATLAB were used in this testing. For identifying and classifying fish diseases, contribution number two suggests an ML technique based on ANN. In order to address issues with global optimisation, presented a new hybrid algorithm called BWO-MA.
The suggested strategy aims to create a BWO-MA with a diagnosis framework using an ANN for the early detection of fish infections. Then demonstrated the superior performance of BWO-MA-based ANN framework by comparing it to currently employed ML techniques. Our in-depth investigation showed that the suggested method achieves cutting-edge performance. When ANN and the BWO-MA were used in tandem to recognise and categorise fish diseases, a high accuracy rate of 96.439% was attained. Contribution 3 provides a DCNN-based ML approach for categorising and identifying fish diseases. In order to address global optimisation issues, the WOA-GA and Ant Colony Optimisation hybrid algorithm was proposed in this research. Hybrid RF algorithm was utilized for classification in contribution 3. To enable the higher quality, differences between proposed WOA-GA-based DCNN framework and the currently in use ML techniques was made. The effectiveness of the suggested detection method was assessed using MATLAB. Performance indicators like recall, precision, recall, accuracy and recall were compared to the performance of the suggested technique.
Chapter 5 Analysis Procedure
Introduction
Fisheries have significant potential for further development because they contribute to social and economic development (Sikder et al., 2021). Fisheries and aquaculture supply protein, support food security and contribute to the economy. Demand for fish increases as the population grows and the benefits of fish as a source of animal protein become more widely recognized. Disease can limit continued production (Hasan et al., 2022). Because disease can spread rapidly among fish, efficient, accurate and timely identification is needed to support prevention. Delays in detection and prevention can increase costs and may have negative effects on human health (Lyubchenko et al., 2016).
This chapter examines MATLAB tools across the three studies. It explains the performance metrics used to evaluate their models, including MSE, accuracy, precision, F1-score, MCC, sensitivity, specificity, NPV, FNR and FPR. It describes the datasets, compares the proposed models with existing approaches and explains the training and testing procedures.
Tool MATLAB
MATLAB is a language that has been specifically created for technical computing and is well-known for its superior performance capabilities. It combines calculations, visualisation, and programming in an approachable setting where issues and answers are presented using well-known notation in mathematics. A simple data component in the software programme MATLAB is an array that doesn't need to be dimensioned. In comparison to writing a programme in a non-interactive scalar language like C or FORTRAN, this allows you to deal with a variety of intricate computer problems, especially those using matrix and vector equations. Matrix Laboratory is the abbreviation for word. Initial goal of MATLAB was to make it simple to use cutting-edge matrix software created by LINPACK and EISPACK projects, which together represent state-of-the-art in matrix calculation software. Following feedback from numerous users, MATLAB has developed over many years. It is typical teaching tool for beginning and advanced courses in engineering, math, and science in academic settings. MATLAB is the chosen tool for effective research, expansion, and evaluation in the field of technical computing. Toolboxes are a kind of particular to the application methods available in MATLAB. Toolboxes are essential for the majority of MATLAB users since they let you study and use specialised technologies. Toolboxes are thorough sets of MATLAB functions (M-files) that enhance the MATLAB environment to address specific problem types. Image processing, processing of signals, systems for control, neural networks, fuzzy logic, wavelets, training, and many other fields are among the fields where toolboxes are offered. This paper mainly focusses on the image processing and the performance evaluated by the performance metrics Moler, C and Little, J (2020).
Performance Metrics
Performance metrics, which are numerical indicators, are employed to assess the efficiency and excellence of prediction. Evaluation metrics are intrinsically connected to machine learning tasks. This inhibits the evaluation of a model's performance and imparts valuable insights into its strengths and weaknesses. There are three types of metrics which can be utilized to assess execution of a model. Classification metrics such as accuracy, precision, F-measure, sensitivity, specificity, MCC (Matthews Correlation Coefficient), NPV (Negative predictive value), FPR (False Positive Rate) and FNR (False negative rate). Regression metrics such as MSE (Mean squared error), MAE (Mean absolute error). Clustering metrics such as silhouette score and Davies Bouldin index Yao, J and Shepperd, M (2021).
In the 1st paper the proposed model’s performance measured by MSE. In this work the back propagation algorithm used to diminish the errors. In such cases, genetic algorithms and optimization algorithms are used to reduce the errors in the model. In 2nd and 3rd paper the proposed method’s performance evaluated using the performance metrics like accuracy, precision, F-Measure, Sensitivity, specificity, MCC, NPV, FNR and FPR.
MSE
MSE used to measure the errors in the statistical model. It evaluated the average squared difference between observed values and the predicted values. It is also known as MSD (Mean squared deviation). If the model has no errors means, the MSE value is 0. As the level of model error rises, its value also increases. Equation (5.1) shows the mathematical representation of MSE
\(MSE\)= \(\frac{\sum_{}^{}{{({A}_{i}-\hat{{A}_{i}})}^{2}}}{N}\) …Eqn. (5.1)
Where, \({A}_{i}\) is the i th observed value, \(\hat{{A}_{i}}\) is the corresponding predicted value and N is the number of observations
Accuracy
Accuracy is the classification metric that is most easily comprehensible. It measures the accuracy of estimated instances by comparing them with the entire quantity of instances. In spite of its simplicity, accuracy may have the potential to be misleading, particularly in imbalanced datasets where one class outnumbers the others. Equation (5.2) represents the formula of accuracy
\(Accuracy=\frac{TP+TN}{TP+FP+FN+TN}\) …Eqn. (5.2)
Precision
Precision is centered on identifying the accurate positives within the projected positives. It quantifies the ratio of accurate positive forecasts in relation to all positive forecasts. Equation (5.3) shows the formula of precision
\(Precision=\frac{TP}{TP+FP}\) …Eqn. (5.3)
Recall or Sensitivity
The measure of recall evaluates the model's capacity to identify all the genuine positive instances, quantifying the ratio between the number of accurate positive predictions and the overall number of real positive instances. Equation (5.4) represents the mathematical representation of Recall
\(Sensitivity=\frac{TP}{TP+FN}\) …Eqn. (5.4)
F1-Score
The F1-Score is determined by finding the harmonic mean of precision and recall. This particular metric ensures a balanced assessment by considering both precision and recall. By amalgamating these two measures, a singular metric is acquired to evaluate the overall performance of a classifier. Notably, the harmonic mean assigns a greater emphasis on lower values, enabling the F1-Score to account for the impact of false positives and false negatives equally. Equation (5.5) shows the formula of F1-Score
\(F-measure=\frac{2*TP}{2*TP+FP+FN}\) …Eqn. (5.5)
Specificity
The metric of specificity quantifies the ratio of accurately identified true negatives by the model. This signifies that there exists an additional ratio of true negatives that are incorrectly predicted as positives and could be denoted as false positives. This proportion may also be known as the True Negative Rate (TNR). Equation (5.6) illustrates the formula of specificity
\(Specificity =\frac{TN}{TN+FP}\) …Eqn. (5.6)
MCC
MCC is a highly regarded classification metric that effectively condenses the information presented by a confusion matrix or an error matrix. And it has 4 entities such as True positives (TP), True negatives (TN), False positives (FP) and False negatives (FN). If the forecast yields favourable rates for all four of these entities, it is referred to as a dependable metric generating elevated scores. Moreover, it is tailored to accommodate the majority of correlation coefficients. A value of +1 signifies the ideal concurrence between the projected and factual values, whereas MCC denotes a spectrum spanning from +1 to -1. A value of 0 denotes an absence of concordance, suggesting that the prognostications are indiscriminate in relation to the genuine results. Equation (5.7) shows the formula of MCC
\(MCC=\frac{\left(TP*TN\right)-\left(FP*FN\right)}{\sqrt{\left(TP+FP\right)\left(TP+FN\right)\left(TN+FP\right)\left(TN+FN\right)}}\) …Eqn. (5.7)
NPV
NPV is a classification metric that is routinely used in medical diagnostics and other binary classification tasks. It assesses the probability that a negative prediction or test outcome is accurate. Equation (5.8) presents the formula of NPV
\(NPV=\frac{TN}{TN+FN}\) …Eqn. (5.8)
FNR
The probability that the test fails to identify a true positive result, thereby leading to its omission, is widely recognized in the scientific community as the false-negative rate. This particular metric, alternatively designated as the "miss rate," serves as a measure of how often a test may mistakenly categorize an actual positive outcome as negative. Equation (5.9) illustrates the formula of FNR
\(FNR=\frac{FN}{FN+TP}\) …Eqn. (5.9)
FPR
The false-positive rate is the proportion of actual negative cases incorrectly classified as positive. It is calculated by dividing false positives by the total number of actual negative cases. Equation (5.10) gives the formula.
\(FPR=\frac{FP}{FP+TN}\) …Eqn. (5.10)
Database Details
The paper relies on the pre-existing database acquired through the information fusion investigation of integrated navigation with GPS/INS.
In the second work, the images were collected through Fish-Pak dataset. The Fish-Pak dataset contains a compilation of images representing six distinct fish species, namely Catla (Thala), Hypophthalmichthys molitrix (Silver carp), Labeo rohita (Rohu), Cirrhinus mrigala (Mori), Cyprinus carpio (Common carp) and Ctenopharyngodon idella (Grass carp). These images, totaling 915 in number, were captured using a Canon EOS 1300D camera from three different locations, namely Head Qadirabad, Head Marala and the Chenab River in Gujarat, Punjab, Pakistan. The Fish-Pak data set proves useful for image classification tasks that rely on visual characteristics. It should be noted that this data set is particularly suited for multiclass problems due to its incorporation of three distinct visual features, namely Scale (color), Body and Head.
In third work, all the data were collected from the simulation reports of the software used by the researchers.
Comparison
Table (5.1) shows that the \({2}^{nd}\) work, 3rd work has the highest accuracy of detecting the fish disease comparing to another existing model. In \({2}^{nd}\) work, a machine learning based ANN used for detect the fish disease in the earlier stage. Also, a novel hybrid algorithm BWO-MA was proposed to solve the global optimization problems. In 3rd work, a machine learning based DCNN used to identify the fish disease. For solving the global optimization problems, a novel hybrid algorithm was proposed which is a combination of Whale Optimization Algorithm with Genetic Algorithm (WOA-GA) and Ant Colony Optimization. In Ahmed et al. (2022), the work was divided into two parts, to minimize noise and exaggerate the image, respectively, image pre-processing and segmentation have been used in the basic component. In the second section, using the machine learning Support Vector Machine (SVM) technique with a kernel function, we extract the relevant features to categorize the diseases.
Table 5.1 Comparison table
Work | Dataset used | Techniques used | Accuracy |
Jhansi and Sujatha 2023 [6] | Fish-Pak Dataset | ANN | 96.439 |
Jhansi and Sujatha 2023 [7] | Open-source Dataset | DCNN | 97.8 |
Ahmed et al. 2022 [8] | Internet and aquaculture firms | SVM | 94.12 with augmentation, 91.42 without augmentation. |
Malik et al. 2017 [9] | – | Neural network and K-NN | 86 |
Gupta et al. 2022 [10] | Images captured from the 2-D welfare camera | CNN | 96 |
Malik, S, Kumar, T and Sahoo, AK (2017) divided their work into two parts, in the initial segment, techniques for enhancing the image, including segmentation, edge detection and morphological procedures, were employed on an EUS image depicting a diseased fish. Subsequently, in the following section, diverse feature descriptors such as HOG (Histogram of Gradient) and FAST (Features from Accelerated Segment Test) were employed to extract features from the image of the fish infected with EUS. The photographs of both fish infected with EUS and fish not infected with EUS were categorized using machine learning algorithms and the resulting accuracy of the classification was determined using a classifier. Gupta et al. (2022) presented a machine-learning method that uses images to find wounds and louse populations in the ecology of salmon farms that are raising live salmon. For the identification of wounds and fish lice, a convolutional neural network of 15 convolutional and 5 dense layers is suggested. Test accuracy for the proposed CNN model is 96.7%, exceeding the accuracy of the VGG-16 and VGG-19 models, which were respectively 91.2% and 92.81%.
Testing and Training
In 1st paper total of 233 samples relating to the images of the fishes affected by EUS and non-infected by EUS were collected. For training 173 samples were taken, remaining 60 for testing. The utilization of the Unscented Kalman Filter (UKF) helps eliminate noise in the samples. The efficacy of the UKF is assessed by calculating the Standard Deviation of the error, which indicates that the value lies within the range of 900×10-4 to 1800 x10-4. The EKF has paved the way for noise removal, leading to a substantial increase in classification efficiency. Used the regression metrics, MSE to evaluate the model’s error. The research at hand concludes that the suggested combination results in an optimal classification efficiency of 98%.
In 2nd paper, the data were collected via the Fish-Pak dataset. It has 6 types of fish namely Catla (Thala), Hypophthalmichthys molitrix (Silver carp), Labeo rohita (Rohu), Cirrhinus mrigala (Mori), Cyprinus carpio (Common carp) and Ctenopharyngodon idella (Grass carp) also including 915 images and it has 3 visual features like Scale (color), Body and Head. For testing 20% of images were taken and the remaining 80% of images were used for training. The proposed model’s performance was evaluated using classification metrics like accuracy, precision, recall, F1-Score and specificity. The proposed model obtained the highest value of all metrics compared to other existing methods. The proposed model obtained high values of accuracy, Precision, Recall, F1-score and Specificity like 96.439, 95.341, 97.421, 94.264 and 95.243 respectively.
In 3rd paper, the data images were collected through the open-source database. For training, 80% were taken and 20% of data were taken for testing. The performance of the proposed model was evaluated using classification metrics like Accuracy, Precision, sensitivity, specificity, F-measure, MCC, Recall, NPV, FNR and FPR. The proposed H-RF obtained the highest value of accuracy 97% compared to other existing model like SVM, Naïve Bayes and RF. Also, the Proposed H-RF obtained the lowest value of FPR and FNR 1.21 and 8.47, which is the proposed model that has the lowest FNR and FPR.
Summary
This chapter has explained MATLAB tools, the performance metrics used to evaluate the three studies and the datasets used for analysis. It has compared the proposed models with existing approaches and described the training and testing data used in each study.
Chapter 6 Results and Discussion
Introduction
The fish, a craniate aquatic animal possessing gills and lacking digits in its limbs, encompasses the living hagfish, lampreys, cartilaginous and bony fish. The class Actinopterygii primarily consists of approximately 95% of living fish species, with teleosts accounting for nearly 99% of that population. Fish are a prolific presence in the majority of aquatic ecosystems. They are ubiquitous, inhabiting nearly all aquatic environments ranging from high-altitude streams to the hadal and even abyssal depths of the deepest oceans. It is important to mention that no species have been discovered in the ocean's deepest 25%. With 34,300 distinct species, fish demonstrate unparalleled species diversity in comparison to any other classification of vertebrates.
Abnormalities and symptoms including a fish not eating, body sores or hazy eyes are indicators of fish sickness. Fish rising to the surface gasping for air or higher than usual rates of illness or death in an aquaculture system are the most typical signs of disease. Stress, suboptimal water quality, excessive population density and an absence of isolation measures for new or ailing fish, aimed at curbing the spread of disease, have all been empirically established as contributing factors to a wide range of maladies and pathologies that afflict aquatic fauna. By using proper care and maintaining adequate hygiene, these factors can all be reduced. Diseases affecting fish are of considerable significance due to their potential to cause mortality. Furthermore, sub-lethal diseases can lead to suboptimal growth, inferior flesh quality or unfavourable visual alterations. The upkeep of ideal water quality and a healthy balance of chemistry, the provision of a balanced diet rich in fish foods and the creation of an ideal habitat with appropriate tank mates for fish are all crucial in preventing the occurrence of nearly all health issues.
This research work detects fish disease using various Machine Learning (ML) and Deep Learning (DL) methods. There are three major contributions to detecting fish disease.
1st Contribution
Epizootic Ulcerative Syndrome (EUS), Unscented Kalman Filter (UKF), Gray Level Co-occurrence Matrix (GLCM), Elman Neural Network (ENN), Probabilistic Neural Network (PNN), Feed Forward Neural Network (FFNN) are utilized in the 1st contribution to the diagnosis of fish disease.
2nd Contribution
Artificial Neural Networks (ANN), Convolutional Neural Networks (CNN), Black Widow Optimization Algorithm with Mayfly Optimization Algorithm (BWO-MA) and GLCM technique are utilized in the 2nd contribution to identify fish disease.
3rd Contribution
The Hybrid Random Forest and Support Vector Machine (HRFSVM), Ant Colony Optimization (ACO), Whale Optimization Algorithm with Genetic Algorithm (WOA-GA), DCNN method and PNN are utilized in the 3rd contribution to identify fish disease.
This section tells the Result and Discussion of the 1st, 2nd, and 3rd Contributions.
6.2 CONTRIBUTION 1: Diagnosis of fish disease using UKF and Elman Neural Network. 6.2.1 Experimental Methodology
Evaluation Criteria: The current study employs the use of MATLAB simulation software to evaluate the proposed methodology for identifying fish diseases. Within this framework, a real-time database providing pictures of fish with the EUS infection is utilized to simulate the testing process. The assessment of the UKF's efficiency in noise removal involves the calculation of the error's Standard Deviation using MATLAB. The experimentation and evaluation of the proposed algorithmic combination for classifying EUS-infected and non-infected fish is conducted through the use of MATLAB simulation software. The extracted GLCM features are utilized for grouping purposes by training and testing the Elman Neural Network using MATLAB and the Back Propagation Algorithm
Energy: Energy for a steady image is 1. The building: consistency, energy consistency and angular second moment are also used to refer to energy returns a value that shows how closely the distribution of its elements matches the GLCM diagonal
\[Energy=\sum_{i=1}^{{N}_{g}}{\sum_{j=1}^{{N}_{g}}{{P}_{ij}^{2}}}\]
Correlation: Correlation is the measurement of the joint probability that the specified pixel pairings will occur
\[Correlation=\frac{\sum_{i=1}^{{N}_{g}}{\sum_{j=1}^{{N}_{g}}{i.j.{P}_{ij}-{µ}_{x}{µ}_{y}}}}{{σ}_{x}.{σ}_{y}}\]
Homogeneity: The value that homogeneity delivers measures how closely the distribution of the GLCM diagonal elements matches the diagonal. Range = [0 1] Homogeneity for a diagonal GLCM is 1
\[Homogeneity=\sum_{i=1}^{{N}_{g}}{\sum_{j=1}^{{N}_{g}}{\frac{1}{1+{\left(i-j\right)}^{2}}.{P}_{ij}}}\]
Contrast: Contrast is the measurement of the local fluctuations in the Gray-level co-occurrence matrix
\[Contrast=\sum_{i=1}^{{N}_{g}}{\sum_{j=1}^{{N}_{g}}{{\left(i-j\right)}^{2}.{P}_{ij}}}\]
Database Description
The current investigation has employed a methodology for identifying fish ailments in aquaculture via MATLAB for assessment and analysis of execution. In particular, a hybrid Random Forest formula for categorization was implemented through MATLAB. Before classification, the Gaussian criteria were employed on the input pictures with MATLAB to remove all noise. Additionally, MATLAB was utilized for characterizing features via the DCNN approach and the formation of multiple layers. To determine the effectiveness, the proposed method's performance measures, including accuracy, recall, precision, recall, sensitivity, specificity, NPV, FPR, FNR and MCC were evaluated by comparing them to those of the proposed technique.
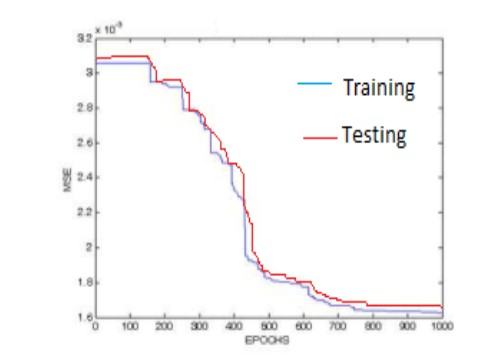
Figure 6.1. Identification of Training and Testing
In Fig.6.1, identification of EUS infected and EUS non-infected through training and testing the fished by EN are provided. The blue line represents the training for the ENN's ability to distinguish between fish with and without the EUS infection. The Red line represents testing by ENN to distinguish between fish with and without EUS infection. The range of EPOCHS is from 0 to 1000 and the range of MSE is from 1.6 to 3.2×10⁴. This figure clearly illustrates the training and testing of fish disease detection, here the training identification is between the range of MSE is from 3 to 3.2×10⁴ and the range of EPOCHS is above 1000. The testing identification is also between the range of MSE is from 3 to 3.2×10⁴ and the range of EPOCHS is above 1000. From the result, it is shown the best result is provided by the testing and training identification of fish with and without the EUS infection. As per the acquired outcomes, the training of fishes with and without the EUS infection slightly varies from the testing of fishes with and without the EUS infection.
EUS Identification
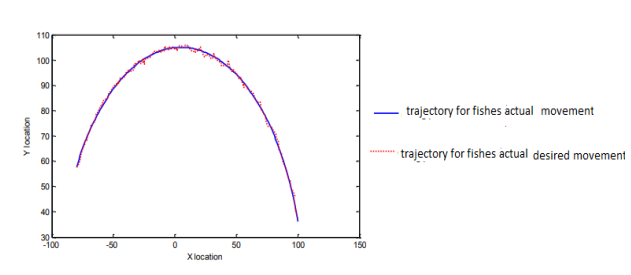
Figure 6.2. EUS Identification
In Fig.6.2, the actual movement of trajectory for fishes and the actual desired movement of trajectory for fishes are provided. The blue line depicts the path for the fish of actual movement. The red line depicts the path for the fish of the desired movement. The range of X location is from -100 to 150 and the range of Y location is from 30 to 110. As per the outcomes, the desired trajectory matches the actual trajectory. Therefore, the proposed model is said to be much more efficient in fish disease detection. From the result, it is shown the best result is provided by the EUS identification.
Performance Analysis
Table 6.1 Feature Extraction
S. No | Energy | Correlation | Homogeneity | Contrast | Status of the fish |
1 | 12678 | 0.6 | 134 | 22 | EUS infected |
2 | 15334 | 0.8 | 126 | 21 | EUS infected |
3 | 13416 | 1 | 115 | 24 | EUS infected |
4 | 2469 | 0.2 | 1221 | 68 | EUS infected |
5 | 3692 | 0.4 | 1569 | 62 | EUS infected |
6 | 4221 | 0.1 | 1328 | 60 | EUS infected |
Thus, GLCM features, as presented in Table 6.1, have been obtained through the extraction process from the output of the filter. The aforementioned characteristics are utilized in training & BPA testing on the ENN allowing fish with and without the EUS infection to be distinguished from each other.
6.3 CONTRIBUTION 2: An Enhanced Machine Learning Technique with a Hybrid Metaheuristic Algorithm to Identify the Fish Disease.
Experimental Methodology
Evaluation Criteria: The experimental procedure was conducted through the use of MATLAB 2020-Ra version, which was employed to create and instruct the ANN framework. To identify the hyperparameters, the MATLAB code was utilized through hybridization of the BWO-MA. The assessment metrics for the various methods, which include the proposed ANN with BWO-MA, were evaluated using MATLAB and subsequently compared. The overall structure of the proposed architecture, which encompassed the preprocessing and segmentation stages, was exhibited using MATLAB
Accuracy: Defining accuracy in operational terms could involve determining the ratio of accurately classified photos of fish images to the overall number of images of fish images
\[Accuracy = \left(\frac{(Tp + Tn)}{(Tp + Tn + Fp + Fn)}\right)\]
Sensitivity: Sensitivity, a statistical metric, finds utility in measuring the correctly identified positives as a percentage. It is alternatively known as recall or True Positive Rate (TPR), and establishes a relationship between TP and the summation of TP and FN. The values attributed to TP and FN are derived from the confusion matrix
\[Sensitivity = \frac{\left(TP\right)}{(TP+FN)}\]
Specificity: Specificity may be elucidated as the proportion of accurately classified negative pictures of fish images to the overall quantity of negative pictures of fish images
\[Specificity = \frac{( Tn)}{(Tn + Fp)}\]
Precision: The positive predictive value is a measure of precision used to determine the proportion of pertinent instances among the retrieved instances
\[Precision = \frac{TP}{(TP+FP) }\]
F1 Score: The F1 score seeks a balance between precision and recall as the distribution of classes are not uniform. The traditional F-score measure is mentioned as:
\[{F1}_{Score}=\left(\frac{2 \left(Recall×precision\right) }{(Recall+precision)}\right)\]
6.3.2 Evaluation: Sample Images and the Recorded Outcomes
In this study, the combination of the BWO-MA with ANN in hybrid has been implemented to effectively recognize fish images using machine learning techniques with metaheuristic algorithms. The assessment of performance metrics has yielded results that demonstrate the enhanced effectiveness of the suggested ANN using the BWO-MA method. Additionally, various fish images have been procured from an open-source dataset and used as input for the classification of disease-affected fish within said images.
Catla, Cyprinus Carpio and Grass Carp are the different types of fish that are used for the input test pictures. The body, head and scalp of the different fish images are given separately to detect the fish disease easily. Moreover, diverse images of fish are utilized as a component of the open-source dataset to classify the fishes that have been afflicted by disease in a given image. Fig.6.3, depicts the input sample images.
The input sample images utilized pre-processed images, which can be seen in Fig.6.4. The pre-processing procedure was carried out via the implementation of a median filtering technique. Of all the pre-processing methodologies employed, the median filtering method yields optimal smoothing of spiky noise.
Fig.6.5 depicts the images resulting from the application of GLCM to the input sample images. The procedure utilized throughout the feature selection process involved the exploitation of GLCM.
Fig.6.6 depicts the categorized areas of infection within the provided input images. The affected regions are denoted by the crimson hue markings.
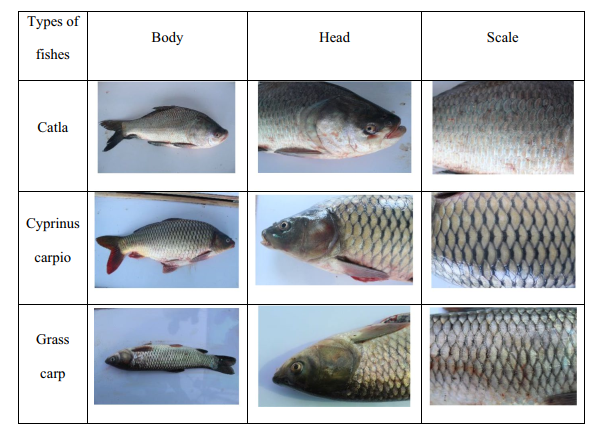
Figure 6.3. Input Sample images
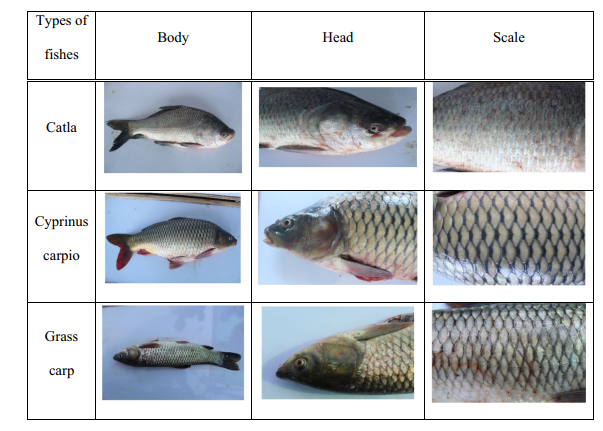
Figure 6.4. Pre-processed images
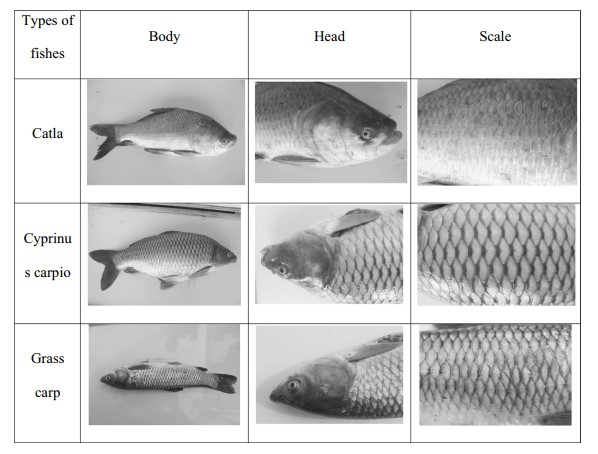
Figure 6.5. GLCM images
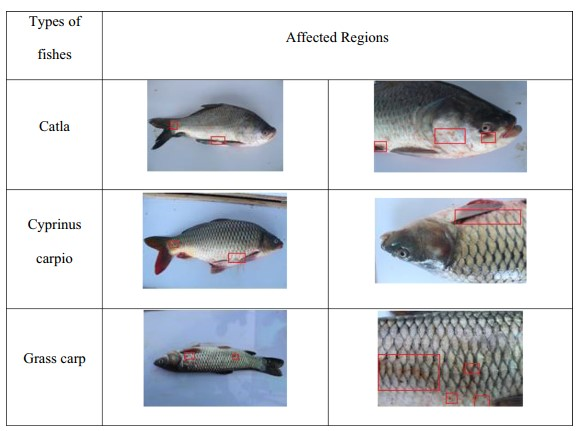
Figure 6.6. Output images
Performance Analysis
The present study comprehensively evaluates various approaches through Table 6.2. The assessment measurements used in the examination involve precision, specificity, accuracy, sensitivity and F1-score.
Table 6.2 Comparative analysis to identify fish diseases
Performance Metrics | Accuracy | Precision | Recall | F1-score | Specificity |
Techniques | |||||
SVM | 93.65 | 88.721 | 91.826 | 93.491 | 87.183 |
Decision Tree | 82.153 | 85.942 | 78.354 | 84.21 | 80.612 |
Naïve Bayes | 78.248 | 83.439 | 76.21 | 81.429 | 78.342 |
Proposed ANN with BWO-MA | 96.439 | 95.341 | 97.421 | 94.264 | 95.243 |
Accuracy: Accuracy is the issue faced by most works. To overcome this, SVM, Decision Tree, Naïve Bayes and proposed ANN with BWO-MA approaches are developed in this research work. As per the acquired outcomes, the proposed ANN with BWO-MA has recorded the highest accuracy as 96.439%. The accuracy data obtained using the suggested model is 2.8% better than the SVM model. The accuracy data obtained using the suggested model is 14.8% better than the Decision Tree model. The accuracy data obtained using the suggested model is 18.8% better than the Naïve Bayes. The utilization of the ANN model has resulted in superior accuracy when compared to the other pre-existing works
Precision: Precision is the foremost challenge encountered by a majority of works. To overcome this, SVM, Decision Tree, Naïve Bayes and proposed ANN with BWO-MA approaches are developed in this research work. As per the acquired outcomes, the proposed ANN with BWO-MA has recorded the highest precision as 95.341%. The precision recorded by the proposed model is 6.9% better than the SVM model. The precision recorded by the proposed model is 9.8% better than the Decision Tree model. The precision recorded by the proposed model is 12.4% better than the Naïve Bayes. The utilization of the Mayfly Optimization has resulted in superior Precision when compared to the other pre-existing works
Recall: Recall poses a significant challenge for a majority of works. To overcome this, SVM, Decision Tree, Naïve Bayes and proposed ANN with BWO-MA approaches are developed in this research work. As per the acquired outcomes, the proposed ANN with BWO-MA has recorded the highest recall as 97.421%. The recall recorded by the proposed model is 5.7% better than the SVM model. The recall that the suggested model recorded is 19.5% better than the Decision Tree model. The recall that the suggested model recorded is 21.7% better than the Naïve Bayes. The utilization of the Black Widow Optimization has resulted in superior recall when compared to the other pre-existing works
F1-score: The F1-score presents a notable obstacle for the majority of studies. To overcome this, SVM, Decision Tree, Naïve Bayes and proposed ANN with BWO-MA approaches are developed in this research work. As per the acquired outcomes, the proposed ANN with BWO-MA has recorded the highest F1-score as 94.264%. The F1-score obtained using the suggested model is 0.8% better than the SVM model. The F1-score obtained using the suggested model is 10.6% better than the Decision Tree model. The F1-score obtained using the suggested model is 13.6% better than the Naïve Bayes. The utilization of the Canny Algorithm has resulted in a superior F1-score when compared to the other pre-existing works
Specificity: The issue of specificity presents a noteworthy obstacle for a majority of literary works. To overcome this, SVM, Decision Tree, Naïve Bayes and proposed ANN with BWO-MA approaches are developed in this research work. As per the acquired outcomes, the proposed ANN with BWO-MA has recorded the highest specificity as 95.243%. The specificity recorded by the proposed model is 8.4% better than the SVM model. The specificity recorded by the proposed model is 15.3% better than the Decision Tree model. The specificity recorded by the proposed model is 17.7% better than the Naïve Bayes. The utilization of the BWOMA has resulted in superior specificity when compared to the other pre-existing works
Figure 6.7 presents the comparative analysis of SVM, Decision Tree, Naïve Bayes and the proposed ANN with BWO-MA. The models are represented by blue, orange, grey and yellow, respectively. Table 6.2 reports accuracy values of 93.65%, 82.153%, 78.248% and 96.439%; precision values of 88.721%, 85.942%, 83.439% and 95.341%; recall values of 91.826%, 78.354%, 76.21% and 97.421%; F1-score values of 93.491%, 84.21%, 81.429% and 94.264%; and specificity values of 87.183%, 80.612%, 78.342% and 95.243%, in that model order.
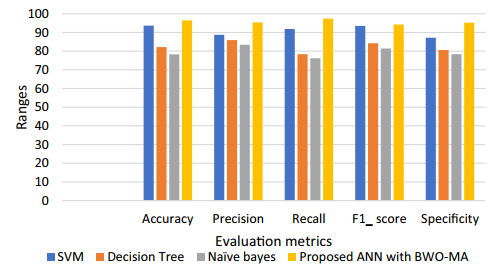
Figure 6.7. Graphical representation of comparative analysis
6.4 CONTRIBUTION 3: HRFSVM: identification of fish disease using hybrid Random Forest and Support Vector Machine
Experimental Methodology
Evaluation Criteria: The present study implemented a detection technique for fish diseases in aquaculture using MATLAB for evaluation and performance analysis. Specifically, a hybrid Random Forest algorithm for classification was implemented using MATLAB. The Gaussian filter was implemented on the input images with MATLAB to remove noise before classification. Additionally, MATLAB was utilized for feature extraction utilizing the DCNN technique and the creation of multiple layers. The proposed approach's success was compared to a variety of performance metrics, including accuracy, precision, sensitivity, specificity, recall, MCC, F-measure, FNR, FPR and NPV
F-measure: The F-measure that merges precision and recall, can be expressed through the ensuing equation
\[F-measure=\frac{2*TP}{2*TP+FP+FN}\]
False-positive rate (FPR): The FPR, otherwise referred to as the aftermath, denotes the ratio of erroneous positive identifications (FP) to the aggregate of veritable negative occurrences
\[FPR=\frac{FP}{FP+TN}\]
False-negative rate (FRR): The FNR also known as the miss rate, represents the percentage of individuals with a confirmed positive medical condition notwithstanding the disease, its diagnostic test findings are negative
\[FNR=\frac{FN}{FN+TP}\]
Negative Predictive Value (NPV): NPV is the proportion of individuals for whom the actual condition is negative but whose test findings are negative
\[NPV=\frac{TN}{TN+FN}\]
Matthew’s Correlation Coefficient (MCC): By taking into account TP, TN, FN, and FP, the MCC emerges as a reliable metric to assess the efficacy of binary classifiers. MCC quantifies the extent of association between predicted and true labels
\[MCC=\frac{\left(TP*TN\right)-\left(FP*FN\right)}{\sqrt{\left(TP+FP\right)\left(TP+FN\right)\left(TN+FP\right)\left(TN+FN\right)}}\]
Four potential classification alternatives can be discerned from this particular model:
A True Positive (TP) relates to a valid and suitably classified individual who belongs to the Positive category
True negative (TN) pertains to instances wherein the negative class is deemed authentic and properly classified as such
A False positive (FP) occurs when there is an erroneous classification of the positive class and the negative class is accurately identified
A False negative (FN) is a category that falls within the realm of legitimacy but has been wrongly classified as negative
Performance Analysis
The present study comprehensively evaluates various approaches through Table 6.3 and Table 6.4. The evaluative metrics employed in the examination encompass TP, TN, FP and FN. The assessment measurements used in the examination involve accuracy, precision, recall, F-measure, specificity, NPV, MCC, FPR and FNR.
Table 6.3 TP, TN, FP and FN values
Proposed H-RF | SVM | Random Forest | Naïve Bayes | |
TP | 6.75 | 5.25 | 4.875 | 4.375 |
TN | 51 | 49.5 | 49.125 | 48.625 |
FP | 0.625 | 2.125 | 2.5 | 3 |
FN | 0.625 | 2.125 | 2.5 | 3 |
True positive (TP): TP is the predominant challenge encountered by the majority of works. To overcome this, the Proposed H-RF, SVM, Random Forest, and Naïve Bayes approaches are developed in this research work. As per the acquired outcomes, the proposed H-RF has recorded the highest TP as 6.75%. The TP recorded by the proposed model is 22.2% better than the SVM model. The TP recorded by the proposed model is 27.7% better than the Random Forest model. The TP recorded by the proposed model is 35.18% better than the Naïve Bayes. The utilization of the DCNN model has resulted in superior TP when compared to the other pre-existing works
True Negative (TN): TN is the difficulty that most works encounter. To overcome this, the Proposed H-RF, SVM, Random Forest, and Naïve Bayes approaches are developed in this research work. As per the acquired outcomes, the proposed H-RF has recorded the highest TN as 51%. The TN recorded by the proposed model is 2.9% better than the SVM model. The TN recorded by the proposed model is 3.6% better than the Random Forest model. The TN recorded by the proposed model is 4.6% better than the Naïve Bayes. Utilizing the WOA-GA Algorithm has resulted in superior TN compared to the other pre-existing works
False Positive (FP): FP is the challenge that most works run into. To overcome this, the Proposed H-RF, SVM, Random Forest, and Naïve Bayes approaches are developed in this research work. As per the acquired outcomes, the proposed H-RF has recorded the lowest FP as 0.625%. The FP recorded by the proposed model is -2.4% better than the SVM model. The FP recorded by the proposed model is -3% better than the Random Forest model. The FP recorded by the proposed model is -3.8% better than the Naïve Bayes. Utilizing the Hybrid Random Forest algorithm has resulted in superior FP compared to the other pre-existing works
False Negative (FN): FN is the predominant challenge encountered by the majority of works. To overcome this, the Proposed H-RF, SVM, Random Forest and Naïve Bayes approaches are developed in this research work. As per the acquired outcomes, the proposed H-RF has recorded the lowest FN as 0.625%. The FN recorded by the proposed model is -2.4% better than the SVM model. The FN recorded by the proposed model is -3% better than the Random Forest model. The FN recorded by the proposed model is -3.8% better than the Naïve Bayes. The utilization of the Ant Colony Optimization has resulted in superior FN when compared to the other pre-existing works.
Table 6.4 The proposed H-RF and current SVM, Random Forest, and Naive Bayes models are used to display the data of TP, TN, FP and FN.
Proposed H-RF | SVM | Random Forest | Naïve Bayes | |
Accuracy | 97.8 | 92.7 | 91.5 | 89.8 |
Precision | 91.5 | 71.1 | 66.1 | 59.3 |
Recall | 91.5 | 71.1 | 66.1 | 59.3 |
F-measure | 91.5 | 71.1 | 66.1 | 59.3 |
Specificity | 98.7 | 95.8 | 95.1 | 94.1 |
FPR | 1.21 | 41.1 | 48.4 | 58.11 |
FNR | 8.47 | 28.8 | 33.8 | 40.6 |
NPV | 98.7 | 95.8 | 95.1 | 94.1 |
MCC | 90.3 | 67.0 | 61.2 | 53.5 |
Accuracy: Accuracy is the issue faced by most works. To overcome this, the Proposed H-RF, SVM, Random Forest, and Naïve Bayes approaches are developed in this research work. As per the acquired outcomes, the Proposed H-RF has recorded the highest accuracy as 97.8%. The accuracy data obtained using the suggested model is 5.2% better than the SVM model. The accuracy data obtained using the suggested model is 6.4% better than the Random Forest model. The accuracy data obtained using the suggested model is 8.1% better than the Naïve Bayes. Utilizing the Hybrid Random Forest algorithm has resulted in superior accuracy compared to the other pre-existing works
Precision: Precision is the foremost challenge encountered by a majority of works. To overcome this, the Proposed H-RF, SVM, Random Forest and Naïve Bayes approaches are developed in this research work. As per the acquired outcomes, the Proposed H-RF has recorded the highest Precision as 91.5%. The Precision recorded by the proposed model is 22.2% better than the SVM model. The Precision recorded by the proposed model is 27.7% better than the Random Forest model. The Precision recorded by the proposed model is 35.1% better than the Naïve Bayes. The utilization of the Genetic algorithms has resulted in superior Precision when compared to the other pre-existing works
Recall: Recall poses a significant challenge for a majority of works. To overcome this, the Proposed H-RF, SVM, Random Forest and Naïve Bayes approaches are developed in this research work. As per the acquired outcomes, the Proposed H-RF has recorded the highest Recall as 91.5%. The Recall recorded by the proposed model is 22.2% better than the SVM model. The Recall signal obtained from the suggested model is 27.7% better than the Random Forest model. The Recall signal obtained from the suggested model is 35.1% better than the Naïve Bayes. Utilizing the Whale Optimization Algorithm has resulted in superior Recall compared to the other pre-existing works
F-measure: The F-measure presents a notable obstacle for the majority of studies. To overcome this, the Proposed H-RF, SVM, Random Forest and Naïve Bayes approaches are developed in this research work. As per the acquired outcomes, the Proposed H-RF has recorded the highest F-measure as 91.5%. The F-measure obtained using the suggested model is 22.2% better than the SVM model. The F-measure obtained using the suggested model is 27.7% better than the Random Forest model. The F-measure obtained using the suggested model is 35.1% better than the Naïve Bayes. The utilization of the DCNN model has resulted in superior F-measure when compared to the other pre-existing works
Specificity: The issue of specificity presents a noteworthy obstacle for a majority of literary works. To overcome this, the Proposed H-RF, SVM, Random Forest and Naïve Bayes approaches are developed in this research work. As per the acquired outcomes, the Proposed H-RF has recorded the highest Specificity as 98.7%. The Specificity recorded by the proposed model is 2.9% better than the SVM model. The Specificity recorded by the proposed model is 3.6% better than the Random Forest model. The Specificity recorded by the proposed model is 4.6% better than the Naïve Bayes. The utilization of the Ant Colony Optimization has resulted in superior Specificity when compared to the other pre-existing works
NPV: NPV poses a significant challenge for a majority of works. To overcome this, the Proposed H-RF, SVM, Random Forest and Naïve Bayes approaches are developed in this research work. As per the acquired outcomes, the Proposed H-RF has recorded the highest NPV as 98.7%. The NPV recorded by the proposed model is 2.9% better than the SVM model. The NPV recorded by the proposed model is 3.6% better than the Random Forest model. The NPV recorded by the proposed model is 4.6% better than the Naïve Bayes. Utilizing the Whale Optimization Algorithm has resulted in superior NPV compared to the other pre-existing works
MCC: MCC is the foremost challenge encountered by a majority of works. To overcome this, the Proposed H-RF, SVM, Random Forest and Naïve Bayes approaches are developed in this research work. As per the acquired outcomes, the Proposed H-RF has recorded the highest MCC as 90.3%. The MCC that the suggested model recorded is 25.8% better than the SVM model. The MCC that the suggested model recorded is 32.2% better than the Random Forest model. The MCC that the suggested model recorded is 40.7% better than the Naïve Bayes. The utilization of the Possibility-based Neural Network has resulted in superior MCC when compared to the other pre-existing works
FPR: The FPR presents a notable obstacle for the majority of studies. To overcome this, the Proposed H-RF, SVM, Random Forest and Naïve Bayes approaches are developed in this research work. As per the acquired outcomes, the Proposed H-RF has recorded the lowest FPR as 1.21%. The FPR recorded by the proposed model is -32.9% better than the SVM model. The FPR recorded by the proposed model is -39% better than the Random Forest model. The FPR recorded by the proposed model is -47.0% better than the Naïve Bayes. Utilizing the WOA-GA Algorithm has resulted in superior FPR compared to the other pre-existing works
FNR: FNR is the issue faced by most works. To overcome this, the Proposed H-RF, SVM, Random Forest, and Naïve Bayes approaches are developed in this research work. As per the acquired outcomes, the Proposed H-RF has recorded the lowest FNR as 8.47%. The FNR recorded by the proposed model is -2.4% better than the SVM model. The FNR recorded by the proposed model is -2.9% better than the Random Forest model. The FNR recorded by the proposed model is -3.7% better than the Naïve Bayes. The utilization of the Genetic algorithms has resulted in superior FNR when compared to the other pre-existing works
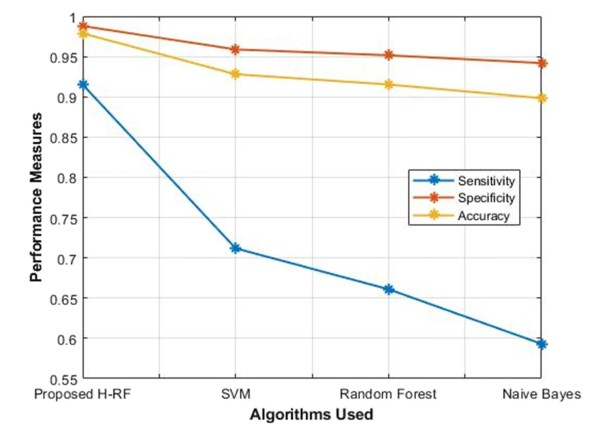
Figure 6.8. Sensitivity, specificity and accuracy performance
Fig.6.8 depicts the performance metrics of sensitivity, specificity and accuracy. The blue depicts the sensitivity, the red line depicts the specificity and the yellow line depicts the accuracy of the SVM, Random Forest, Naïve Bayes and proposed H-RF models. The range of Performance measures is from 0.55 to 1. This figure clearly illustrates the performance of sensitivity, specificity and accuracy by the SVM, Random Forest, Naïve Bayes and proposed H-RF algorithms, here the range of the proposed H-RF by performance of sensitivity is 91.5%, the range of SVM by performance of sensitivity is 71.1%, the range of Random Forest by performance of sensitivity is 66.1%, the range of Naïve Bayes by performance of sensitivity is 59.3%. The range of the proposed H-RF by the performance of specificity is 98.7%, the range of SVM by the performance of specificity is 95.8%, the range of Random Forest by the performance of specificity is 95.1%, the range of Naïve Bayes by the performance of specificity is 94.1%. The range of the proposed H-RF by the performance of accuracy is 97.8%, the range of SVM by the performance of accuracy is 92.7%, the range of Random Forest by the performance of accuracy is 91.5%, the range of Naïve Bayes by the performance of accuracy is 89.8%.
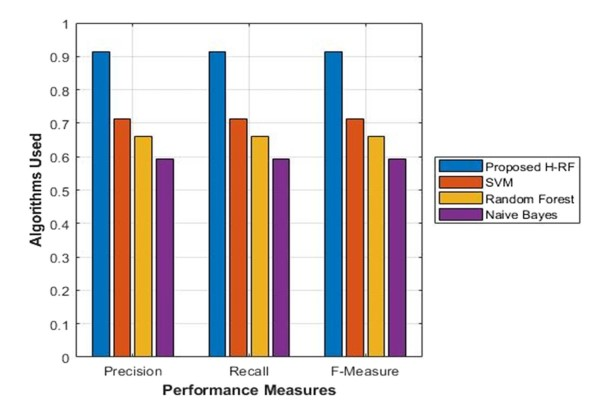
Figure 6.9. Performance metrics include F-measure, recall and precision
Fig.6.9 depicts the graphical representation of the performance measure of precision, recall and F-measure. The blue colour represents the proposed H-RF, the red colour represents the SVM, the orange colour represents the Random Forest, violet colour represents the Naïve Bayes. The range of Algorithms used is from 0 to 1. This figure clearly illustrates the performance of precision, recall, and F-measure by the SVM, Random Forest, Naïve Bayes and proposed H-RF algorithms, here the range of the proposed H-RF by performance of precision is 91.5%, the range of SVM by performance of precision is 71.1%, the range of Random Forest by performance of precision is 66.1%, the range of Naïve Bayes by performance of precision is 59.3%. The range of the proposed H-RF by the performance of recall is 91.5%, the range of SVM by the performance of recall is 71.1%, the range of Random Forest by the performance of recall is 66.1%, the range of Naïve Bayes by the performance of recall is 59.3%. The range of the proposed H-RF by the performance of F-measure is 91.5%, the range of SVM by the performance of F-measure is 71.1%, the range of Random Forest by the performance of F-measure is 66.1% and the range of Naïve Bayes by the performance of F-measure is 59.3%.
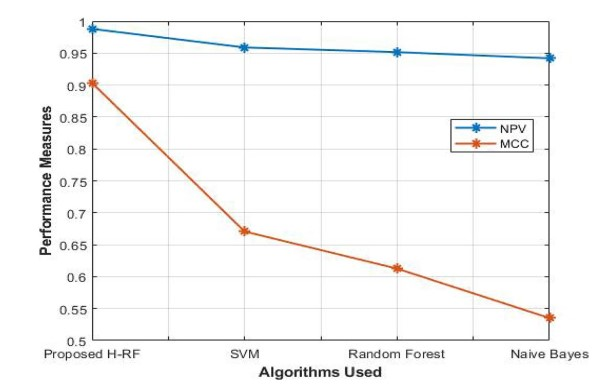
Figure 6.10. Performance measures of NPV and MCC
Fig.6.10 depicts the performance measure of NPV and MCC. The blue colour depicts the NPV model, red colour depicts the MCC model of the SVM, Random Forest, Naïve Bayes and proposed H-RF models. The range of performance measures is from 0.5 to 1. This figure clearly illustrates the performance of NPV and MCC by the SVM, Random Forest, Naïve Bayes and proposed H-RF algorithms, here the range of the proposed H-RF by performance of NPV is 98.7%, the range of SVM by performance of NPV is 95.8%, the range of Random Forest by performance of NPV is 95.1%, the range of Naïve Bayes by performance of NPV is 94.1%. The range of the proposed H-RF by the performance of MCC is 90.3%, the range of SVM by the performance of MCC is 67.0%, the range of Random Forest by the performance of MCC is 61.2%, the range of Naïve Bayes by the performance of MCC is 53.5%.
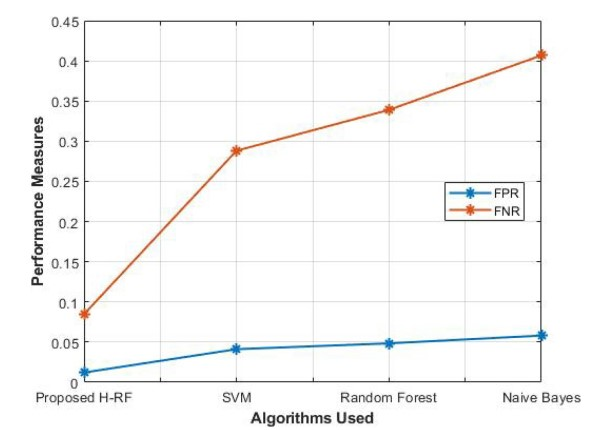
Figure 6.11. Performance measures of FPR and FNR
Fig.6.11 depicts the performance measures of FPR and FNR. The blue colour depicts the FPR model, red colour depicts the FNR model of the SVM, Random Forest, Naïve Bayes, and proposed H-RF models. The range of performance measures is from 0 to 0.45. This figure clearly illustrates the performance of FPR and FNR by the SVM, Random Forest, Naïve Bayes and proposed H-RF algorithms, here the range of the proposed H-RF by performance of FPR is 1.21%, the range of SVM by performance of FPR is 41.1%, the range of Random Forest by performance of FPR is 48.4%, the range of Naïve Bayes by performance of FPR is 58.11%. The range of the proposed H-RF by the performance of FNR is 8.47%, the range of SVM by the performance of FNR is 28.8%, the range of Random Forest by the performance of FNR is 33.8% and the range of Naïve Bayes by the performance of FNR is 40.6%.
Summary
The results of contribution 1 showed better performance on MATLAB which supervised the machine learning models such as UKF, GLCM and ENN by BPA. The acquired outcome in the determination of the amalgamation yields an optimal efficacy of 98% in classification, thereby facilitating the identification of fish specimens that have been affected by EUS as well as those that have not, following the application of the intelligent learning algorithm. The results of contribution 2 showed better performance on MATLAB which supervised the machine learning models and deep learning models such as ANN, BWO-MA, CNN and GLCM techniques. The acquired outcomes in the proposed ANN with BWO-MA are 96.439%, 95.341%, 97.421%, 94.262% and 95.243%. The results of contribution 3 showed better performance on MATLAB which supervised the ML models and DL models such as the HRFSVM, WOA-GA, ACO, DCNN method and PNN. The acquired outcomes in the proposed H-RF are 97.8%, 91.5%, 91.5%, 91.5%, 98.7%, 1.21%, 8.47%, 98.7% and 90.3%.
Chapter 7 Conclusion
Unlike various foods like meat or vegetables, fish is an important source of high-quality protein, fatty acids, vitamins, and critical elements. The proposed intelligent learning algorithm achieves an optimal classification efficiency of 98% for identifying EUS-affected and non-affected fishes. The EKF method is used to eliminate noise, improving classification efficiency. Real-time images of EUS disease-affected and non-affected fish images are tested, and the algorithm automatically detects affected fish. A machine learning-based BWO-MA with ANN classifier is proposed, which shows large matrices and classified output with visual interaction.
To improve effectiveness of the algorithm image processing techniques like histogram equalisation and canny algorithm segmentation are also used. To improve prognosis and classification on fish images, pre-processing, segmentation, hybrid (BWO-MA) feature selection, and ANN classifier methods are utilised. Suggested machine learning approach outperforms convolutional machine learning prediction models on fish image data, according to simulation findings. Comparing this approach to currently available, highly accurate machine learning-based classifiers, it has a high computational efficiency for fish disease prediction.
The third contribution combines Gaussian filtering, DCNN feature extraction, WOA-GA segmentation, ACO feature selection and hybrid Random Forest and SVM classification. Its reported accuracy was 97.8%. Together, the three contributions demonstrate approaches to automated fish disease identification, while the datasets, evaluation metrics and practical challenges described in this thesis remain important considerations for future development.
Future Scope
Deep learning models could enhance fish disease detection accuracy in the future. To further enhance the detection system's precision, other optimisation algorithms and feature selection strategies should be investigated. To overcome obstacles and improve precision and usefulness of fish disease detection structures, more study and creation are required.
The scalability of the proposed system for real-world applications in the fishing industry is also considered
Elman neural networks (ENN) and other automatic feature-extraction techniques should be improved, along with standardized and shared datasets for fish sickness
The creation of uniform and widely used databases for fish illness is essential, as there are currently few expert systems on the Internet and no set standards
Standardizing illness criteria in the dataset and using the human-machine interface of the Internet for social sharing are crucial for diagnosing diverse diseases
In the future, we'll experiment utilising various fish datasets to improve applicability of the technology in various aquaculture fields.
References
U.S. Food and Drug Administration. Fish and Fishery Products Hazards and Controls Guidance, Chapter 5: Parasites. FDA guidance on parasite control.
Ahmed, M.S, Aurpa, TT and Azad, MAK, 2022, Fish disease detection using image based machine learning technique in aquaculture. Journal of King Saud University-Computer and Information Sciences, 34(8), pp,5170-5182
Yue, K and Shen, Y, 2022, An overview of disruptive technologies for aquaculture, Aquaculture and Fisheries, 7(2), pp,111-120
Schar, D, Klein, EY, Laxminarayan, R, Gilbert, M and Van Boeckel, TP, 2020, Global trends in antimicrobial use in aquaculture, Scientific reports, 10(1), p,21878
Saleh, A, 2020, Developing deep learning methods for aquaculture applications (Doctoral dissertation, James Cook University)
Cai, J, Chan, HL, Yan, X and Leung, P, 2023, A global assessment of species diversification in aquaculture, Aquaculture, p,739837
Raja, K, Aanand, P, Padmavathy, S and Sampathkumar, JS, 2019, Present and future market trends of Indian ornamental fish sector, Int J Fish Aquat Stud, 7(2), pp,6-15
Nag, SK, Saha, K, Bandopadhyay, S, Ghosh, A, Mukherjee, M, Raut, A, Raman, RK, Suresh, VR and Mohanty, SK, 2020, Status of pesticide residues in water, sediment and fishes of Chilika Lake, India Environmental monitoring and assessment, 192, pp,1-10
Sikder, J, Sarek, KI and Das, UK, 2021, Fish disease detection system: a case study of freshwater fishes of Bangladesh. Int, J,Adv, Computer Science Application (IJACSA), 12(6), pp,867-871
Su, G, Logez, M, Xu, J, Tao, S, Villéger, S and Brosse, S, 2021, Human impacts on global freshwater fish biodiversity, Science, 371(6531), pp,835-838
Yan, HF, Kyne, PM, Jabado, RW, Leeney, RH, Davidson, LN, Derrick, DH, Finucci, B, Freckleton, RP, Fordham, SV and Dulvy, NK, 2021, Overfishing and habitat loss drive range contraction of iconic marine fishes to near extinction, Science Advances, 7(7), p,eabb6026
Maiti, B, Dubey, S, Munang Andu, HM, Karunasagar, I, Karunasagar, I and Evensen, Ø, 2020, Application of outer membrane protein-based vaccines against major bacterial fish pathogens in India. Frontiers in immunology, 11, p.1362
Rajme-Manzur, D, Gollas-Galván, T, Vargas-Albores, F, Martínez-Porchas, M, Hernández-Oñate, MÁ and Hernández-López, J, 2021, Granulomatous bacterial diseases in fish: An overview of the host's immune response, Comparative Biochemistry and Physiology Part A: Molecular & Integrative Physiology, 261, p,111058
Yang, H, Tu, X, Xiao, J, Hu, J and Gu, Z, 2023, Investigations on white spot disease reveal high genetic diversity of the fish parasite, Ichthyophthirius multifiliis (Fouquet, 1876) in China. Aquaculture, 562, p.738804
Laltlanmawia, C, Ghosh, L, Saha, RK, Parhi, J, Pal, P, Dhar, B and Saha, H, 2023, Isolation, identification and pathogenicity study of emerging multi-drug resistant fish pathogen Acinetobacter pittii from diseased rohu (Labeo rohita) in India, Aquaculture Reports, 31, p,101629
Mia, MJ, Mahmud, RB, Sadad, MS, Al Asad, H and Hossain, R, 2022, An in-depth automated approach for fish disease recognition, Journal of King Saud University-Computer and Information Sciences, 34(9), pp,7174-7183
Klūga, A, Terentjeva, M, Vukovic, NL and Kačániová, M, 2021, Antimicrobial activity and chemical composition of essential oils against pathogenic microorganisms of freshwater fish, Plants, 10(7), p,1265
Irshath, AA, Rajan, AP, Vimal, S, Prabhakaran, VS and Ganesan, R, 2023, Bacterial pathogenesis in various fish diseases: Recent advances and specific challenges in vaccine development, Vaccines, 11(2), p,470
Shepherd, JG, Davis, C, Streicker, DG and Thomson, EC, 2023, Emerging Rhabdoviruses and Human Infection, Biology, 12(6), p,878
Walker, PJ, Bigarré, L, Kurath, G, Dacheux, L and Pallandre, L, 2022, Revised taxonomy of rhabdoviruses infecting fish and marine mammals, Animals, 12(11), p,1363
Goldberg, TL, Blevins, E, Leis, EM, Standish, IF, Richard, JC, Lueder, MR, Cer, RZ and Bishop-Lilly, KA, 2023, Plasticity, Paralogy and Pseudogenization: Rhabdoviruses of Freshwater Mussels Elucidate Mechanisms of Viral Genome Diversification and the Evolution of the Finfish-Infecting Rhabdoviral Genera, Journal of Virology, 97(5), pp,e00196-23
Amosova, V, Berg, C, Boje, J, Cardinale, M, Carlshamre, S, Eero, M, Gröhsler, T, Gutkowska, J, Hommik, K, Horbowy, J and Huwer, B, 2019, Baltic fisheries assessment working group (WGBFAS)
Chang, CC, Wang, JH, Wu, JL, Hsieh, YZ, Wu, TD, Cheng, SC, Chang, CC, Juang, JG, Liou, CH, Hsu, TH and Huang, YS, 2021, Applying artificial intelligence (AI) techniques to implement a practical smart cage aquaculture management system, Journal of Medical and Biological Engineering, 41, pp,652-658
Raoult, V, Tosetto, L, Harvey, C, Nelson, TM, Reed, J, Parikh, A, Chan, AJ, Smith, TM and Williamson, JE, 2020, Remotely operated vehicles as alternatives to snorkellers for video-based marine research, Journal of Experimental Marine Biology and Ecology, 522, p,151253
Consalvo, I, La Mesa, G, Canese, S, Giusti, M, Salvati, E, Loia, M and Tunesi, L, 2021, The demersal fish assemblages of the infra and circalittoral coastal rocky bottoms of the Aeolian Archipelago (Central Mediterranean Sea) studied by Remotely Operated Vehicle (ROV), Mediterranean Marine Science, 22(1), pp,27-39
Wang, JH, Lee, SK, Lai, YC, Lin, CC, Wang, TY, Lin, YR, Hsu, TH, Huang, CW and Chiang, CP, 2020, Anomalous behaviors detection for underwater fish using ai techniques, IEEE access, 8, pp,224372-224382
Nayan, AA, Mozumder, AN, Saha, J, Mahmud, KR, Azad, AKA and Kibria, MG, 2021, A machine learning approach for early detection of fish diseases by analyzing water quality, arXiv preprint arXiv:2102-09390.-
Nayan, AA, Mozumder, AN, Saha, J, Mahmud, KR and Al Azad, AK, 2020, Early detection of fish diseases by analyzing water quality using machine learning algorithm, Walailak Journal of Science and Technology, 18
Upadhyay, D, Manero, J, Zaman, M and Sampalli, S, 2020, Gradient boosting feature selection with machine learning classifiers for intrusion detection on power grids, IEEE Transactions on Network and Service Management, 18(1), pp,1104-1116
Vishnoi, VK, Kumar, K and Kumar, B, 2021, Plant disease detection using computational intelligence and image processing, Journal of Plant Diseases and Protection, 128, pp,19-53
Malik, H, Naeem, A, Hassan, S, Ali, F, Naqvi, RA and Yon, DK, 2023, Multi-classification deep neural networks for identification of fish species using camera captured images, Plos one, 18(4), p,e0284992
Hu, X, Liu, Y, Zhao, Z, Liu, J, Yang, X, Sun, C, Chen, S, Li, B and Zhou, C, 2021, Real-time detection of uneaten feed pellets in underwater images for aquaculture using an improved YOLO-V4 network, Computers and Electronics in Agriculture, 185, p,106135
Reithaug, A, 2018, Employing deep learning for fish recognition (Master's thesis, The University of Bergen)
Wang, H, Zhang, S, Zhao, S, Wang, Q, Li, D and Zhao, R, 2022, Real-time detection and tracking of fish abnormal behavior based on improved YOLOV5 and SiamRPN++, Computers and Electronics in Agriculture, 192, p,106512
Abinaya, NS, Susan, D and Sidharthan, RK, 2022, Deep learning-based segmental analysis of fish for biomass estimation in an occulted environment Computers and Electronics in Agriculture, 197, p,106985
Sveen, L, Timmerhaus, G, Johansen, LH and Ytteborg, E, 2021, Deep neural network analysis-a paradigm shift for histological examination of health and welfare of farmed fish, Aquaculture, 532, p,736024
Ramos, P, 2020, Parasites in fishery products-Laboratorial and educational strategies to control, Experimental parasitology, 211, p,107865
Caffara, M, Gustinelli, A, Mazzone, A and Fioravanti, ML, 2020, Multiplex PCR for simultaneous identification of the most common European Opisthorchiid and Heterophyid in fish or fish products, Food and waterborne parasitology, 19, p,e00081
Madrid, RR, Mertins, O, Tavares‐Dias, M, Flores‐Gonzales, AP, CMF Patta, A, Ramirez, CA, Rigoni, VL and Mathews, PD, 2021, High compliance and effective treatment of fish endoparasitic infections with oral drug delivery nanobioparticles: Safety of intestinal tissue and blood parameters, Journal of fish diseases, 44(11), pp,1819-1829
Ben Hamed, S, Tapia‐Paniagua, ST, Moriñigo, MÁ and Ranzani‐Paiva, MJT, 2021, Advances in vaccines developed for bacterial fish diseases, performance and limits, Aquaculture Research, 52(6), pp,2377-2390
Adams, A, 2019, Progress challenges and opportunities in fish vaccine development, Fish & shellfish immunology, 90, pp,210-214
Chen, W, Gao, S, Huang, Y, Chang, K and Zhao, X, 2022, Addition of Chlorella sorokiniana meal in the diet of juvenile rainbow trout (Oncorhynchus mykiss): Influence on fish growth, gut histology, oxidative stress, immune response, and disease resistance against Aeromonas salmonicida, Fish & Shellfish Immunology, 129, pp,243-250
Mishra, A, Nam, GH, Gim, JA, Lee, HE, Jo, A and Kim, HS, 2018, Current challenges of Streptococcus infection and effective molecular, cellular and environmental control methods in aquaculture, Molecules and cells, 41(6), p,495
Charlie-Silva, I, Klein, A, Gomes, JM, Prado, EJ, Moraes, AC, Eto, SF, Fernandes, DC, Fagliari, JJ, Junior, JDC, Lima, C and Lopes-Ferreira, M, 2019, Acute-phase proteins during inflammatory reaction by bacterial infection: Fish-model, Scientific reports, 9(1), p,4776
Buhat, CAH, Rabajante, JF and Paller, VGV, 2021, Spatiotemporal modeling of parasite aggregation among fish hosts in a lentic ecosystem, Modeling Earth Systems and Environment, 7, pp,2179-2195
Arru, B, Furesi, R, Gasco, L, Madau, FA and Pulina, P, 2019, The introduction of insect meal into fish diet: The first economic analysis on European sea bass farming, Sustainability, 11(6), p,1697
Cong, W and Elsheikha, HM, 2021, Focus: Zoonotic Disease: Biology, epidemiology, clinical features, diagnosis and treatment of selected fish-borne parasitic zoonoses, The Yale Journal of Biology and Medicine, 94(2), p,297
Ziarati, M, Zorriehzahra, MJ, Hassantabar, F, Mehrabi, Z, Dhawan, M, Sharun, K, Emran, TB, Dhama, K, Chaicumpa, W and Shamsi, S, 2022, Zoonotic diseases of fish and their prevention and control, Veterinary Quarterly, 42(1), pp,95-118
Maurya, PK, Malik, DS and Sharma, A, 2019, Impacts of pesticide application on aquatic environments and fish diversity, Contaminants in agriculture and environment: health risks and remediation, 1, p,111
Hsu, YF, Chuang, CY, Huang, HC and Yang, S, 2019, Applying membrane-less electrolyzed water for inactivating pathogenic microorganisms, Applied Ecology & Environmental Research, 17(6)
Mzula, A, Wambura, PN, Mdegela, RH and Shirima, GM, 2021, Present status of aquaculture and the challenge of bacterial diseases in freshwater farmed fish in Tanzania; A call for sustainable strategies, Aquaculture and Fisheries, 6(3), pp,247-253
Servili, A, Canario, AV, Mouchel, O and Muñoz-Cueto, JA, 2020, Climate change impacts on fish reproduction are mediated at multiple levels of the brain-pituitary-gonad axis, General and Comparative Endocrinology, 291, p,113439
Assefa, A and Abunna, F, 2018, Maintenance of fish health in aquaculture: review of epidemiological approaches for prevention and control of infectious disease of fish, Veterinary medicine international
Mishra, SS, Rakesh, D, Dhiman, M, Choudhary, P, Debbarma, J, Sahoo, SN and Mishra, CK, 2017, Present status of fish disease management in freshwater aquaculture in India: state-of-the-art-review, Journal of Aquaculture & Fisheries, 1(003), p,14
Rodger, HD, 2016, Fish disease causing economic impact in global aquaculture, Fish vaccines, pp,1-34
Fazio, F, 2019, Fish hematology analysis as an important tool of aquaculture: a review Aquaculture, 500, pp,237-242
Cui, S, Zhou, Y, Wang, Y and Zhai, L, 2020, Fish detection using deep learning, Applied Computational Intelligence and Soft Computing, 2020, pp,1-13
Ahmed, MS, Aurpa, TT and Azad, MAK, 2022, Fish disease detection using image-based machine learning technique in aquaculture Journal of King Saud University-Computer and Information Sciences, 34(8), pp,5170-5182
Sikder, J, Sarek, KI and Das, UK, 2021, Fish disease detection system: a case study of freshwater fishes of Bangladesh, Int, J, Adv, Computer Science Application (IJACSA), 12(6), pp,867-871
Mia, MJ, Mahmud, RB, Sadad, MS, Al Asad, H and Hossain, R, 2022, An in-depth automated approach for fish disease recognition, Journal of King Saud University-Computer and Information Sciences, 34(9), pp,7174-7183
Santana, PA, Guzmán, F, Forero, JC, Luna, OF and Mercado, L, 2016, Hepcidin, Cathelicidin-1 and IL-8 as immunological markers of responsiveness in early developmental stages of rainbow trout, Developmental & Comparative Immunology, pp,48-57
Attia, MM, Abdelsalam, M, Korany, RM and Mahdy, OA, 2021, Characterization of digenetic trematodes infecting African catfish (Clarias gariepinus) based on integrated morphological, molecular, histopathological, and immunological examination, Parasitology Research, 120(9), pp,3149-3162
Bi, B, Yuan, Y, Jia, D, Jiang, W, Yan, H, Yuan, G and Gao, Y, 2023, Identification and pathogenicity of emerging fish pathogen acinetobacter johnsonii from a disease outbreak in Rainbow Trout (Oncorhynchus mykiss), Aquaculture Research
Sommerville, C, 2012, Advances in non-chemical methods for parasite prevention and control in fish, In Infectious Disease in Aquaculture, Woodhead Publishing, pp, 480-512
Mosser, CM., Thompson, L. and Strange, JS, 2013, Survival of captured and relocated adult spring-run Chinook salmon Oncorhynchus tshawytscha in a Sacramento River tributary after cessation of migration. Environmental Biology of Fishes, 96, pp,405-417
Gupta, A, Bringsdal, E, Knausgård, KM and Goodwin, M, 2022, Accurate wound and lice detection in Atlantic salmon fish using a convolutional neural network, Fishes, 7(6), p.345
Yilmaz, M, Çakir, M, Oral, MA, Kazanci, HÖ.and Oral, O, 2023, Evaluation of disease outbreak in terms of physico-chemical characteristics and heavy metal load of water in a fish farm with machine learning techniques, Saudi Journal of Biological Sciences, 30(4), p,103625
Nayan, AA, Mozumder, AN, Saha, J, Mahmud, KR and Al Azad, AK, 2020, Early detection of fish diseases by analyzing water quality using machine learning algorithm, Walailak Journal of Science and Technology, 18
Jhansi, G and Sujatha, K, 2023 An Enhanced Machine Learning Technique with a Hybrid Metaheuristic Algorithm to Identify the Fish Disease, Wireless Personal Communications, pp,1-21
Hu, J, Zhao, D, Zhang, Y, Zhou, C and Chen, W, 2021, Real-time nondestructive fish behavior detecting in mixed polyculture system using deep-learning and low-cost devices, Expert Systems with Applications, 178, p,115051
Hong Khai, T, Abdullah, S,N,H,S, Hasan, MK and Tarmizi, A, 2022, Underwater fish detection and counting using mask regional convolutional neural network, Water, 14(2), p,222
Yu, G, Zhang, J, Chen, A and Wan, R, 2023, Detection and Identification of Fish Skin Health Status Referring to Four Common Diseases Based on Improved YOLOv4 Model Fishes, 8(4), p,186
Salama, N,K,G, Murray, AG, Christie, AJ and Wallace, IS, 2016, Using fish mortality data to assess reporting thresholds as a tool for detection of potential disease concerns in the Scottish farmed salmon industry, Aquaculture, 450, pp,283-288
Petrellis, N, 2021, Measurement of fish morphological features through image processing and deep learning techniques, Applied Sciences, 11(10), p,4416
Tengtrairat, N, Woo, WL, Parathai, P, Rinchumphu, D and Chaichana, C, 2022, Non-intrusive fish weight estimation in turbid water using deep learning and regression models, Sensors, 22(14), p,5161
Jalal, A, Salman, A, Mian, A, Shortis, M and Shafait, F, 2020, Fish detection and species classification in underwater environments using deep learning with temporal information, Ecological Informatics, 57, p,101088
Yu, LP, Hu, YH, Zhang, XH and Sun, BG, 2013, Development of a triplex loop-mediated isothermal amplification method for rapid on-site detection of three Vibrio species associated with fish diseases, Aquaculture, 414, pp,267-273
Chakravorty, H, 2020, To detection of fish disease using augmented reality and image processing, Advances in Image and Video Processing, Volume8, 1, pp,1-4
Chakravorty, H, Paul, R and Das, P, 2015, Image processing technique to detect fish disease, International Journal of Computer Science and Security (IJCSS), 9(2), pp,121-131
Dutta, MK, Issac, A, Minhas, N and Sarkar, B, 2016, Image processing-based method to assess fish quality and freshness, Journal of Food Engineering, 177, pp,50-58
Guo, N, Chen, HX, Zhang, LP, Zhang, JY, Yang, LY and Li, L, 2020, Infection and molecular identification of ascaridoid nematodes from the important marine food fish Japanese threadfin bream Nemipterus japonicus (Bloch) (Perciformes: Nemipteridae) in China, Infection, Genetics and Evolution, 85, p,104562
Liu, J, Niu, P, Rong, Y, Chen, W, Liu, X, Wei, L and Song, X, 2021, A phenothiazine coumarin based ratiometric fluorescent probe for real-time detection of lysosomal hypochlorite in living cell and zebra fish, Spectrochimica Acta Part A: Molecular and Biomolecular Spectroscopy, 261, p,120024
Muniesa, A, Furones, D, Rodgers, C and Basurco, B, 2022, An assessment of disease occurrence and mortality in marine fish farming in Spain, Aquaculture Reports, 25, p,101257
Ponpukdee, N, Wangman, P, Rodkhum, C, Pengsuk, C, Chaivisuthangkura, P, Sithigorngul, P and Longyant, S, 2021, Detection and identification of a fish pathogen Flavobacterium columnare using specific monoclonal antibodies, Aquaculture, 545, p,737231
Zan, Z, Han, Z, Hou, Y, Zhang, Y and Sun, J, 2022, Development of a loop-mediated isothermal amplification method for detection of Shewanella algae in fish, Aquaculture Reports, 26, p,101292
Wang, JH., Lee, SK, Lai, YC, Lin, CC, Wang, TY, Lin, YR, Hsu, TH, Huang, CW and Chiang, CP, 2020, Anomalous behaviors detection for underwater fish using ai techniques, IEEE access, 8, pp,224372-224382
Ranjan, R, Tsukuda, S and Good, C, 2023, MortCam: An Artificial Intelligence-aided fish mortality detection and alert system for recirculating aquaculture, Aquacultural Engineering, 102, p,102341
van den Boogaart, L, Slabbekoorn, H and Scherer, L, 2023, Prioritization of fish welfare issues in European salmonid aquaculture using the Delphi method, Aquaculture, 572, p,739557
Jin, R, Zhai, L, Zhu, Q, Feng, J and Pan, X, 2020, Naked-eyes detection of largemouth bass ranavirus in clinical fish samples using gold nanoparticles as colorimetric sensor, Aquaculture, 528, p,735554
Huntingford, F, Rey, S and Quaggiotto, MM, 2020, Behavioural fever, fish welfare and what farmers and fishers know, Applied Animal Behaviour Science, 231, p,105090
Bashorun, A, Hassan, ZU, Al-Yafei, MAA and Jaoua, S, 2023, Fungal contamination and mycotoxins in aquafeed and tissues of aquaculture fishes and their biological control, Aquaculture, p,739892
Sheng, X, Xu, X and Zhan, W, 2013, Development and application of antibody microarray for lymphocystis disease virus detection in fish, Journal of virological methods, 189(2), pp,243-249
Laltlanmawia, C, Ghosh, L, Saha, RK, Parhi, J, Pal, P, Dhar, B and Saha, H, 2023, Isolation, identification and pathogenicity study of emerging multi-drug resistant fish pathogen Acinetobacter pittii from diseased rohu (Labeo rohita) in India, Aquaculture Reports, 31, p,101629
Li, J, Lian, Z, Wu, Z, Zeng, L, Mu, L, Yuan, Y, Bai, H, Guo, Z, Mai, K, Tu, X and Ye J, 2023, Artificial intelligence–based method for the rapid detection of fish parasites (Ichthyophthirius multifiliis, Gyrodactylus kobayashii, and Argulus japonicus), Aquaculture, 563, p,738790
Li, WJ, Lyu, XM, Nie, P and Liu, Y, 2022, Morphological, histopathological and molecular characterization of parasitic ciliate Ichthyophthirius multifiliis infecting an indigenous and endangered fish, Schizothorax macropogon (Cyprinidae: Schizothoracinae) in high plateau, Tibet, China, Aquaculture Reports, 25, p,101192
Hasan, N, Ibrahim, S and Aqilah Azlan, A, 2022, Fish diseases detection using convolutional neural network (CNN), International Journal of Nonlinear Analysis and Applications, 13(1), pp,1977-1984
Moler, C and Little, J, 2020, A history of MATLAB, Proceedings of the ACM on Programming Languages, 4(HOPL), pp,1-67
Yao, J and Shepperd, M, 2021,The impact of using biased performance metrics on software defect prediction research, Information and Software Technology, 139, p,106664
Malik, S, Kumar, T and Sahoo, AK, 2017, Image processing techniques for identification of fish disease, IEEE 2nd International Conference on Signal and Image Processing (ICSIP) (pp, 55-59) IEEE
Gupta, A, Bringsdal, E, Knausgård, KM and Goodwin, M, 2022, Accurate wound and lice detection in Atlantic salmon fish using a convolutional neural network, Fishes, 7(6), p,345
Chong, C.M., Shakir, M.Z., Lai, K.S., Liew, H.J. and Loh, J.Y., 2023. Microbes and fish diseases. In Recent Advances in Aquaculture Microbial Technology (pp. 65-102). Academic Press.
Byadgi, O., Wang, P.C. and Chen, S.C., 2023. Transcriptome-wide identification of immune-related genes after bacterial infection in fish. In Transcriptome Profiling (pp. 361-371). Academic Press.
Gallardo, S.S., Fossile, T., Herbst, D.F., Begossi, A., Silva, L.G. and Colonese, A.C., 2021. 150 years of anthropogenic impact on coastal and ocean ecosystems in Brazil revealed by historical newspapers. Ocean & Coastal Management, 209, p.105662.
Publications Associated with This Thesis
Gujjula Jhansi, K,Sujatha, et al. (2019), “Diagnosis of Fish Disease using UKF and Elman Neural Networks”, International Journal of Engineering and Advanced Technology (IJEAT), ISSN: 2249 – 8958, (SCOPUS)
G, Jhansi, K,Sujatha (2023), “An Enhanced Machine Learning Technique with a Hybrid Metaheuristic Algorithm to Identify the Fish Disease”, Wireless Personal Communications, ISSN:0929-6212, (SCOPUS, SPRINGER, WEB OF SCIENCE (SCIE))
G, Jhansi, K,Sujatha (2023), “HRFSVM: identification of fish disease using hybrid Random Forest and Support Vector Machine”, Environmental Monitoring and Assessment, ISSN:0167-6369, (SCOPUS, SPRINGER,WEB OF SCIENCE (SCIE))
Cite This Work
To export a reference to this article please select a referencing stye below:

Academic Master Education Team is a group of academic editors and subject specialists responsible for producing structured, research-backed essays across multiple disciplines. Each article is developed following Academic Master’s Editorial Policy and supported by credible academic references. The team ensures clarity, citation accuracy, and adherence to ethical academic writing standards
Content reviewed under Academic Master Editorial Policy.





