
Abstract
The rapid proliferation of Internet of Things (IoT) devices has underscored the importance of robust anomaly detection techniques to ensure network security and integrity. IoT networks generate vast amounts of diverse and dynamic data, making it challenging to identify abnormal patterns that could indicate malfunctions or security breaches. Traditional methods often struggle to handle this complexity effectively. Therefore, this study presents a novel approach leveraging a fusion of deep learning models like ResNet, Gated Recurrent Unit (GRU), and LeNet-5, for anomaly detection in IoT networks. The proposed method integrates these models and employs an enhanced version of Linear Discriminant Analysis (LDA) to reduce dimensionality while preserving essential features. The proposed anomaly detection method also employs a hybrid optimization algorithm, combining the Salp Swarm Algorithm (SSA) and the Seagull Optimization Algorithm (SOA), to choose the most relevant features for the detection task. This hybrid approach ensures efficient feature selection, enhancing the model’s ability to discern essential information from complex IoT datasets. Numerical results reveal our model’s superiority, achieving an accuracy of 99.9%, precision of 96.7%, recall of 96.1%, F-measure of 96.6%, and a Matthews Correlation Coefficient (MCC) of 0.954.
Keywords: IoT networks, Anomaly detection, Deep learning, GRU, ResNet, LeNet-5, Optimization.
Introduction
IoT stands as a groundbreaking technological paradigm, denoting a network comprising interconnected physical objects equipped with software, sensors, and various technologies. This interconnected web facilitates the collection, exchange, and processing of data over the internet, all without direct human involvement [1]. The spectrum of IoT devices spans from commonplace household gadgets such as smart thermostats and wearables to complex industrial machinery and vehicles. This transformative technology has revolutionized connectivity, uniting an extensive range of devices and sensors on the internet. It fosters effortless communication and seamless data exchange, heralding a new era in technological integration [2-4]. In IoT networks, a multitude of devices continuously generate diverse data streams, providing valuable insights into various applications such as industrial automation, healthcare, smart homes, and environmental monitoring [5]. However, amidst this extensive data flow, identifying anomalies or abnormal patterns is vital for ensuring the security, reliability, and efficiency of IoT systems [6-9].
Anomaly detection is a critical component of cybersecurity and system monitoring across various domains, including IoT networks [10]. Anomaly detection is the process of identifying unexpected behavior or irregularities in data, that may cause potential threats, faults, or security breaches [11, 12]. Anomaly detection algorithms sift through massive datasets, recognizing patterns and trends to identify outliers or irregularities that might indicate malicious activities, hardware malfunctions, or environmental variations. These anomalies often represent potential security threats or operational issues that require immediate attention [13].
Traditional anomaly detection methods, including statistical approaches and rule-based systems, are often ineffective when dealing with the sheer volume and complexity of IoT data. IoT data is typically multivariate, time-dependent, and exhibits non-linear patterns, making it challenging to apply conventional techniques [14, 15]. Machine learning models, particularly deep learning approaches, have gained traction in the IoT anomaly detection domain. Recurrent Neural Networks (RNNs), including variants like GRUs and Long Short-Term Memory (LSTM) networks, have become increasingly significant due to their capacity to effectively model sequential data [16-18]. With the expanding scale and intricacy of IoT networks, the need for accurate, efficient, and adaptive anomaly detection methods becomes increasingly important. This research focuses on the intersection of GRUResLeNe and hybrid optimization approaches to address these challenges, offering a promising solution to enhance anomaly detection in IoT networks.
The contributions made in this research work are as follows:
This paper introduces a novel hybrid optimization algorithm that combines the SSA and the SOA to choose the most relevant features for the detection task. This hybrid approach optimizes the feature set, improving the model’s capacity to discern significant patterns within intricate IoT data.
In GRUResLeNet-5, the GRU layer captures the temporal dynamics of IoT data sequences, understanding the sequential behavior of devices over time. Simultaneously, the ResNet blocks facilitate the training of deep layers, ensuring that complex patterns are comprehensively represented. The LeNet-5 convolutional layers focus on spatial feature extraction, identifying spatial anomalies in sensor readings. The fusion of these three components enables GRUResLeNet-5 to holistically analyze the IoT data, combining insights from both temporal and spatial dimensions. This fusion model’s unique capability to capture sequential dependencies, handle deep architectures, and extract spatial features equips it with exceptional accuracy and efficiency in detecting anomalies within IoT networks.
The proposed method achieves remarkable improvements in various evaluation metrics, including F-measure, precision, specificity, sensitivity, accuracy, and MCC, showcasing its superior performance compared to existing methods.
The remaining sections of the document are structured as follows: section 2 delves into existing research, providing context. In section 3, the methodology adopted for the research is explained in detail. Section 4 presents detailed research outcomes and method comparisons using numerical data. Section 5 summarizes key findings and future scope.
Literature Review
Xu et al. [19] proposed an innovative approach for intrusion and anomaly detection in IoT applications using a data-driven method. This approach involves pre-processing the data with techniques such as mutual information-based feature selection and Synthetic Minority Oversampling Technique (SMOTE). The balanced dataset is then subjected to an Automated Machine Learning (AutoML) process, specifically employing a Bagged Ensemble of Decision Trees, to optimize classification accuracy. The advantage of this method lies in its ability to enhance model performance through data balancing, feature selection, and automated hyper-parameter tuning, resulting in a high accuracy rate of 99.7%. However, its limitation lies in the computational resources required for extensive iterations during the AutoML process, which could be a constraint in large-scale applications.
A cutting-edge approach for detecting cyberattacks in large-scale IoT environments was introduced by Sáez-de-Cámara et al. [20]. This novel system utilized Federated Learning (FL) to train unsupervised models across diverse IoT devices. The collaborative learning reduced network overhead and isolation challenges. A unique aspect was the integration of an unsupervised device clustering algorithm within the FL pipeline, addressing device heterogeneity. In this system, IoT devices acted as clients, participating in local model training and sending updates to a central server. The server coordinated FL rounds, optimized models, and clustered devices based on similarities. Anomaly detection employed lightweight autoencoder neural networks trained on normal IoT traffic. This approach offered a rapid response to emerging threats, making it well-suited for resource-constrained IoT environments.
Ahmad et al. [21] designed an efficient Multistage Spectrogram image-based network Anomaly Detection System (MS-ADS). Traditional systems struggled with accuracy and high false alarm rates, prompting the development of MS-ADS. This system utilized deep Convolution Neural Networks (CNN) and spectrogram images generated from network flow data. The MS-ADS comprised four key stages: Data acquisition, dataset generation, anomaly Detection, and Continuous learning. The CNN-based detection system effectively screened network packets, classifying them as benign or anomaly. Anomalies were further categorized into types such as information theft, Reconnaissance, DDoS, and DoS. The system’s efficiency was enhanced by a continuous learning stage, ensuring adaptability to emerging threat patterns and network changes. However, MS-ADS may face challenges in handling highly dynamic and diverse IoT network environments, potentially leading to misclassifications and requiring continuous updates to adapt to new threats.
The intrusion detection system introduced by AbuAlghanam et al. [22] utilized a multi-step process, starting with dataset pre-processing, feature selection, and k-Means clustering for data reduction. Two parallel subsystems, employing the Modified Isolation Forest (M-iForest) algorithm, were created: one trained solely on attack records and the other on normal records. These subsystems generated independent decisions, which were then combined in a fusion system. This fusion approach aimed to enhance accuracy and reduce false alarms. The M-iForest algorithm dynamically adjusted the contamination parameter based on fitness values derived from the model. Decision combinations determined whether a packet was identified as an attack, normal, or anomaly. This approach led to reduced runtime and improved accuracy. However, the system’s performance depended on appropriate parameter configurations and varied with different dataset characteristics.
Shao et al. [23] introduced an anomaly detection technique tailored for IoT devices, employing a hybrid approach involving Bloom filters and hashing techniques. The method expands data dimensions using a hashing algorithm and utilizes competitive learning to construct a multi-layer Bloom filter. Remarkably, it achieves nearly 95% accuracy in detecting anomalies across diverse datasets. This approach provides a swift and stealthy anomaly detection technique suitable for high-throughput IoT security systems. However, it is worth noting that collision handling in the Bloom filter might impact false positive rates, posing a challenge in real-world applications.
Zeng et al. [24] introduced a novel approach called Adformer model for anomaly detection in IoT systems using multivariate time series data. They employed an adversarial transformer structure with two-stage training. In the first stage, the model learned to reconstruct normal time series data, effectively capturing short-term trends. The second stage involved adversarial training between two decoders, enhancing the model’s ability to detect anomalies by amplifying reconstruction errors of abnormal inputs. Two innovative strategies, fused anomaly probability, and first-stage reconstruction error as prior knowledge, were employed to improve anomaly detection. The fused probability strategy enabled the model to focus on short-term trends. The method achieved high accuracy, as demonstrated through experiments on public datasets. However, the model’s accuracy might be affected when dealing with highly dynamic and rapidly changing IoT environments, where anomalies occur in complex and unpredictable patterns.
Kethineni and Gera [25] proposed a privacy-preserving anomaly detection model designed specifically for smart agriculture within the IoT framework. Data from diverse IoT devices used in agriculture, such as sensors measuring environmental parameters and crop health, were collected. To ensure data privacy, techniques like feature selection, mapping, normalization, and encoding with a Sparse Capsule-Auto Encoder (SCAE) were applied. For intrusion detection, an Attention-based GRU was employed, enabling the model to concentrate on crucial features and identify irregular patterns in the data. However, challenges emerged in implementing intricate privacy-preserving techniques, and scalability issues for large-scale agricultural IoT systems remained a concern.
Halder and Newe [26] addressed the security challenges in LoRa-enabled Industrial IoT networks, particularly focusing on impersonation attacks. They introduced Hawk detection model, that utilized the Carrier Frequency Offset (CFO) for fingerprinting devices and detecting anomalous deviations caused by adversaries. Hawk employed federated learning to efficiently aggregate device-specific CFO behavior profiles. Hawk’s core utilized Gated Recurrent Units (GRUs) for modeling, which exhibited advantages such as fewer parameters and reduced training time. The system employed adaptive CFO updates to compensate for noise and drift, ensuring fine-grained CFO estimation. Hawk’s training algorithm was designed to choose a global GRU model, reducing communication overhead. However, limitation of Hawk is the potential challenges associated with fine-grained CFO estimation due to noise and drift in LoRa-enabled IIoT devices, which can affect the system’s accuracy in detecting anomalous deviations.
Proposed Anomaly detection model
Fig. 1 provides the framework of the proposed Anomaly detection model. The proposed methodology starts with preprocessing raw data, addressing missing values, and ensuring uniformity through normalization techniques. These pre-processed data are then fed into an Improved LDA model for dimensionality reduction. Then, the features are extracted and a novel feature selection approach is implemented, utilizing a hybrid optimization algorithm that combines SSA and SOA to meticulously choose relevant features. This hybrid architecture, combining GRU for sequential patterns, ResNet for spatial features, and LeNet-5 for hierarchical spatial features, allows the model to effectively capture both sequential and spatial information in the input data.
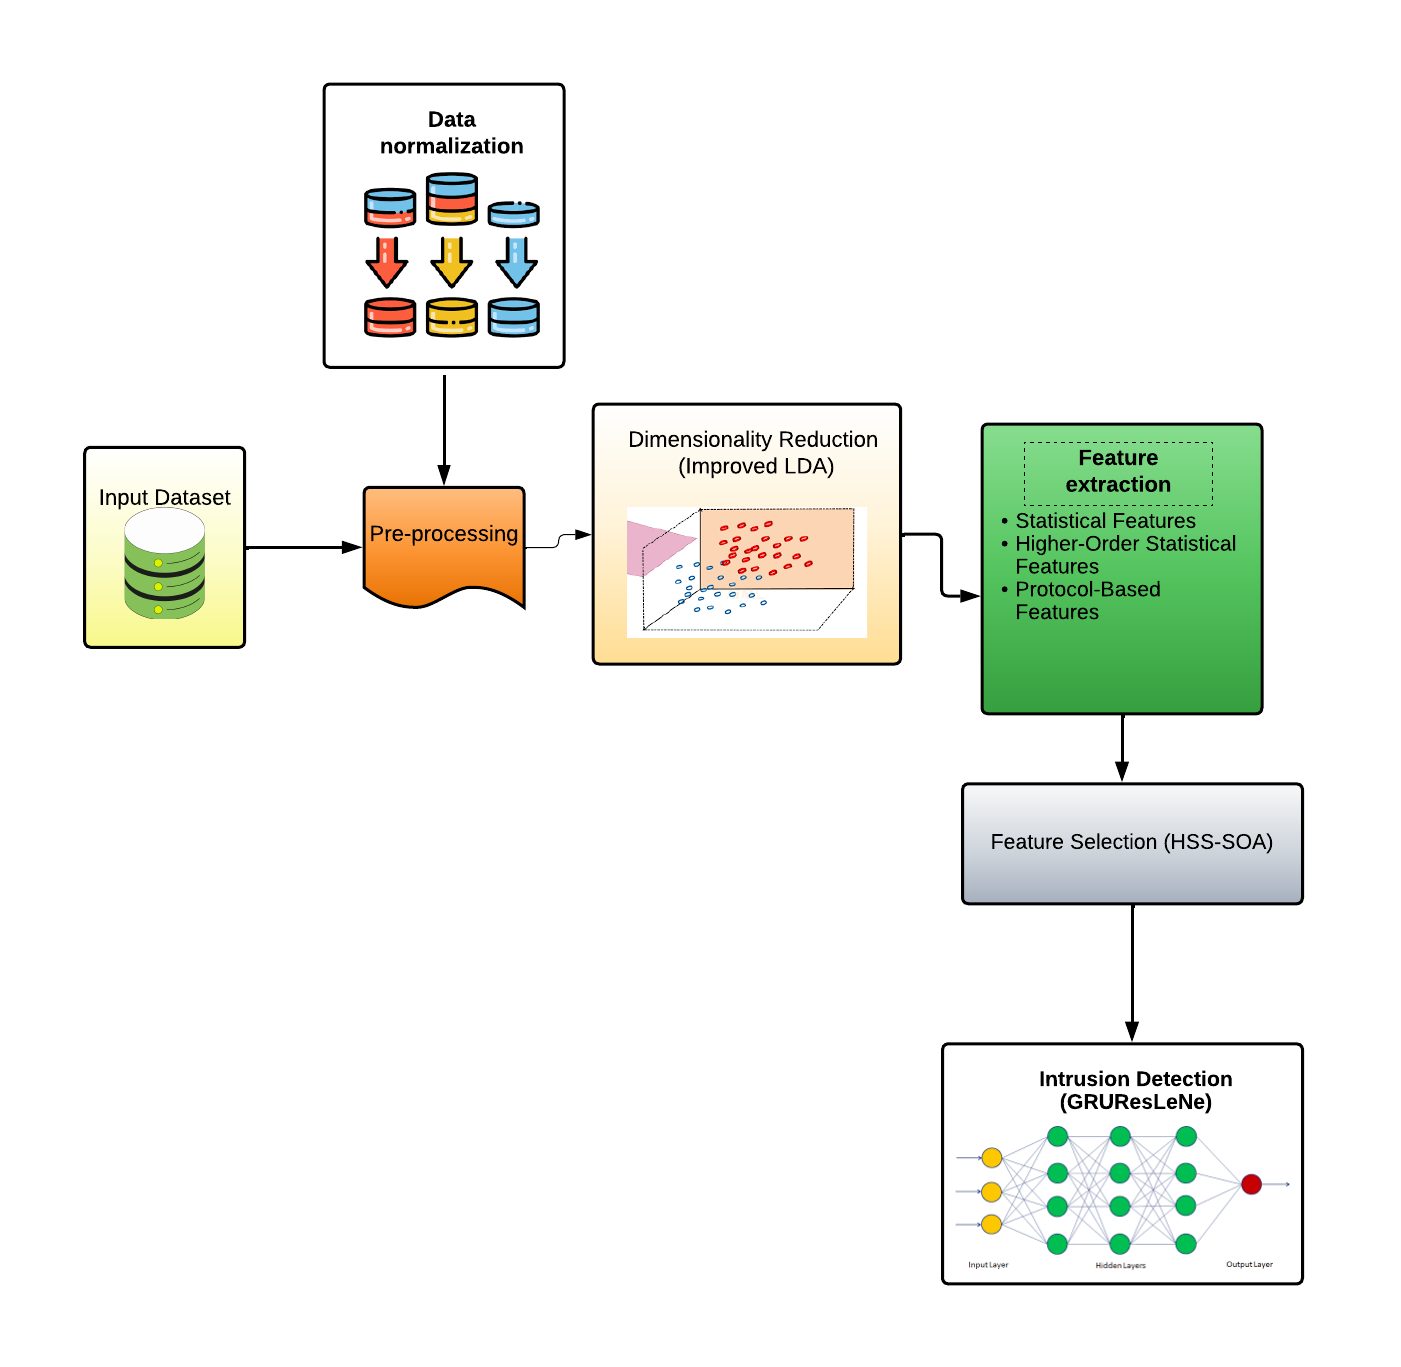
Figure 1: Framework of the Proposed Intrusion Detection Model
Data Preprocessing
In IoT networks, data preprocessing is crucial for anomaly detection. It helps eliminate noise, handle missing values, and ensures data uniformity by scaling features. Addressing categorical data, imbalanced datasets, and high-dimensional data challenges enhances accuracy. Data preprocessing optimizes data quality, enabling precise anomaly detection in complex IoT environments.
(i) Noise Removal: Noise in data refers to irrelevant or erroneous information that can obscure the actual patterns in the data. Data cleaning involves identifying and removing such noise from the dataset. This can include outliers, errors, or inconsistencies in the data points.
(ii) Handling Missing Values: Datasets often have missing or incomplete data points due to various reasons such as technical issues or human error. Proper methods, such as interpolation or removal of rows/columns with missing values, are applied to handle these gaps in the dataset. Handling missing values ensures that the analysis is based on a complete and representative dataset.
(iii) Min-Max Normalization: Normalization is a technique used to scale the numeric features of the dataset to a specific range, often [0, 1]. Min-Max normalization is one such method where the minimum value in the feature column is subtracted from all values, and then the result is divided by the range. This transformation ensures that all features contribute equally to the analysis, especially when they are measured in different units or have varying scales.
Dimensionality Reduction (Improved LDA)
Improved Linear Discriminant Analysis (LDA) is an advanced variant of the traditional Linear Discriminant Analysis technique, designed to address its limitations and enhance its performance. LDA is a popular dimensionality reduction method used for feature extraction and classification tasks. The primary goal of LDA is to project the data onto a lower-dimensional space while maximizing the separation between classes. Improved LDA emphasizes the importance of feature discrimination, which means it enhances the separability between different classes. It achieves this by considering the importance of each feature in the classification process. By focusing on a subset of relevant features, Improved LDA minimizes the dimensionality of the data. Reducing dimensionality not only simplifies the model but also leads to faster training and prediction times, especially when dealing with high-dimensional datasets.
Algorithm 1: Improved LDA |
Input -Training data features -Corresponding class labels Output -Optimal projection matrix Bias term Reduced-dimensional data Steps: 1. Calculate Class Means: For each class , calculate the mean vector using the samples belonging to that class. 2. Within-Class Scatter Matrix : Calculate using the formula: where denotes the number of classes. 3. Between-Class Scatter Matrix : Calculate the using the formula: where denotes the overall mean of all classes. 4. Eigendecomposition: Compute the matrix . Perform eigendecomposition on to obtain eigenvalues and corresponding eigenvectors . 5. Sort Eigenvectors: Arrange the eigenvectors based on their corresponding eigenvalues, sorting them in descending order. Choose the top eigenvectors that correspond to the largest eigenvalues, where represents the desired dimensionality of the reduced space. 6. Construct Projection Matrix: Form the projection matrix by stacking the selected eigenvectors horizontally: 7. Project Data to Reduced Dimension: Project the input data to the reduced-dimensional space using the projection matrix : 8. Calculate Bias: If necessary, compute the bias term for the linear discriminant function. Output: Return the projection matrix , the bias term , and the reduced-dimensional data . |
Feature Extraction
IoT networks generate vast amounts of data from diverse sources such as temperature sensors, motion detectors, humidity sensors, and more. To effectively identify anomalies or deviations from normal behavior within this data, it is essential to extract pertinent features that capture the unique patterns and characteristics of the system being monitored.
(i) Statistical Features:
Mean, Median, and Variance for various network traffic attributes (e.g., packet size, inter-packet time, byte count).
Skewness and Kurtosis to understand the data distribution and identify abnormal behavior.
Correlation to measure linear relationships between traffic attributes.
(ii) Higher-Order Statistical Features:
Entropy to assess the randomness of traffic patterns.
Kullback-Leibler Divergence to detect anomalies in probability distributions.
Higher-Order Moments to capture deviations from normal distribution characteristics.
(iii) Protocol-Based Features:
Protocol Distribution to count occurrences of different network protocols (e.g., HTTP, TCP, UDP) and their ratios in the traffic data.
Packet Length Distribution to understand the distribution of packet lengths for each protocol.
Inter-Arrival Time to calculate time intervals between packets for various protocols.
Feature Selection (Hybrid Optimization Model)
The Hybrid Salp Swarm and Seagull Optimization Algorithm (HSS-SOA) is a nature-inspired optimization algorithm that combines the SSA and SOA to enhance its search and optimization capabilities. The proposed HSS-SOA algorithm helps to identify the most relevant features for the detection task. This step helps reduce dimensionality further and enhance model efficiency. SSA is inspired by the collective movement behavior of salps, marine invertebrates, while SOA is inspired by the hunting behavior of seagulls. In HSSSOA, the algorithm integrates the exploration abilities of SSA, which mimics the salps’ movement in search of food, with the exploitation abilities of SOA, which emulates the seagulls’ hunting strategy for finding prey efficiently. The hybrid algorithm HSSSOA seeks to find equilibrium between exploitation and exploration, allowing it to effectively navigate the search space and converge to optimal solutions. To strike a balance between the accuracy of classification (maximized) and number of selected features (minimized), the fitness function outlined in Eqn. (1) is computed.
(1)
where signifies the classification error rate. Additionally, denotes the size of the chosen subset, while represents the total number of features within the dataset. The parameters and are utilized to indicate the significance of both classification accuracy and subset length. Notably, falls within the range [0, 1], while . These parameters play a crucial role in balancing the importance of classification quality and the length of the selected feature subset.
(i) Salp swarm Optimization
The Salp Swarm Algorithm (SSA) draws inspiration from the collective behavior of salps in the ocean and serves as a highly efficient population-based meta-heuristic approach. Salps exhibit a remarkable social structure where individuals are interconnected to form a chain-like arrangement. Within this structure, salps effectively coordinate their movements and hunting behaviors and can be categorized into two distinct groups: the leader and the followers. The leader, positioned at the forefront of the salp chain, assumes the crucial role of exploring potential food sources. It continually updates its position, treating the food source as the primary objective, thereby guiding the collective movement of the salp swarm toward optimal solutions.
(2)
where the variables and stand for the upper and lower bounds of the dimension within the search space. and denote the current positions in the dimension of the salp leader and the food source, respectively. represents the current iteration number. The parameters and are independent random numbers ranging from 0 to 1. The coefficient plays a crucial role in SSA, balancing the algorithm’s exploitation and exploration capabilities. Its value decreases nonlinearly from 2 to 0 over the course of the iterations, ensuring a dynamic adjustment of the exploration-exploitation trade-off.
(3)
where signifies the maximum number of iterations. Following the update of the leader’s position, the followers adjust their positions accordingly. The mathematical representation of this position update can be expressed as given in Eqn. (4).
(4)
where denotes the position of the follower in the dimension.
(ii) Seagull optimization algorithm
The SOA emulates the natural attack and migration patterns of seagulls, intelligent seabirds found worldwide that feed on various prey like earthworms, reptiles, fish, and insects. These birds exhibit remarkable problem-solving abilities, using tactics like using breadcrumbs to attract fish and mimicking the sound of rain with their feet to bait earthworms. In this simulation, migration and attack behaviors of seagulls are pivotal. Migration represents the search for food sources, while attack behaviors signify seagulls’ interactions with other birds during their oceanic journeys. To ensure smooth migration, the algorithm introduces variable to calculate new positions for seagulls, preventing collisions between adjacent individuals. The search agent’s position is computed by employing Eqn. (5).
(5)
where the variable indicates the current iteration count, represents the agent’s current location, and signifies the mobility pattern of the agent within the designated search area.
(6)
where the variable is implemented to regulate the utilization frequency of , gradually decreasing in a linear fashion from to 0. Once collisions among seagulls are successfully avoided, the search agent then proceeds towards the most optimal neighboring position.
(7)
where denotes the search agent’s the position, directed towards the best-fit search agent . The behavior of is computed using Eqn. (8).
(8)
where represents a randomly generated number falling within the interval of [0, 1]. Upon this calculation, the search agent can adjust its position in relation to the best search agent found in the optimization process. This adaptive updating mechanism ensures continuous refinement of the search strategy, contributing to the algorithm’s effectiveness in finding optimal solutions.
The distance between the current solution and the best-fit solution is determined using Eqn. (9).
(9)
During the attack phase, the seagulls exhibit a spiral motion behavior in the air, encompassing movements in the , , and planes. This behavior involves intricate patterns of flight that seagulls utilize to effectively target and capture their prey.
(10)
(11)
(12)
(13)
where symbolizes the radius of each spiral motion revolution., while is a randomly generated number within the range and denotes the base of the natural logarithm. Constants and are utilized to define the specific shape of the spiral. The updated search agent’s position is determined by Eqn. (14). The flowchart of the proposed HSS-SOA Algorithm is illustrated in Fig. 2.
(14)
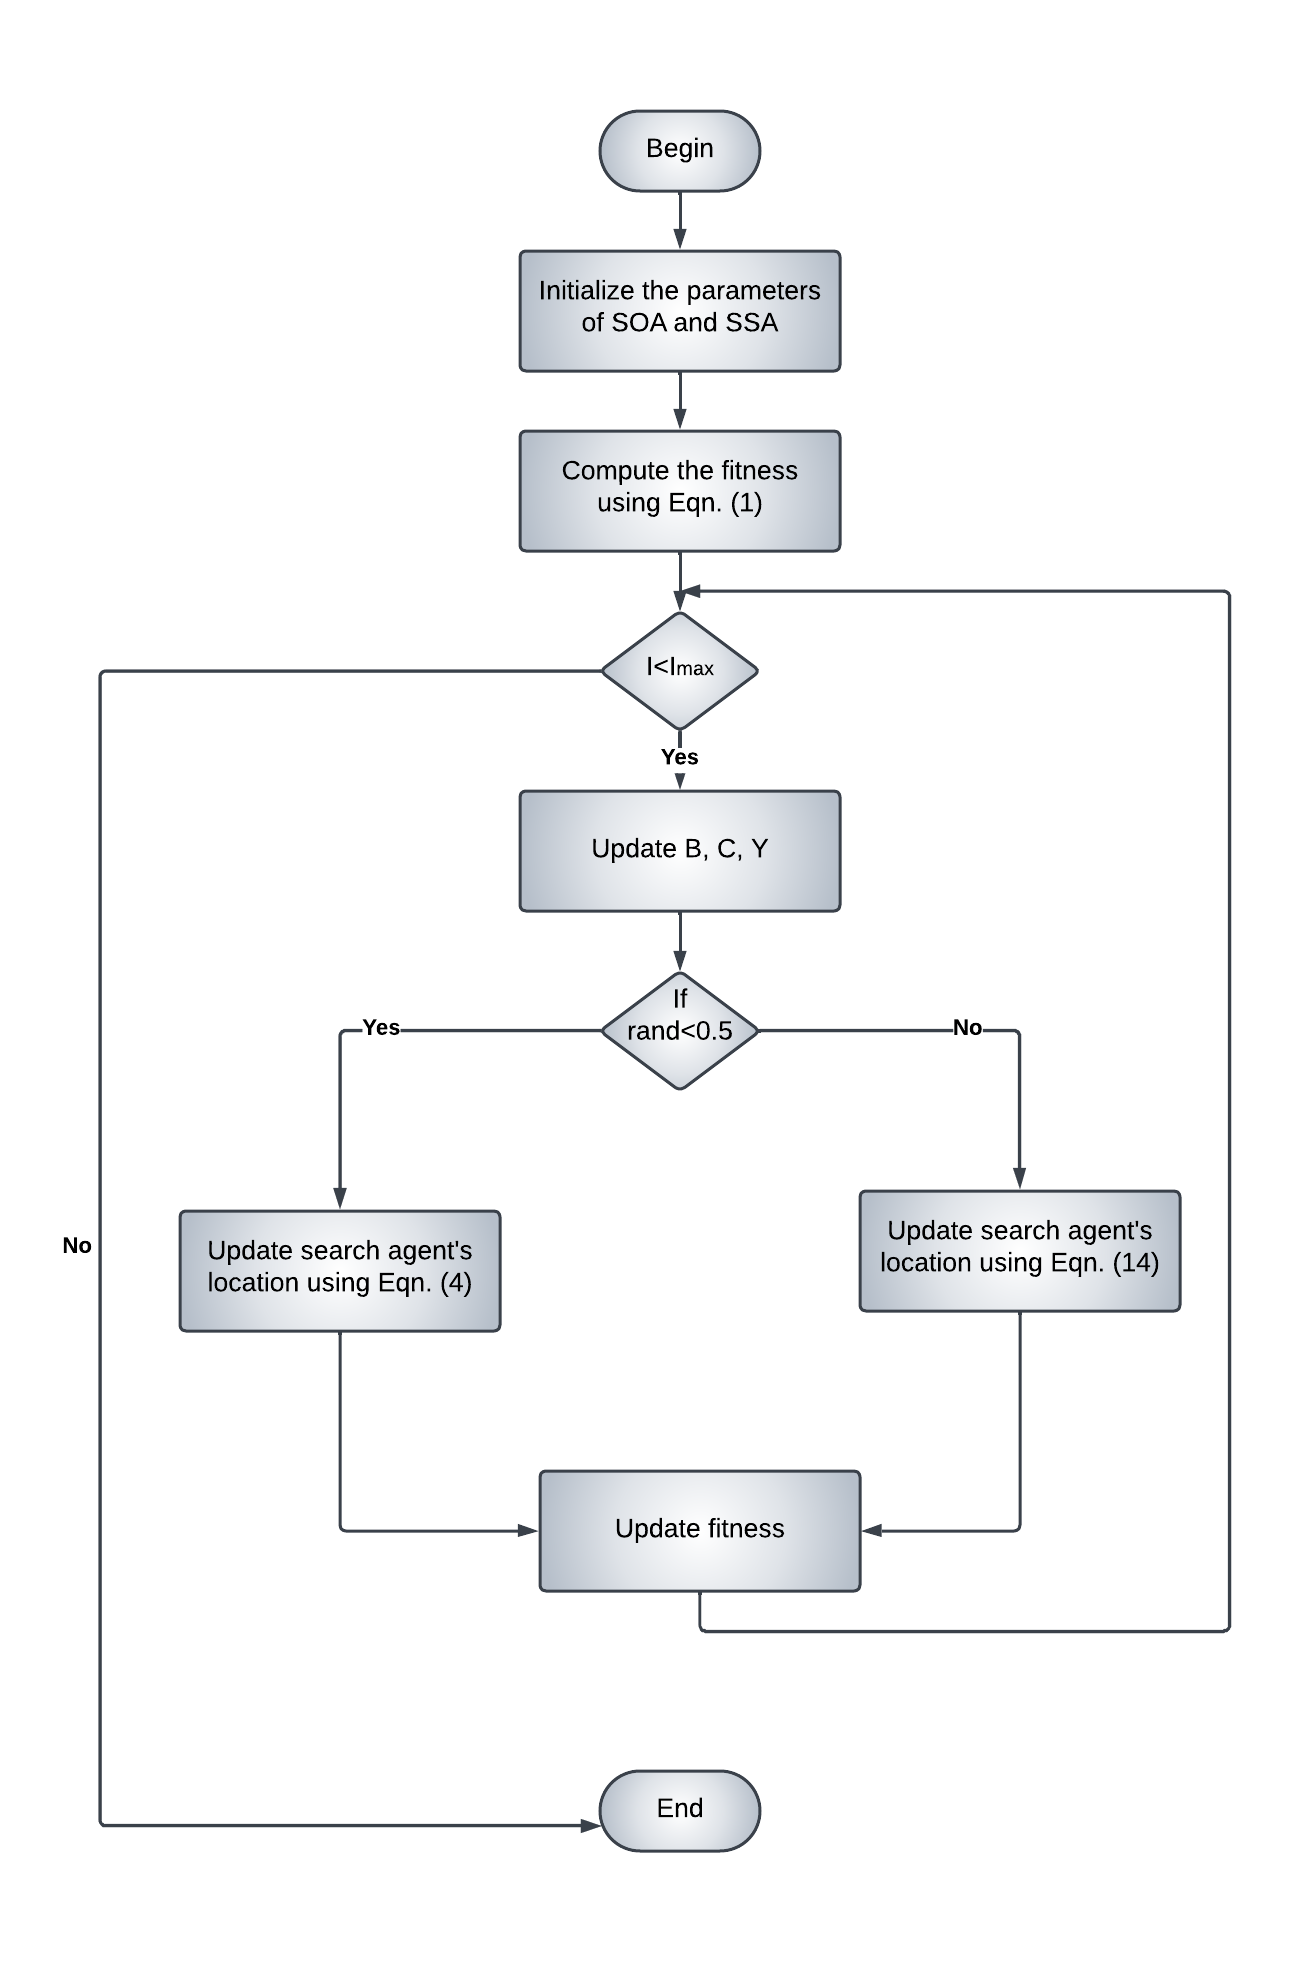
Figure 2: Flowchart of the proposed HSS-SOA Algorithm
Deep Learning-based Classification via GRUResLeNe
Gated Recurrent Unit (GRU)
GRU is instrumental in capturing sequential patterns within the time-series data of IoT networks. Its unique architecture enables it to learn long-range dependencies, making it adept at recognizing intricate temporal patterns in the data streams. By integrating GRU, the model gains the ability to analyze the sequential behavior of IoT devices and identify deviations from normal patterns.
In the GRU layer, the hidden state update equations can be represented as follows:
(15)
(16)
(17)
(18)
where and are the reset and update gates at time respectively. denotes the activation function, is the hidden state, and represents the input. , , and are the corresponding weight matrices.
ResNet (Residual Neural Network)
ResNet’s residual learning concept is invaluable when dealing with deep networks. By mitigating the vanishing gradient problem, ResNet allows the construction of exceptionally deep architectures. The incorporation of ResNet in GRUResLeNet-5 ensures that the model can effectively handle the complexities of IoT data. In ResNet, the basic residual block can be represented as follows:
(19)
where represents the transformation applied by the residual block with weights and signifies the input.
LeNet-5
LeNet-5, a pioneering convolutional neural network, excels in extracting spatial features from images. Its convolutional layers are adept at recognizing patterns within the spatial domain, making it highly suitable for processing sensor data in IoT networks. By integrating LeNet-5, GRUResLeNet-5 gains the capability to discern spatial intricacies in the data, facilitating precise anomaly detection. In LeNet-5, output of the ith convolutional layers are represented as given in Eqn. (20).
(20)
where is the input to the convolutional layer, represents the convolutional kernel of the layer, and is the bias term.
GRUResLeNet-5 Fusion Model
GRU, with its sequential analysis capability, can discern patterns in IoT data over time. It can detect anomalies based on unusual sequences of events, enabling the model to identify deviations from expected temporal behaviors. For instance, it can recognize irregularities in sensor readings, network traffic patterns, or device interactions. Simultaneously, ResNet and LeNet-5 components focus on spatial features. In IoT networks, sensors and devices are often deployed in specific spatial arrangements. ResNet and LeNet-5 can capture spatial relationships and identify anomalies related to unexpected spatial patterns. For example, they can detect unusual clusters of sensor readings or abnormal device placements. By integrating these capabilities into one unified model, the GRUResLeNe Model excels at capturing the nuanced anomalies pervasive in IoT data. It can identify complex anomalies that involve both temporal irregularities (like sudden changes in sensor data trends) and spatial irregularities (like unauthorized device placements or unexpected spatial correlations in data).
Bagging (Bootstrap Aggregating) is a technique used to improve the performance and robustness of models. When applied to the fusion model GRUResLeNe, which combines Gated Recurrent Unit (GRU), ResNet, and LeNet-5 architectures, bagging involves creating multiple instances of the GRUResLeNe model. Each instance is trained on a different subset of the dataset, randomly sampled with replacement (this is the “bootstrap” part of bagging). By training multiple instances on diverse subsets of the data, the models learn different patterns and nuances present in the dataset.
After training these individual models, their predictions are combined to make a final prediction. This combination is done through averaging the predictions from all the models. Bagging reduces overfitting and enhances the ability of the model to generalize well to unseen data. It effectively creates an ensemble model that is more robust and accurate, making it particularly useful when dealing with complex datasets.
Experimental Results and Analysis
In the experimental results analysis, the performance of the proposed GRUResLeNe ensemble model was evaluated on the TON_IoT dataset [27] using a comprehensive set of standard evaluation metrics. The TON_IoT dataset comprises information from realistic, large-scale networks meticulously designed to mimic Industry 4.0 and industrial IoT environments. The datasets were meticulously assembled through parallel processing, capturing both normal operations and cyber-attack incidents within IoT networks. The performance of the proposed GRUResLeNe model is evaluated and compared with the existing methods based on sensitivity, specificity, accuracy, etc. This evaluation is aimed to determine the model’s proficiency in detecting IoT attacks across diverse attack scenarios.
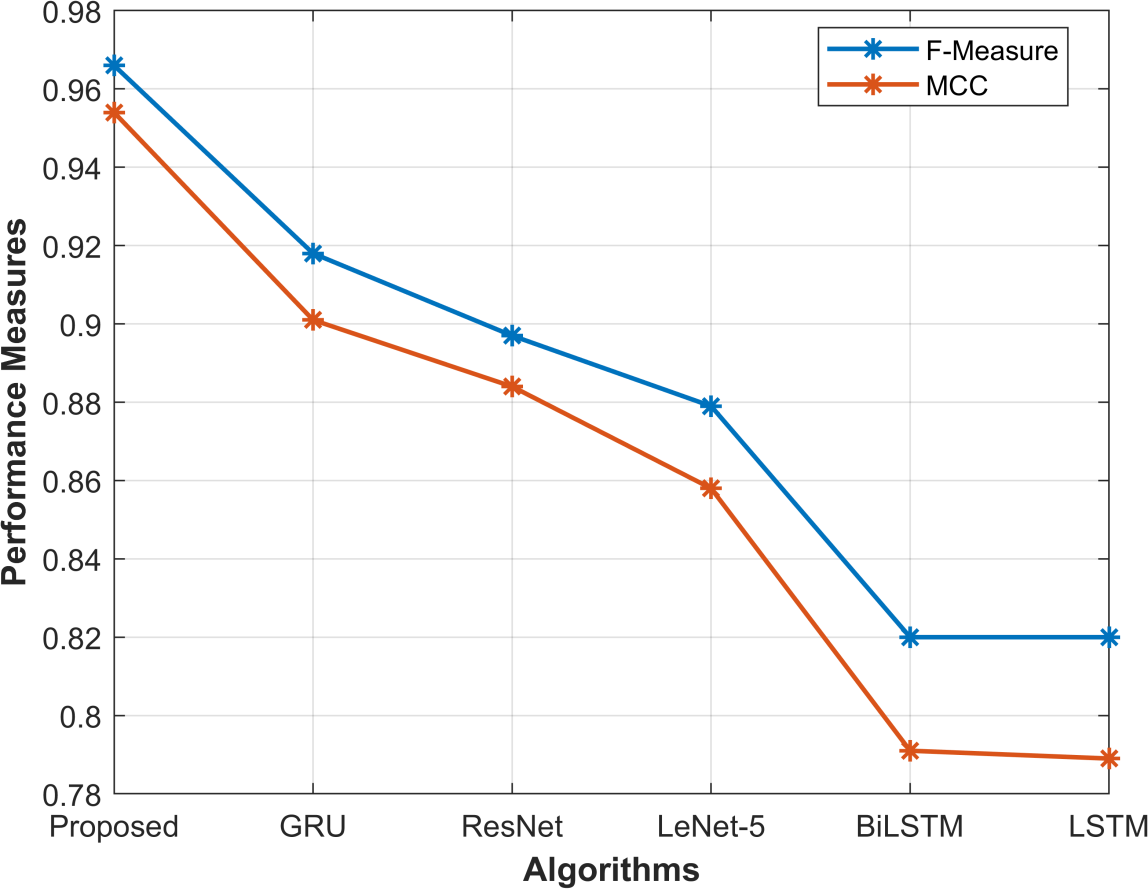
Figure 3: F-measure and MCC analysis
F-measure is a critical metric that balances the trade-off between recall and precision. In Fig. 3, the proposed method achieved an impressive F-measure of 96.6%. This high F-measure indicates that the model excels in both minimizing false positives (precision) and capturing most of the actual positive instances (recall). The robustness displayed by the proposed method in handling both false positives and false negatives underscores its ability to accurately classify anomalies while minimizing misclassifications. This result is particularly significant in IoT networks, where accurately identifying anomalies is crucial for ensuring network security and stability.
MCC is a reliable metric for evaluating the quality of binary classifications. The proposed method achieved an MCC score of 0.954, emphasizing its strong correlation between the predicted and actual classifications. The high MCC score demonstrates the proposed method’s ability to handle the class imbalance often present in anomaly detection scenarios, where normal instances significantly outnumber the anomalies.
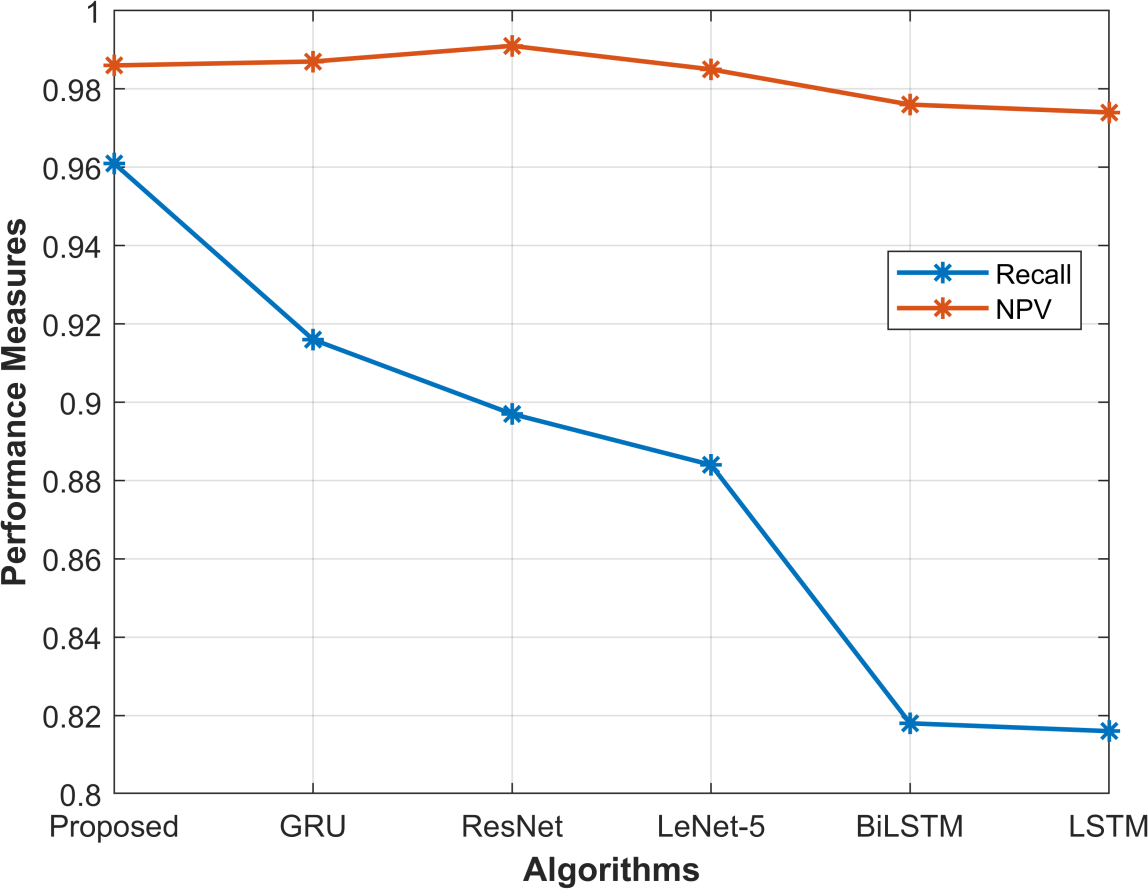
Figure 4: Recall and NPV analysis
Recall, also known as sensitivity, is a vital metric for evaluating the ability of a model to correctly identify all positive instances out of the total actual positives. The proposed method achieved a recall score of 96.1% as shown in Fig. 4. This high recall score indicates that the model effectively captures the majority of actual anomalies in the dataset. In IoT networks, where even a single missed anomaly can lead to significant consequences, a high recall score is crucial. The proposed method’s ability to consistently identify a substantial portion of anomalies showcases its reliability in detecting potentially harmful network behaviors.
Negative Predictive Value (NPV) signifies the fraction of true negative instances accurately predicted by the model among all the predicted negative instances. The proposed method achieved an NPV score of 98.6%. This high NPV demonstrates the model’s proficiency in accurately predicting normal instances, ensuring that non-anomalous behaviors are not misclassified as anomalies. In the context of IoT networks, where most network activities are expected to be normal, a high NPV is essential. The proposed method’s ability to maintain a low rate of false positives ensures that network resources are not wasted investigating false alarms, allowing for efficient utilization of resources.
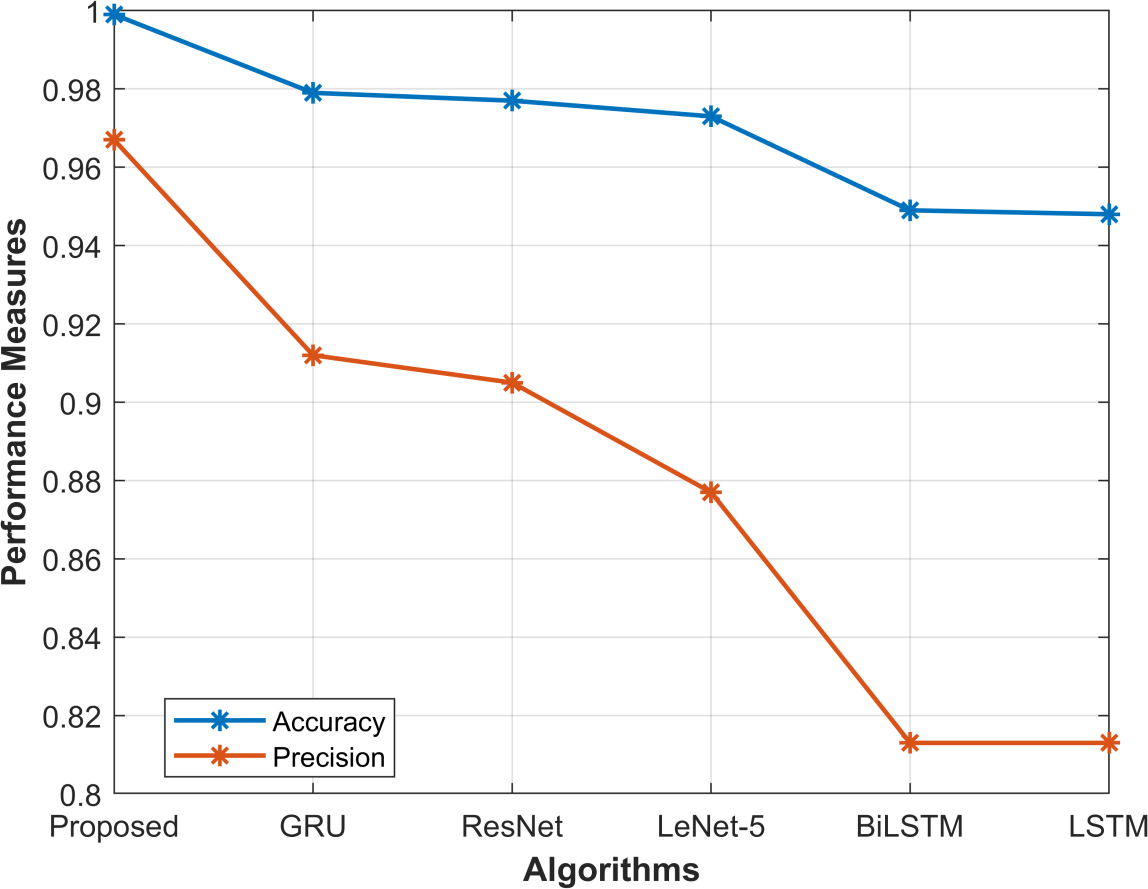
Figure 5: Accuracy and Precision analysis
Fig. 5 provides the results for accuracy and precision analysis. The proposed method achieved an impressive accuracy score of 99.9%. This means that the model accurately classified 99.9% of all instances, highlighting its robustness in handling diverse IoT network data. Precision, on the other hand, evaluates the model’s ability to correctly classify positive instances out of all instances predicted as positive. The proposed method demonstrated a precision score of 96.7%. This means that when the model predicts an anomaly, it is correct 96.7% of the time. High precision is crucial in IoT networks to minimize false alarms and ensure that resources are utilized efficiently for investigating genuine anomalies. Comparatively, the existing methods, GRU, ResNet, LeNet-5, BiLSTM, and LSTM, achieved accuracy scores of 97.9%, 97.7%, 97.3%, 94.9%, and 94.8% respectively. In terms of precision, these methods achieved scores of 91.2%, 90.5%, 87.7%, 81.3%, and 81.3% respectively.
The proposed method’s significantly higher accuracy and precision scores highlight its superior performance compared to existing methods. The higher accuracy showcases the model’s overall correctness, while the superior precision underscores its ability to accurately pinpoint anomalies. These results indicate that the proposed method not only provides highly accurate predictions but also excels in minimizing false positives, making it a robust and reliable choice for anomaly detection in IoT networks.
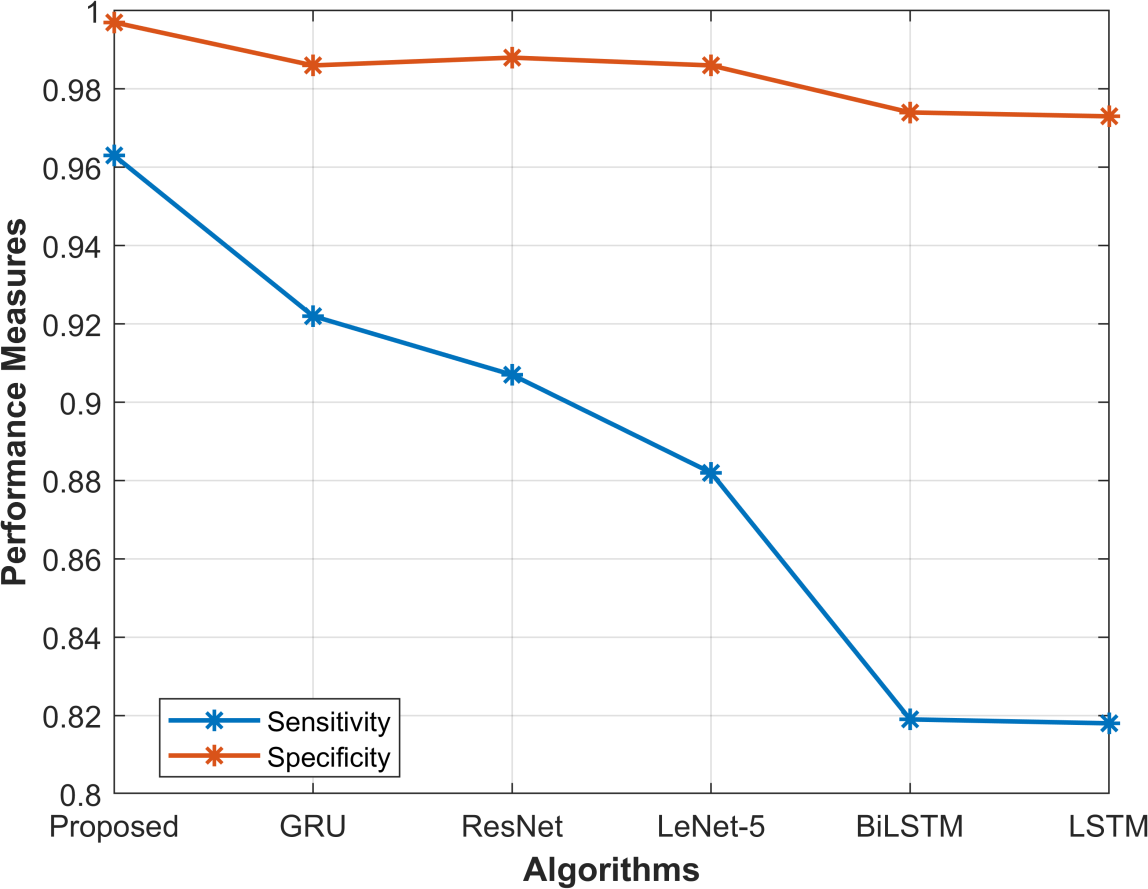
Figure 6: Sensitivity and Specificity analysis
In the evaluation of anomaly detection methods, sensitivity and specificity play pivotal roles. Sensitivity measures the ability to identify actual positives correctly, while specificity gauges the aptitude to discern actual negatives accurately. From Fig. 6, it can be observed that the proposed method outperforms other techniques with a sensitivity score of 96.3%, indicating its exceptional capacity to detect genuine anomalies. Simultaneously, its high specificity score of 99.7% showcases its precision in recognizing normal instances. In contrast, existing methods like GRU, ResNet, LeNet-5, BiLSTM, and LSTM, although competent, show slightly lower sensitivity scores of 92.2%, 90.7%, 88.2%, 81.9%, and 81.8%, respectively. Likewise, their specificity scores range from 97.3% to 98.8%. The proposed method’s superior performance in both sensitivity and specificity underscores its robustness in correctly identifying anomalies while maintaining accuracy in classifying non-anomalous instances.
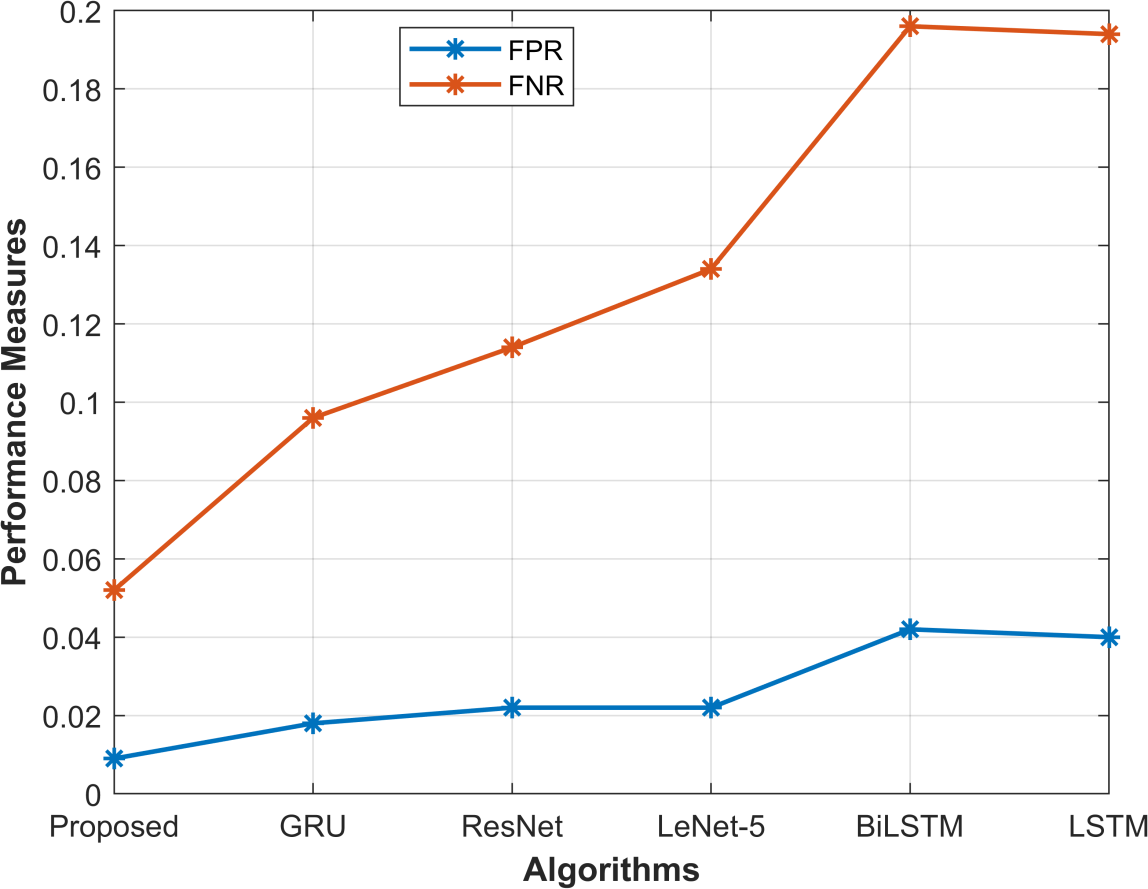
Figure 7: FPR and FNR analysis
Fig. 7 gives the FPR and FNR analysis for the proposed method. FPR calculates the ratio of incorrectly flagged normal instances to the total actual negatives, indicating the rate of false alarms. FNR, on the other hand, measures the ratio of wrongly identified anomalies to the total actual positives, highlighting missed detections. The proposed method show exceptional performance with a remarkably low FPR of 0.9% and an impressively low FNR of 5.2%. In contrast, existing methods exhibit higher FPRs ranging from 1.8% to 4.2% and FNRs ranging from 9.6% to 19.6%. This disparity emphasizes the proposed method’s ability to minimize false alarms while effectively capturing anomalies, making it highly reliable for identifying genuine threats in IoT networks. Table 1 provides the comparative results obtained for the proposed and the existing methods.
Table 1: Comparative analysis with existing methods
Method /Metric | Sen | Spec | Acc | Precision | Recall | F-Measure | NPV | FPR | FNR | MCC |
Proposed | 0.963 | 0.997 | 0.999 | 0.967 | 0.961 | 0.966 | 0.986 | 0.009 | 0.052 | 0.954 |
GRU | 0.922 | 0.986 | 0.979 | 0.912 | 0.916 | 0.918 | 0.987 | 0.018 | 0.096 | 0.901 |
ResNet | 0.907 | 0.988 | 0.977 | 0.905 | 0.897 | 0.897 | 0.991 | 0.022 | 0.114 | 0.884 |
LeNet-5 | 0.882 | 0.986 | 0.973 | 0.877 | 0.884 | 0.879 | 0.985 | 0.022 | 0.134 | 0.858 |
BiLSTM | 0.819 | 0.974 | 0.949 | 0.813 | 0.818 | 0.82 | 0.976 | 0.042 | 0.196 | 0.791 |
LSTM | 0.818 | 0.973 | 0.948 | 0.813 | 0.816 | 0.82 | 0.974 | 0.04 | 0.194 | 0.789 |
Conclusions
The proposed anomaly detection method for IoT networks showcased remarkable effectiveness, outperforming existing techniques across various crucial metrics. Its superior performance, particularly in terms of accuracy, precision, recall, and F-measure, signifies its robustness in identifying anomalies accurately and minimizing false negatives. The fusion of GRU, ResNet, and LeNet-5 models, coupled with advanced techniques like Improved Linear Discriminant Analysis (LDA), has proven to be an efficient combination. In the future, further enhancements can be explored, such as integrating deep reinforcement learning for dynamic anomaly adaptation and leveraging federated learning techniques to ensure privacy in distributed IoT environments. Additionally, exploring the applicability of the proposed method in real-time scenarios and across diverse IoT device types would be valuable for its practical implementation and validation.
References
Chatterjee A, Ahmed BS. IoT anomaly detection methods and applications: A survey. Internet of Things. 2022 Aug 1;19:100568.
Cook AA, Mısırlı G, Fan Z. Anomaly detection for IoT time-series data: A survey. IEEE Internet of Things Journal. 2019 Dec 6;7(7):6481-94.
Sahu NK, Mukherjee I. Machine learning based anomaly detection for IoT network:(Anomaly detection in IoT network). In2020 4th International Conference on Trends in Electronics and Informatics (ICOEI)(48184) 2020 Jun 15 (pp. 787-794). IEEE.
Jáquez AD, Herrera MT, Celestino AE, Ramírez EN, Cruz DA. Extension of LoRa Coverage and Integration of an Unsupervised Anomaly Detection Algorithm in an IoT Water Quality Monitoring System. Water. 2023 Apr 1;15(7):1351.
Nguyen TA, He J, Le LT, Bao W, Tran NH. Federated pca on grassmann manifold for anomaly detection in IoT networks. InIEEE INFOCOM 2023-IEEE Conference on Computer Communications 2023 May 17 (pp. 1-10). IEEE.
Mukherjee I, Sahu NK, Sahana SK. Simulation and modeling for anomaly detection in IoT network using machine learning. International Journal of Wireless Information Networks. 2023 Jun;30(2):173-89.
Sharma DK, Dhankhar T, Agrawal G, Singh SK, Gupta D, Nebhen J, Razzak I. Anomaly detection framework to prevent DDoS attack in fog empowered IoT networks. Ad Hoc Networks. 2021 Oct 1;121:102603.
DeMedeiros K, Hendawi A, Alvarez M. A survey of AI-based anomaly detection in IoT and sensor networks. Sensors. 2023 Jan 25;23(3):1352.
Huč A, Trček D. Anomaly detection in IoT networks: From architectures to machine learning transparency. IEEE Access. 2021 Apr 16;9:60607-16.
Martins I, Resende JS, Sousa PR, Silva S, Antunes L, Gama J. Host-based IDS: A review and open issues of an anomaly detection system in IoT. Future Generation Computer Systems. 2022 Aug 1;133:95-113.
Ullah I, Mahmoud QH. A framework for anomaly detection in IoT networks using conditional generative adversarial networks. IEEE Access. 2021 Dec 2;9:165907-31.
Cauteruccio F, Cinelli L, Corradini E, Terracina G, Ursino D, Virgili L, Savaglio C, Liotta A, Fortino G. A framework for anomaly detection and classification in Multiple IoT scenarios. Future Generation Computer Systems. 2021 Jan 1;114:322-35.
Ahmad Z, Shahid Khan A, Nisar K, Haider I, Hassan R, Haque MR, Tarmizi S, Rodrigues JJ. Anomaly detection using deep neural network for IoT architecture. Applied Sciences. 2021 Jul 30;11(15):7050.
Diro A, Chilamkurti N, Nguyen VD, Heyne W. A comprehensive study of anomaly detection schemes in IoT networks using machine learning algorithms. Sensors. 2021 Dec 13;21(24):8320.
Protogerou A, Papadopoulos S, Drosou A, Tzovaras D, Refanidis I. A graph neural network method for distributed anomaly detection in IoT. Evolving Systems. 2021 Mar;12:19-36.
Ullah I, Mahmoud QH. Design and development of RNN anomaly detection model for IoT networks. IEEE Access. 2022 May 18;10:62722-50.
Ullah I, Mahmoud QH. Design and development of a deep learning-based model for anomaly detection in IoT networks. IEEE Access. 2021 Jul 1;9:103906-26.
Sivapalan G, Nundy KK, Dev S, Cardiff B, John D. ANNet: a lightweight neural network for ECG anomaly detection in IoT edge sensors. IEEE Transactions on Biomedical Circuits and Systems. 2022 Jan 4;16(1):24-35.
Xu H, Sun Z, Cao Y, Bilal H. A data-driven approach for intrusion and anomaly detection using automated machine learning for the Internet of Things. Soft Computing. 2023 Jul 29:1-3.
Sáez-de-Cámara X, Flores JL, Arellano C, Urbieta A, Zurutuza U. Clustered federated learning architecture for network anomaly detection in large scale heterogeneous IoT networks. Computers & Security. 2023 Aug 1;131:103299.
Ahmad Z, Khan AS, Zen K, Ahmad F. MS‐ADS: Multistage Spectrogram image‐based Anomaly Detection System for IoT security. Transactions on Emerging Telecommunications Technologies. 2023:e4810.
AbuAlghanam O, Alazzam H, Alhenawi EA, Qatawneh M, Adwan O. Fusion-based anomaly detection system using modified isolation forest for internet of things. Journal of Ambient Intelligence and Humanized Computing. 2023 Jan;14(1):131-45.
Shao W, Wei Y, Rajapaksha P, Li D, Luo Z, Crespi N. Low-latency Dimensional Expansion and Anomaly Detection empowered Secure IoT Network. IEEE Transactions on Network and Service Management. 2023 Feb 21(99):1-1.
Zeng F, Chen M, Qian C, Wang Y, Zhou Y, Tang W. Multivariate time series anomaly detection with adversarial transformer architecture in the Internet of Things. Future Generation Computer Systems. 2023 Jul 1;144:244-55.
Kethineni K, Gera P. Iot-Based Privacy-Preserving Anomaly Detection Model for Smart Agriculture. Systems. 2023 Jun 13;11(6):304.
Halder S, Newe T. Radio fingerprinting for anomaly detection using federated learning in LoRa-enabled Industrial Internet of Things. Future Generation Computer Systems. 2023 Jun 1;143:322-36.
Moustafa N. A new distributed architecture for evaluating AI-based security systems at the edge: Network TON_IoT datasets. Sustainable Cities and Society. 2021 Sep 1;72:102994.
Cite This Work
To export a reference to this article please select a referencing stye below:

Academic Master Education Team is a group of academic editors and subject specialists responsible for producing structured, research-backed essays across multiple disciplines. Each article is developed following Academic Master’s Editorial Policy and supported by credible academic references. The team ensures clarity, citation accuracy, and adherence to ethical academic writing standards
Content reviewed under Academic Master Editorial Policy.



