
Abstract
EffiLensRNN is a bespoke deep learning model designed to bolster network attack detection. Its data collection strategy involves harnessing information from customized sensors, intrusion detection systems, and honeypots. Preprocessing encompasses data cleaning and the implementation of Interquartile Range (IQR) techniques. For feature extraction, the model employs domain-specific knowledge-based features and statistical metrics, including mean, standard deviation, and percentiles for various network metrics. Furthermore, it identifies intricate patterns and correlations among data points. The core of EffiLensRNN integrates an Efficient Net backbone for spatial feature extraction, followed by a custom Lens Net module tailored to the specific computer vision task at hand. Recurrent Neural Networks (RNNs) capture temporal dependencies in the data, facilitating effective analysis of sequential information. Finally, the model’s output layer is task-specific, adapting to various applications like attack classification. EffiLensRNN thus presents a comprehensive solution for advanced network attack detection. The experimental values are reported as supplied; the evaluation limitations discussed below restrict their interpretation.
Keywords: Network attack Detection, Interquartile Range, Efficient Net, Rnn, percentiles.
Introduction
In the presence of extensive Internet data and ever-changing network attacks, conventional network security technology has failed to effectively tackle the current severe network security situation. Therefore, it is imperative to conduct research on intrusion detection technology with an active defence function. In the area of network security systems, intrusion detection serves as an indispensable component, rectifying the insufficiencies of conventional network security maintenance practices. It is an integral aspect of a network security system and significantly compensates for the inadequacies of traditional network security maintenance techniques. The area of network security has evolved into an indispensable research domain, primarily attributable to the recent advancements in information and digital technologies over the last decade. To safeguard the network and its associated assets residing within cyberspace, a diverse range of tools including firewalls, virus protection, and intrusion detection systems are utilized. The attack detection approach that offers the necessary security by continuously scanning internet usage for hostile and suspicious activity is the FFO-PNN attack detection system [1,2].
As a result of this development, there has been a notable enhancement in both the efficacy and proficiency of said systems. Consequently, the systems’ effectiveness and performance have undergone substantial amelioration. In light of the challenges posed by network complexity and attack diversification, scientific researchers are pursuing avenues of intellectualization and distribution. However, existing solutions based on machine learning models face several common issues. Firstly, these models often produce a high false positive rate with a wide range of attacks. Secondly, the models are not generalizable because previous studies only used one dataset to report their machine learning model’s performance. Thirdly, the models studied thus far have not been exposed to the massive network traffic present today. Finally, the solutions require the ability to adapt to the rapidly increasing size, speed, and dynamics of today’s high-speed networks. NIDS plays a critical role in identifying malicious activities within computer networks by monitoring network traffic. They help detect malicious activities in computer networks by monitoring traffic traveling through the network. A NIDS alerts the network administrator when an attack is detected. Effective network security measures are crucial to protect valuable information and business reputation. NIDS can complement traditional security tools to protect against attacks. [3][4][5].
Various forms of attacks exist, such as port scanning, information probing, virus and worm injection, and DoS. Intrusion detection systems are typically categorized as signature-based, anomaly-based, or a combination of the two. Signature-based systems monitor system usage patterns and compare them against known misuse signatures, while anomaly-based systems use normal behavior vs. intrusion to classify activity. Security events must be monitored and detected to maintain confidentiality, integrity, availability, and privacy. IDSs offer hardware and software services to secure data, analyze malicious activity, and report to management systems. Intrusion detection systems are categorized into NIDS and HIDS based on deployment location. The escalating utilization of Cloud Computing has resulted in a rise in system attacks, thereby making data security a crucial concern. IDSs provide software and hardware services to secure stored data, analyze malicious activity, and report to management systems [6-8]. Due to the integration and fast development of industry informatization, industrial networks are frequently targeted by increasingly diverse and complex illegal intrusion attacks [9]. Several severe consequences have been reported, including the Stuxnet virus which threatened essential computing facilities, causing severe damage to Iran’s nuclear power equipment [10].
The HawkEye RAT has also been used to steal core system access information, while malicious attacks caused a power outage in Ukraine. In 2017, the Wanna Cry virus affected many Chinese industrial companies [11]. The technological evolution has led to a network expansion. Data is shared among diverse nodes. Security is challenging due to new attacks. Various methods like machine learning can detect intrusions. IDS can learn to detect attacks accurately. Support Vector Machine (SVM), Random Forest (RF), Decision Trees (DT), and Naïve Bayes (NB) represent a subset of the many machine learning algorithms that are commonly employed to detect and classify intrusions [12,13,14]. ML algorithms are less efficient than deep learning due to longer training time and higher false positives, with dataset size and dimensionality impacting training complexity [15]. Deep learning improves intrusion detection outcomes and includes RNN, AE, and DBN approaches with network NIDS. DL models with more hidden layers are more effective at learning significant features from the dataset to generate output [16]. NIDS uses AI techniques such as ML and DL to enhance the detection of harmful actions. Machine learning-based intrusion detection systems necessitate feature engineering, while deep learning-based intrusion detection systems do not require it. Both ML and DL are popular in network security due to powerful GPUs. Machine learning intrusion detection systems need feature engineering, but deep learning systems do not. Proposed solutions using ML and DL have challenges due to increased network traffic and security threats. Firewalls, virus defense, data encryption, intrusion detection, and access control technologies are essential for network security prevention and protection [17][18].
The main contributions of this research are as follows:
To customized preprocessing is carried out by data-cleaning and IQR.
Deep learning-based features are extracted by the statistical features like mean, variance, Standard deviation, Kurtosis, and percentiles
To identify the correlation between two data points correlation is used.
To customize the attack detection, EffilensRNN is used.
This research is divided into five sections: section 1 explains the introduction; section 2 reviews prior work; section 3 discusses suggested approaches; section 4 discusses results and conclusions; and section 5 defines the research’s overall conclusion.
Literature Review
In 2023, Madhu et al. [19] presented A new deep learning framework called DIDS to revolutionize the industry. By incorporating the forecasting of unidentified threats, the DIDS model overcomes the challenges raised by false alarm rates and computational complexity in large-scale networks. A contrast with traditional algorithms has uncovered that methodology was effective in identifying attacks at an early stage. Moreover, an impressive 99% precision in attack detection has been accomplished while significantly reducing the computing time.
In 2022, Ullah et al. [20] introduced the employment of Apache web servers for the purpose of intrusion detection system. The methodology entails the utilization of the Naive Bayes machine learning algorithm for training purposes. The training dataset was obtained from IEEE. The proposed work solely conducts intrusion detection via web server log analysis utilizing the Apache web base. The system’s cross-validation accuracy was noted at 98.6%. The precision rate of the proposed model in this research was recorded at 98.57%.
In 2020, Sarker et al. [21] developed a new security model called IntruDTree using machine learning. The effectiveness of IntruDTree was tested through experiments on cybersecurity datasets. The results were compared to traditional machine learning methods. Future work involves testing IntruDTree on larger datasets with more security features in IoT security services. The effectiveness will also be measured at the application level in cybersecurity.
In 2022, Otoum et al. [22] delivered a newly developed intrusion detection system (IDS) that utilized deep learning techniques to identify critical anomalies within the continually expanding IoT networks. The DL-IDS system utilized spider monkey optimization (SMO) technique to extract the most pertinent features of the dataset. The study of NSL-KDD dataset revealed that DL-IDS had high levels of accuracy, precision, recall, and F1-score with values of 99.02%, 99.38%, and 98.29% respectively.
In 2017, Shitharth et al. [23] explained an improved Intrusion Weighted Particle based Cuckoo Search Optimization (IWP-CSO) and HNA-NN algorithms for the purpose of detecting intrusions in a SCADA network. The principal objective of this investigation was to enhance the optimization of intrusions’ identification and categorization in a SCADA network. The proposed IWP-CSO algorithm was utilized to optimize features and select the best attributes. The proposed system’s efficacy was determined by analyzing its sensitivity, specificity, precision, recall, accuracy, Jaccard, Dice and false detection rate through experimental results.
In 2020, Nguyen and Kim [24] developed a new algorithm for identifying network intrusions that utilized a genetic algorithm and fuzzy C-means clustering to choose an improved feature subset. The CNN model was used to extract deep features, which were then validated with a BG classifier using 5-fold CV. The successful validation results suggest that the proposed algorithm could be suitable for practical NIDS applications.
In 2021, Wang et al. [25] proposed an intrusion detection algorithm, ID-IE-CNN, based on an Image Enhanced Convolutional Neural Network. The data underwent equalization via oversampling technique and was then converted from one-dimensional to two-dimensional image data. The Tanh function was introduced as an activation function to fit nonlinear data, and the generalization ability of the prediction model was improved by the Dropout method. The Softmax classifier was used to predict the behavior of intrusion detection. The KDDCup99 data set was used for comparison with other algorithms, and ID-IE-CNN showed superiority in both binary and multi-classification performance.
In 2021, Kan et al. [26] presented a novel algorithm, namely APSO-CNN, and applies it successfully to detect multi-type attacks that were launched by zombie hosts infected with zombie viruses. Moreover, temporal differences were noted in the various stages of the attack. The efficacy of the APSO-CNN detection algorithm was substantiated by comparing it with three widely recognized detection algorithms. Moreover, the academic community should explore various promising avenues for future inquiry.
In 2019, Khan et al. [27] introduced a novel deep learning structure for detecting network intrusions. It can effectively classify and learn from unlabelled data. The study discovered that a new deep learning structure using stacked auto-encoder and soft-max classifier outperforms current techniques with recognition rates of 99.996% and 89.134%. This paper provides an innovative deep learning architecture for network intrusion detection, with the potential to set a new benchmark for identification rates in DL and network security research.
In 2021, Haghighat and Li [28] proposed a new voting-based deep learning framework (VNN) to utilize various deep learning structures. VNN can aggregate the best models to produce more accurate and robust results, thus aiding security specialists in detecting complex attacks. Experimental results on KDDCUP’99 and CTU-13 datasets showed that the voting procedure increased system performance and reduced false alarms by up to 75% compared to original deep learning models, including DNN, CNN, LSTM, and GRU. Table 1 Shown in below.
PROBLEM STATEMENT
Table 1: Research gaps from the existing works
Author | Aim | Findings |
Madhu et al. [19] | A deep learning model called DIDS is suggested for identifying intrusions in IoT networks in this research. | The technique used here was the DL. The DIDS model predicts unknown attacks to manage computational overhead in large networks and improve throughput with a low false alarm rate. In the future, the proposed model needs to be compared with other intrusion detection models for effectiveness and performance evaluation. |
Ullah et al. [20] | Presented an intelligent intrusion detection system for Apache web servers. | The technique used was the Naïve Bayes algorithm. The performance of accuracy was 98.6%. The system’s training dataset may not represent all network traffic scenarios and as a result, its performance may fluctuate when applied to other datasets or real-world situations. In the future, Additional research could be carried out to investigate the efficacy of alternative machine-learning algorithms or blended techniques for detecting intrusions in network systems and web servers. |
Sarker et al. [21] | A machine learning-based model named IntruDTree can identify cyber-attacks or anomalies in a network. | The technique utilized was ML. The effectiveness of the model was high for predicting unseen test cases and it also reduces computational requirements. In the future, proposes evaluating the IntruDTree model’s efficacy in IoT security services through larger datasets with more security features and measuring its application-level effectiveness in cybersecurity. |
Otoum et al. [22] | Proposed a novel DL-IDS to identify security threats in IoT settings using deep learning techniques. | DL was the technique utilized in this paper. DL-IDS showcases remarkable accuracy, precision, recall, and F-score. However, training the deep learning model may require significant data, a challenge in IoT scenarios with limited data collection. |
Shitharth et al. [23] | Presented an enhanced approach to identifying and classifying intrusions in SCADA networks. | The proposed paper presented the IWP-CSO algorithm for optimizing features used a weighted particle approach within the Cuckoo Search Optimization technique. The proposed system improves intrusion detection by reducing false positives and negatives, recognizing encrypted data, and identifying both external and internal intrusions. In the future, the system can identify and categorize additional intrusions in SCADA networks. It can also be enhanced to decrease complexity and enhance efficiency. |
Nguyen and Kim [24] | Presented a new algorithm for NIDS using GA-based exhaustive search and FCM for feature selection. | The proposed paper presented the IWP-CSO algorithm for optimizing features using a weighted particle approach within the Cuckoo Search Optimization technique. In the future, more research is required to assess the algorithm’s efficacy in various situations and detect any constraints. Furthermore, upcoming investigations could investigate alternative machine learning approaches or feature selection methods to enhance the algorithm’s effectiveness. |
Wang et al. [25] | Presented an algorithm for intrusion detection that utilizes an image enhancement convolutional neural network. | The paper presented an ID algorithm used IE-CNN. The ID-IE-CNN algorithm enhanced intrusion detection by overcoming the constraints of standard machine learning algorithms in handling high-dimensionality, nonlinearity, and intrusion data imbalance. |
Kan et al. [26] | Presented a new method for precisely identifying different types of IoT network intrusion attacks originating from zombie hosts controlled by attackers. | The paper employed APSO-CNN. The APSO-CNN method detects IoT network intrusions by zombie hosts with reliability and effectiveness. In the future, analysing approaches to improve the PSO algorithm’s performance and decrease its computational burden. Examining a fitting forecasting model for the progression of network attack phases. |
Khan et al. [27] | Presented a new method for precisely identifying different types of IoT network intrusion attacks originating from zombie hosts controlled by attackers. | The proposed model proved to be more effective than previous methodologies with recognition rates of 99.996% and 89.134% for the KDD99 and UNSW-NB15 datasets. In the future, the deep learning approach will integrate with new reinforcement and multi-task learning algorithms to optimize the network intrusion detection system. |
Haghighat and Li [28] | Presented VNN, a new voting-based deep learning framework that combines the best models from different aspects of data and structures for more accurate and robust results. | The paper utilized a new deep learning framework called VNN, based on voting. VNN aids in identifying complex attacks, leading to a reduction of false alarms by 75% when compared to deep learning models. The VNN framework’s ability to detect intrusions may be impacted by the dataset and type of attack, making it unsuitable for certain systems. In future work, A heuristic function is being developed to avoid creating fewer effective models beforehand. |
Proposed Methodology
In proposed methodology, known as EffiLensRNN, presents an innovative approach to network attack detection. The process begins with comprehensive data collection, where we gather network traffic data from customized sensors, intrusion detection systems (IDS), and honeypots, designed to capture various attack types. We emphasize data quality through customized preprocessing, incorporating data cleaning and Interquartile Range (IQR) techniques. For feature extraction, our model utilizes a combination of domain-specific knowledge-based features and statistical metrics, identifying patterns and correlations between data points. The core of EffiLensRNN integrates an Efficient Net backbone for spatial feature extraction, followed by a customizable LensNet module for specific computer vision tasks. RNN integration captures temporal dependencies, and task-specific output layers tailor the model to different attack detection scenarios, making EffiLensRNN a comprehensive and adaptable solution. Figure 1 Shown in below.
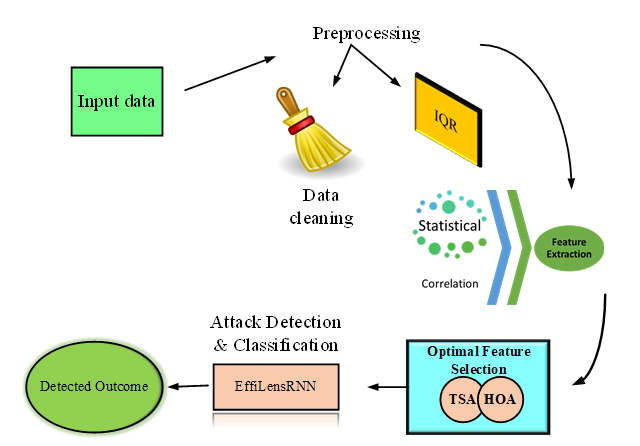
Figure 1: Flow diagram of the Proposed model
Data Collection
In this research, is to Collect network traffic data from customized sensors and devices, including specialized intrusion detection systems (IDS) and honeypots designed to capture various types of attack traffic.
Customized Preprocessing
In this research, the customized preprocessing is carried out by data cleaning and IQR.
Data cleaning
Data cleaning is the process of correcting or deleting inaccurate, corrupted, improperly formatted, duplicate, or insufficient data from a dataset. There are several ways for data to be duplicated or incorrectly labelled when integrating various data sources.
Interquartile Range
The variation between the third and first quartiles is defined by the interquartile range. The numbers that partition the entire series into four equal sections are referred to as quartiles. There are therefore 3 quartiles. The lower quartile is symbolized by the letter Q1, the higher quartile by the letter Q2, and the middle quartile by the letter Q3. Because of this, the upper quartile less than the lower quartile equals the interquartile range.
Interquartile range=upper quartile-lower quartile=q3-q1 (1)
Customized Deep Learning – based Feature extraction
In order to obtain statistical features, tailored feature extraction in deep learning incorporates domain-specific information. When applied to network measurements like packet counts, data transfer speeds, and connection lengths, they include characteristics like average, standard deviation, variance, skewness, kurtosis, and percentiles. It also investigates data linkages to find distinctive patterns and relationships among different data items.
Statistical based features
Mean
The arithmetic average of all the terms is the most typical formulation for the mean of a statistical distribution containing a discrete random variable. Divide the result by the total number of terms after adding up all the term values. The expected value, commonly referred to as the mean of a statistical distribution with a continuous random variable, is calculated by integrating the product of the variable’s probability specified by the distribution.
X̅=(∑(XI))/(n) (2)
Where X̅ is the mean; n is the total frequency
Standard deviation
The square root of the variance is used to calculate the standard deviation, a statistic that gauges a dataset’s dispersion from its mean. The variation from the mean of each data point is used to determine the standard deviation, which is equal to the square root of variance.
Satndard deviation=√(∑I=1N(((xI-x̅)2)/(N-1))) (3)
As per Eq (3). xI is the value of the ith point in the data set; x̅is the mean value and N is the number of data points in the dataset
Variance
It can determine how widely the data points deviate from the mean using variance. It can also be regarded as a metric that indicates the degree of dispersion of the data points. Its symbol is 2 and its formula is
σ2=∑I=1N(((xI-μ)2)/(N)) (4)
Here, N denotes the sample size, xI denotes the Ith data point, and denotes the mean. The standard deviation is calculated as the square root of variance.
Kurtosis
Kurtosis is a statistical measure used to characterise how much data clusters in a frequency distribution’s tails or peak. The tails are the endpoints of the distribution, while the peak is its highest point.
β2=(((e(X)4)/((e(X))2))-3 (5)
Where e is the expected value of X.
Percentiles
A percentile is a score that compares a specific score to the scores of the other members of a group. It displays the proportion of other scores that a given score outperformed.
p=((N)/(n))*100 (6)
Where N is the ordinal rank of the given value, n is the number of values in the dataset and p is the percentile.
Correlation
A procedure for determining the connections between two variables is referred to as correlation.
ρXY=(con(RX,RY))/(σX,σY) (7)
HereRX,RY are the random variables; con is the covarinace; σX,σY are th population standard deviation.
Optimal Feature Selection by Customized hybrid optimization algorithm
Tunicate Swarm Algorithm (TSA)
TSA is a straightforward meta-heuristic optimizer that draws inspiration from how marine tunicates navigate and forage using their jet propulsion systems. The shape of this animal is millimeter-scale. Tunicate is capable of locating marine food resources.
The provided search space lacks information about the source of food. To achieve jet propulsion, a tunicate needs to fulfill three essential criteria: it must avoid collisions with other tunicates within the search area, adhere to the correct path to reach the optimal location, and position itself as close as possible to the most effective searching agent. In this context, they serve as the candidate solutions in the TSA, aiming to locate the highest-quality food source or attain the best value for the objective function. During each iteration of the process, the best-performing tunicates are retained and improved, causing the tunicates to reposition themselves relative to these top-performing peers. The TSA initiates with a population of tunicates generated randomly within the allowable bounds for the design variables, as indicated by the equation provided.Tp⃗=Tp⃗min+rand×(Tp⃗max-Tp⃗min)
Where, Tp⃗ denotes location of each tunicate, Tp⃗min is the lower limit of design variable, Tp⃗max is the upper limit of design variable and rand is randomly chosen value between 0 and 1. The tunicates move during loops in accordance with the following equation:
Tp⃗(x⃗+1)=(Tp⃗(x)+Tp⃗(x⃗))/(2+c1) (8)
Here, c1 is randomly chosen number from 0 to1 Tp⃗(x) indicates the new position of the tunicate in basis of the position of food. It is represented as,
Tp⃗(x)={SF+A×|SF-rand×Tp⃗|, if rand≥0.5 ; SF-A×|SF-rand×Tp⃗|, if rand<0.5 (9)
Where, SF indicates the position of the food in consideration of the tunicate position and A is random vector which prevents the collision of tunicates.
A=(c2+c3-2c1)/(VTmin+c1(VTmax-VTmin)) (10)
In above Eq. (10), c1, c2, and c3 are random numbers from 0 to1. The speeds utilized to produce social contact are represented by VTmin and VTmax which are 1 and 4, respectively.
The steps are given below,
Set the tunicate population to zero.
Decide on starting points and maximum number of iterations.
Calculate each search agent’s fitness value.
In the designed search space, the best tunicate is investigated.
Update the location of every tunicate.
Modify the updated tunicate that is in excess of the set finding area limit.
Make a new tunicate fitness calculation. Update the best if a better option becomes available after the previous best option.
The method terminates if the halting requirement is met. In any other case, repeat steps 5 to 8.
Return the best currently available optimal solution.
Horse herd optimization algorithm
The horse herd optimization algorithm (HOA), created by MiarNaeimi et al. is based on the routine behaviour of horses. Horses typically exhibit tumour, hierarchical order, amicability, imitation, defence mechanism, and meandering behaviour. These behaviours of horses at various ages serve as the inspiration for the HOA approach. Each iteration of HOA’s simulation of horse movement is provided by,
XkAge,Itr=XkAge,(Itr-1)+V̅Age,Itr, Age=∝, β,γ,δ (11)
Where, XkAge,Itr denotes the location of horse at k, Itr is the present iteration value, Age and V̅Age,Itr show the age span and vector of velocity of the horse under consideration. At different ages, horses exhibit diverse behaviours. Its maximum natural lifespan is between 25 and 30 years. δ stands for horses in the age range of 0 to 5, γ for horses in the age range of 5 to 10, β for horses in the age range of 10 to 15, and ∝ for horses older than 15 years.
Horses are grouped according to the best performance. The first 10% comes under ∝ group, next 20% comes under β category. Then 30% under γ and 40% under δ group. Horses’ velocity vector throughout each cycle of the procedure is proven to be,
V̅k∝,Itr=G̅k∝,Itr+D̅k∝,Itr (12)
V̅kβ,Itr=G̅kβ,Itr+H̅kβ,Itr+S̅kβ,Itr+D̅kβ,Itr (13)
V̅kγ,Itr=G̅kγ,Itr+H̅kγ,Itr+S̅kγ,Itr+D̅kγ,Itr+I̅kγ,Itr+R̅kγ,Itr (14)
V̅kδ,Itr=G̅kδ,Itr+I̅kδ,Itr+R̅kδ,Itr (15) Graze (G):
Horses are plant-eating animals that mostly consume fodder and grasses. They spend the majority of their day, approximately 16 to 20 hours, grazing in a meadow and take short breaks for rest. This method of leisurely eating is frequently referred to as “continuous feeding.” The HOA replicates the grazing area for each horse using a coefficient denoted as ‘g.’ This means that every horse grazes in specific areas. Horses engage in grazing throughout their entire lifespan. Below, you will find a detailed description of how grazing is precisely implemented.
G̅kAge,Itr=gItrAge×(û+pl̂)×XkAge,(Itr-1) (16)
gkAge,Itr=gkAge,(Itr-1)×wg (17)
Where, G̅kAge,Itr is the horse’s movement parameter, and it shows how the tendency to graze when stressed decreases linearly with wg per iteration. û and l̂ are the upper and lower limits of graze speed. p is a number randomly chosen between 0 and 1.
Hierarchical (H)
Horses follow a leader, often humans, who guides them in the rule of pecking order. The ‘h′ in HOA indicates a group’s propensity to pursue the strongest horse, as seen in Middle Ages β and γ.
HkAge, Itr=hkAge,Itr×(X*(Itr-1)-Xk(Itr-1)), (18)
Age=∝,β, and γ (19)
hkAge,Itr=hkAge,(Itr-1)×wh (20)
HkAge, Itr in the above equation indicates how the ideal horse posture affects the speed parameter. Xk(Itr-1) gives the location of ideal horse.
Scalability (S)
Horses require a societal life and occasionally live among other beasts, ensuring their safety and survival. Flock life increases their chances of escape. Horses’ uniqueness can lead to conflict, but some are content with other animals. Horses aged 5-15 prefer to stay in herds.
S̅kAge,Itr=S̅kAge,Itr[((1)/(N)∑j=1N(Xj(Itr-1)))-Xk(Itr-1)] (21)
Age=β,γ (22)
SkAge,Itr=SkAge,(Itr-1)×ws (23)
Where S̅kAge,Itr indicates vector motion of the horse in k. In the iteration Itr , SkAge,Itr denotes the concerned horse’s position towards the group. In every cycle, SkAge,Itr decreases by a factor of w. Age represents the time period for each horse, and N shows how many horses there are overall.
Imitating (I)
Horses learn each other’s good and bad behaviours through imitation. In this strategy, component ‘i’ is regarded as the simulation behaviour of horses. Young horses try to imitate others, and they continue to exhibit this trait well into adulthood. This is referred to as
I̅kAge,Itr=ikAge,Itr[((1)/(PN)∑j=1PN(X̂j(Itr-1)))-Xk(Itr-1)] (24)
Age=γ (25)
ikAge,Itr=ikAge,(Itr-1)×wi (26)
where I̅kAge,Itr is the kth horse’s motion vector in the direction of the mean of all horses with the ideal X̂ locations. Number of horses in the best places is indicated by PN. P might be interpreted as 10% of horses, according to one theory. wi is also a reducing factor for Itr each cycle.
Coping mechanism (D)
Horses’ response to predators is a sudden fight or escape response, demonstrating a negative coefficient to avoid unsafe environments. This protection mechanism, typified by factor ‘d′, is present throughout a horse’s natural life, ensuring they stay away from unsuitable locations.
D̅kAge,Itr=-dkAge,Itr[((1)/(qN)∑j=1qN(X̆j(Itr-1)))-X(Itr-1)] (27)
Age=∝,β,and γ (28)
dkAge,Itr=dkAge,(Itr-1)×wd (29)
Where D̅kAge,Itr gives the escaping vector of horse at k in accordance with the mean of horses with worse positions which is given by X̆. Number of horses in worse location are given by qN. Here, q denotes the 20% of horses. wd is the reducing factor for each cycle.
Roaming (R)
Horses are curious animals that travel and linger in nature, frequently spending time in stables. They frequently visit new meadows because they are curious about their surroundings. Horses can see one another via the side walls and mimic each other’s actions. Young horses frequently exhibit wandering behaviour, which gradually diminishes as they get older.
R̅kAge,Itr=rkAge,ItrpX(Itr-1) (30)
Age=γ and δ (31)
rkAge,Itr=rkAge,(Itr-1)×wr (32)
Where, R̅kAge,Itr is the vector of random speed of horse at k for local searching and wris reducing factor of rkAge,Itr for each cycle. The flow diagram is given below.
δ Horses’ velocity between the ages of 0 and 5 years:
V̅kδ,Itr=[gkδ,(Itr-1)×wg(û+pl̂)×Xk(Itr-1)]+[ikδ,(Itr-1)×wi×{((1)/(PN)∑j=1PN(X̂j(Itr-1)))-X(Itr-1)}][rkδ,(Itr-1)×wr×pX(Itr-1)] (33)
γ horse’ velocity between the age of 5 to 10 years:
V̅kγ,Itr=[gkγ,(Itr-1)×wg(û+pl̂)×Xk(Itr-1)]+[hkγ(Itr-1)×wh(X*(Itr-1)-Xk(Itr-1))]+[Skγ,(Itr-1)×ws{((1)/(N)∑j=1N(Xj(Itr-1)))-Xk(Itr-1)}]+[jkγ,(Itr-1)×wi{((1)/(PN)∑j=1PN(X̂j(Itr-1)))-X (Itr-1)}]-[dkγ,(Itr-1)×wd{((1)/(qN)∑j=1qN(X̆j(Itr-1)))-X (Itr-1)}]+[rkAge,(Itr-1)×wr×p×X(Itr-1)] (34)
β horses’ velocity between the age of 10 to 15 years:
V̅kβ,Itr=[gkβ,(Itr-1)×wg×(û+pl̂)×Xk(Itr-1)]+[hkβ,(Itr-1)×wh(X*(Itr-1)-Xk(Itr-1))]+[Skβ,(Itr-1)×ws{((1)/(N)∑j=1N(Xj(Itr-1)))-Xk(Itr-1)}]-[dkβ,(Itr-1)×wd×{((1)/(qN)∑j=1qN(X̆j(Itr-1)))-X(Itr-1)}] (35)
∝ horses’ velocity with age above 15 years:
V̅k∝,Itr=[gk∝,(Itr-1)×wg×(û+pl̂)×Xk(Itr-1)]-[dk∝,(Itr-1)×wd×{((1)/(qN)∑j=1qN(X̆j(Itr-1)))-X(Itr-1)}] (36)
Customized attack detection using EffiLenRNN
Efficient Net
Convolutional neural networks can be designed and scaled using the Efficient Net approach, which successfully adjusts the depth, breadth, and resolution parameters using a composite coefficient. By consistently altering depth, width, and resolution—which stand in for layers, channels, and image size—Efficient Net uses a novel strategy that improves performance while preserving architectural cohesiveness and lowering parameters. Each dimension is scaled using preset, deliberately calculated scaling constants. Through grid search, the method entails determining the best coefficient. This methodical investigation establishes, within predetermined limits like doubling FLOPS, the correlation between various network metrics. The end result is an architecture that maximizes efficiency while maximizing the contribution of each component and significantly enhancing network capabilities. Figure 2 Shown in below.
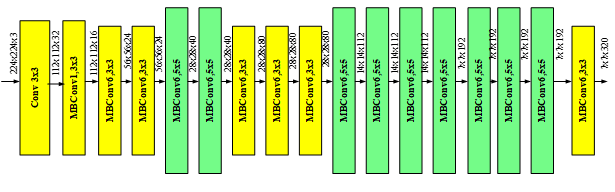
Figure 2: Basic architecture of EfficientNet
This architecture uses a creative inverted structure with the Mobile Inverted Convolution (MBConv) technology, frequently referred to as Inverted Residual Block. Sum-product procedures, skipping connections in small areas, and channel reduction are all involved while keeping the initial channel count. The MBConv deviates from conventional Convolutional networks by employing a narrow-wide-narrow design technique. It expands using a 1×1 Convolution, reduces parameters using a 3×3 Depth-wise Convolution, and then compresses the channels even further using a subsequent 1×1 Convolution. In order to produce a small but precise architecture, the EfficientNet-B7 model excels in scaling dimensions while maintaining high accuracy per parameter.
LenseNet
LensNet, a versatile computer vision framework, adapts to specific tasks. For object detection, it extends with detection heads and anchor box prediction layers, optimizing accuracy in locating objects. In semantic segmentation, LensNet takes the form of encoder-decoder architectures, effectively segmenting images into meaningful regions. To further enhance its capabilities, LensNet seamlessly integrates with Recurrent Neural Networks (RNNs). The module’s output is intelligently channelled into an RNN layer, enabling sequential analysis and context preservation. This fusion empowers LensNet to excel in tasks demanding temporal or sequential understanding, broadening its applicability in the realm of computer vision.
Recurrent Neural Networks
Recurrent neural networks were created in order to overcome feedforward neural networks’ limitations while simulating sequences. Neurons or other component elements that have the capacity to recall prior observations make up RNN networks. As a result, RNNs may model the input data using both recent and historical observations. The Long Short-Term Memory (LSTM) architecture, one of the suggested RNNs, performed particularly well at replicating the input data’s long-range temporal dependencies. The LSTM unit formally carries out the following operations in a recursive manner given an input vector a1(s) and the current observation (let’s say a1(s+1)):
j(s)=σ[Bd[a1(s),g(s-1)+wj]] (37)
d̅(s)=tanh([Bd[a1(s),g(s-1)]+wd]) (38)
u(s)=σ(Bu[a1(s)[a1(s),g(s-1)]+wu] (39)
d(s)=u(s)ʘ d(s-1)+ j(s) ʘ d̅(s) (40)
p(s)=σ[Bp[a1(s),g(s-1)]+wp] (41)
g(s)=ps ʘtanh((d(s))) (42)
Where ʘ is an element-by-element matrix multiplication. While j,u,d,p are known as input, input modulation, forget, cell, and output gates and perform operations that let the LSTM select the information to remember and to forget from the incoming data, Bj, Bd,Bu, BP and wj,wd, wu,wPlearnable kernels and biases, respectively. The knowledge that the LSTM unit has learned from previous observations is encoded when the hidden state G is coupled with A.
The EffiLensRNN model is a versatile architecture designed to excel in various computer vision tasks. It all begins with the input layer, where the model ingests diverse data types, including sequential images, video frames, or any time-series data. These inputs then traverse through the EfficientNet backbone, which efficiently extracts pertinent spatial features from the data. Next, the data undergoes transformation through the LensNet module, which is adaptable to the specific computer vision task at hand. For instance, in object detection tasks, it may incorporate detection heads and anchor box prediction layers, while in semantic segmentation, it could encompass encoder-decoder architectures. To capture temporal dependencies within the data, an RNN layer follows the LensNet module. This RNN layer is instrumental in comprehending sequences of images or video frames effectively. Finally, the EffiLensRNN model boasts task-specific output layers, finely tuned to suit the application at hand. These output layers can range from classification layers for tasks like attack detection to other specialized configurations, ensuring the model’s adaptability across a wide spectrum of computer vision challenges.
Result And Discussion
The model is called EffiLensRNN consistently in the text; EffiLensNet in the original figure legends is retained as a source label. Reported accuracy of 0.981 exceeds both sensitivity of 0.971 and specificity of 0.952, which is inconsistent with a common binary evaluation. Recall also differs from sensitivity. The table and original plots are reproduced as reported because their class mapping, confusion matrix and averaging protocol are not supplied. These unresolved differences limit conclusions about superiority and generalization to unseen network attacks.
Experimental Setup
In this research, the proposed model is implemented in MATLAB to get the best accuracy, with the metrics like sensitivity, specificity, accuracy, Precision, F1-Score, recall, FNR, FPR, NPV, MCC.
Overall performance of the proposed model
In Table 2, we present a comprehensive evaluation of the performance of our proposed model, Efficient LensNet, alongside several established models for comparison. Our model demonstrates remarkable results across various metrics, underscoring its efficacy in the given task. Efficient LensNet achieves an impressive sensitivity (Sen) of 97.1% and specificity (Spec) of 95.2%, resulting in an overall accuracy (Acc) of 98.1%. Moreover, it exhibits a high precision of 96.0%, ensuring reliable identification of positive cases, while maintaining a respectable recall (Recall) of 93.6%. Furthermore, the F1-score (FMeasure) of 94.1% highlights the model’s balanced performance, emphasizing its ability to strike a harmonious balance between precision and recall. Additionally, it boasts a strong negative predictive value (NPV) of 96.4%, which means it effectively identifies negative cases, with a low false-positive rate (FPR) of 3.5% and false-negative rate (FNR) of 5.8%. The Matthews Correlation Coefficient (MCC) of 92.8% underscores the model’s overall reliability. In comparison, other models like EfficientNet, LensNet, RNN, LSTM, and GRU display commendable performances, but Efficient LensNet emerges as the top performer in terms of Sensitivity, Specificity, and F1-score.
Table 2: Overall Performance of the proposed model
Sen | Spec | Acc | Precision | Recall | FMeasure | NPV | FPR | FNR | MCC | |
Proposed EffiLensRNN | 0.971 | 0.952 | 0.981 | 0.96 | 0.936 | 0.941 | 0.964 | 0.035 | 0.058 | 0.928 |
EfficientNet | 0.967 | 0.939 | 0.979 | 0.968 | 0.939 | 0.957 | 0.97 | 0.012 | 0.045 | 0.923 |
LensNet | 0.951 | 0.945 | 0.958 | 0.937 | 0.962 | 0.927 | 0.935 | 0.027 | 0.064 | 0.907 |
RNN | 0.956 | 0.942 | 0.937 | 0.966 | 0.932 | 0.936 | 0.96 | 0.019 | 0.039 | 0.916 |
LSTM | 0.91 | 0.965 | 0.944 | 0.926 | 0.904 | 0.943 | 0.931 | 0.032 | 0.066 | 0.896 |
GRU | 0.907 | 0.956 | 0.934 | 0.924 | 0.921 | 0.904 | 0.938 | 0.032 | 0.068 | 0.882 |
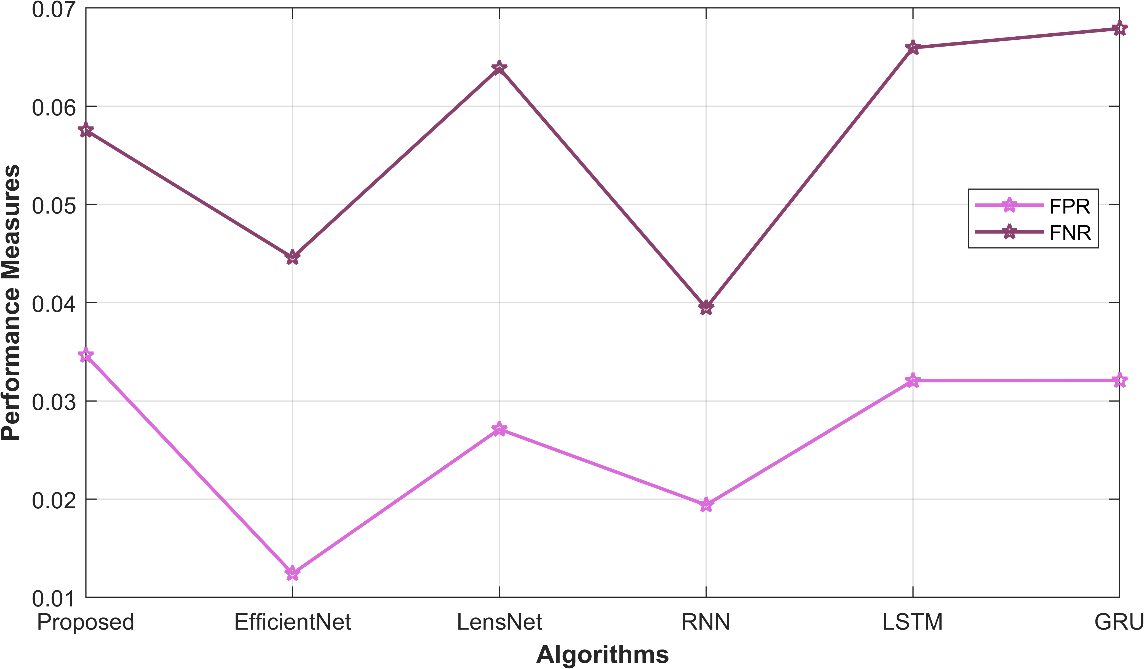
Figure 3: Graphical format of the performance metrics FPR and FNR of the proposed model
The above figure 3 illustrates the graphical format of the performance metrics FPR and FNR of the proposed model with another comparative model. From this graphical representation it is clear that the FPR value of the proposed model is higher than the other comparative models like EfficientNet, LensNet, RNN, LSTM, GRU.
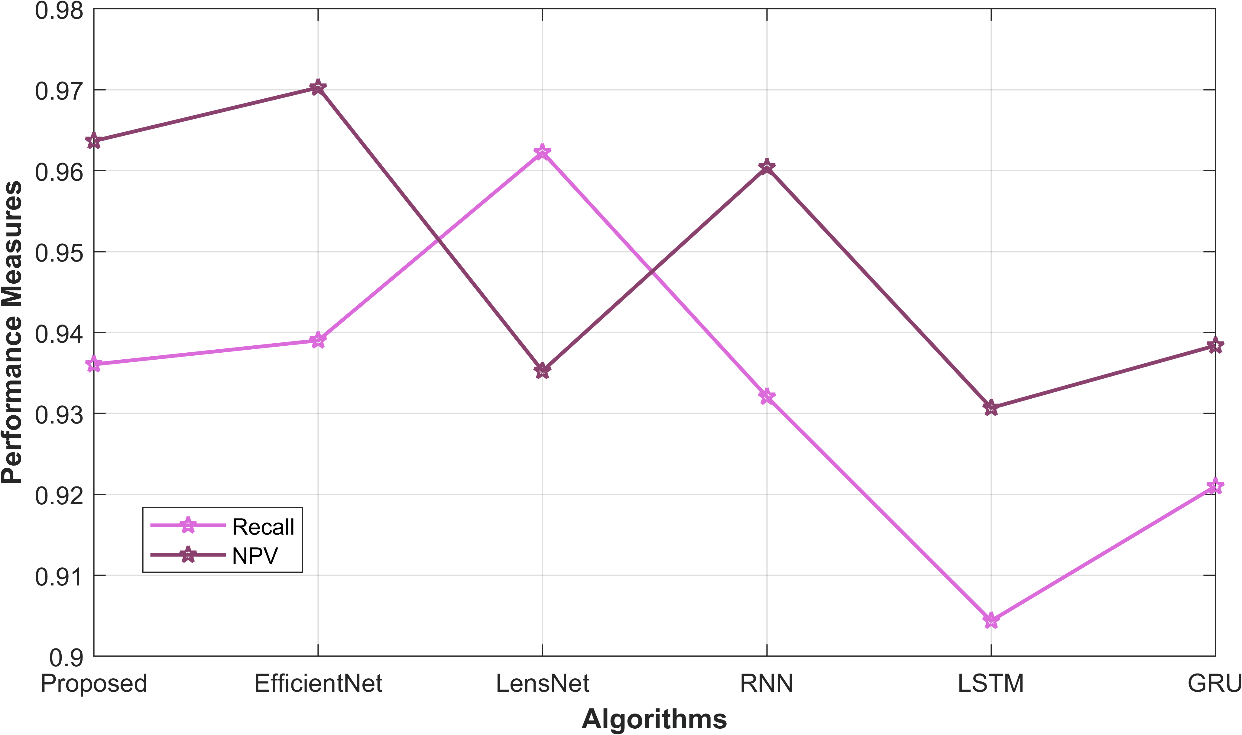
Figure 4: Graphical format of the performance metrics Recall and NPV of the proposed model
The above figure 4 illustrates the graphical format of the performance metrics Recall and NPV of the proposed model with another comparative model. From this graphical representation it is clear that the NPV value of the proposed model is higher than the other comparative models like EfficientNet, Lens Net, RNN, LSTM and GRU.
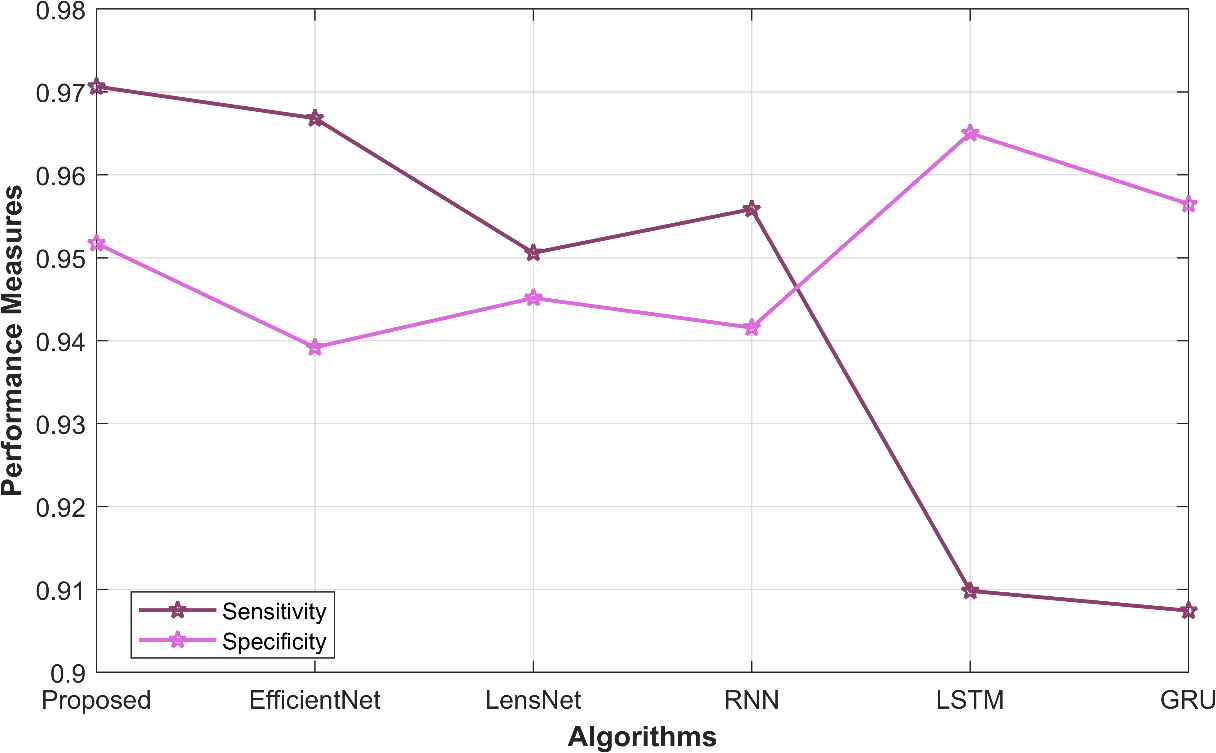
Figure 5: Graphical format of the performance metrics Sensitivity and Specificity of the proposed model
The above figure 5 illustrates the graphical format of the performance metrics Sensitivity and Specificity of the proposed model with another comparative model. From this graphical representation it is clear that the Sensitivity value of the proposed model is higher than the other comparative models like EfficientNet, Lens Net, RNN, LSTM and GRU.
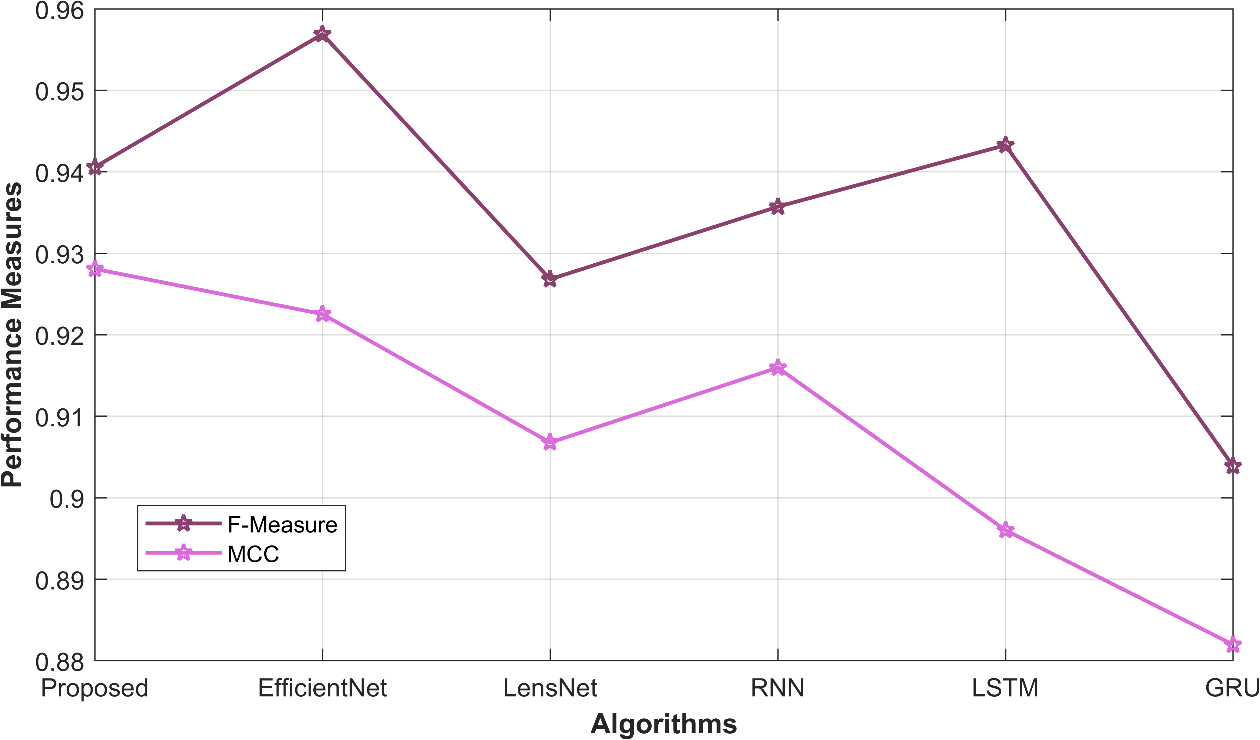
Figure 6: Graphical format of the performance metrics F-Measure and MCC of the proposed model
The above figure 6 illustrates the graphical format of the performance metrics F-Measure and MCC of the proposed model with another comparative model. From this graphical representation it is clear that the MCC value of the proposed model is higher than the other comparative models like EfficientNet, Lens Net, RNN, LSTM and GRU.
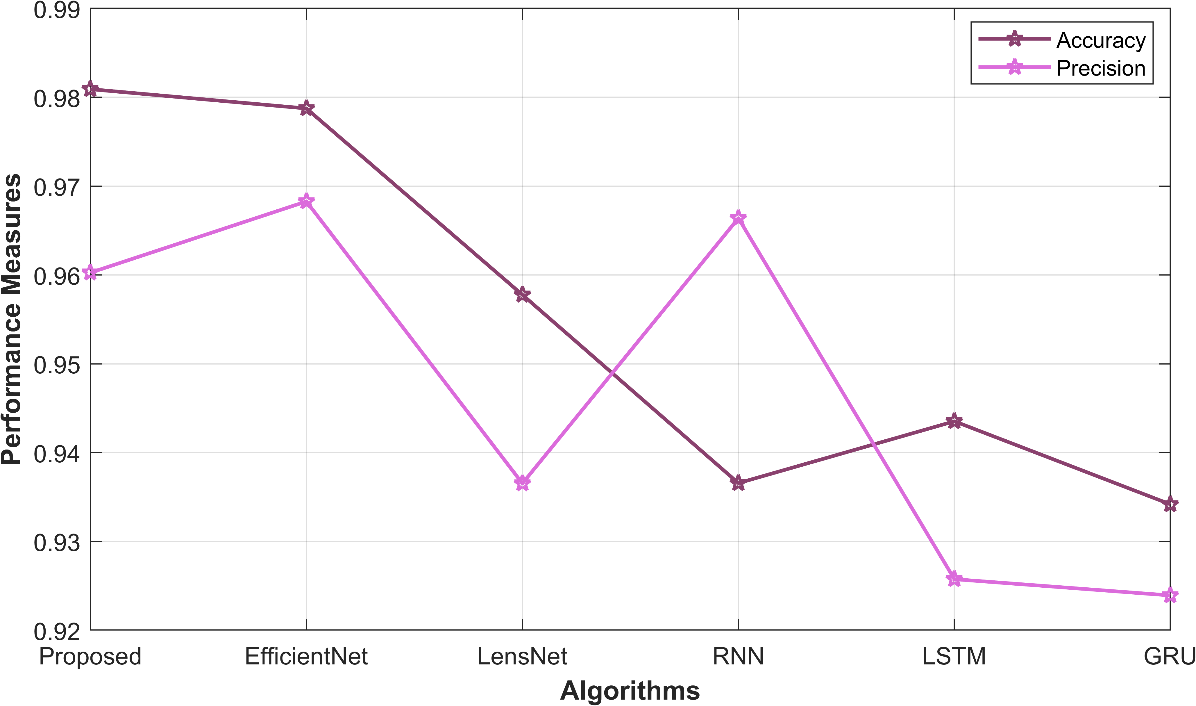
Figure 7: Graphical format of the performance metrics Accuracy and Precision of the proposed model
The above figure 7 illustrates the graphical format of the performance metrics Accuracy and Precision of the proposed model with another comparative model. From this graphical representation it is clear that the accuracy value of the proposed model is higher than the other comparative models like EfficientNet, Lens Net, RNN, LSTM and GRU.
Conclusion
In conclusion, EffiLensRNN stands as a specialized and potent deep learning model, meticulously designed to elevate network attack detection to new heights. Its robust data collection process, including the utilization of customized sensors, IDS systems, and honeypots, ensures a rich dataset for analysis. Customized preprocessing techniques enhance data quality, while domain-specific knowledge-based and statistical features provide valuable insights into network metrics. The model’s ability to identify intricate correlations between data points adds another layer of sophistication to its capabilities. Effi Lens RNN’ score strength lies in its hybrid architecture, marrying the efficiency of EfficientNet for spatial feature extraction with the adaptability of LensNet for various computer vision tasks. The integration of RNN further empowers the model to decipher temporal sequences effectively. With task-specific output layers, it flexibly addresses different attack detection scenarios. In essence, EffiLensRNN represents a tailored, cutting-edge solution for advanced network security.
References
[1] Wang, A., Wang, W., Zhou, H. and Zhang, J., 2021. Network intrusion detection algorithm combined with group convolution network and snapshot ensemble. Symmetry, 13(10), p.1814.
[2] Omer, N., Samak, A.H., Taloba, A.I. and Abd El-Aziz, R.M., 2023. A novel optimized probabilistic neural network approach for intrusion detection and categorization. Alexandria Engineering Journal, 72, pp.351-361.
[3] Yang, A., Zhuansun, Y., Liu, C., Li, J. and Zhang, C., 2019. Design of intrusion detection system for internet of things based on improved BP neural network. Ieee Access, 7, pp.106043-106052.
[4] Vinayakumar, R., Alazab, M., Soman, K.P., Poornachandran, P., Al-Nemrat, A. and Venkatraman, S., 2019. Deep learning approach for intelligent intrusion detection system. Ieee Access, 7, pp.41525-41550.
[5] Al-Turaiki, I. and Altwaijry, N., 2021. A convolutional neural network for improved anomaly-based network intrusion detection. Big Data, 9(3), pp.233-252.
[6] Baig, M.M., Awais, M.M. and El-Alfy, E.S.M., 2017. A multiclass cascade of artificial neural network for network intrusion detection. Journal of Intelligent & Fuzzy Systems, 32(4), pp.2875-2883.
[7] Magán-Carrión, R., Urda, D., Díaz-Cano, I. and Dorronsoro, B., 2020. Towards a reliable comparison and evaluation of network intrusion detection systems based on machine learning approaches. Applied Sciences, 10(5), p.1775.
[8] Ghosh, P., Sarkar, D., Sharma, J. and Phadikar, S., 2021. An intrusion detection system using modified-firefly algorithm in cloud environment. International Journal of Digital Crime and Forensics (IJDCF), 13(2), pp.77-93.
[9] Liang, W., Li, K.C., Long, J., Kui, X. and Zomaya, A.Y., 2019. An industrial network intrusion detection algorithm based on multifeatured data clustering optimization model. IEEE Transactions on Industrial Informatics, 16(3), pp.2063-2071.
[10] Tao, Q., Jiang, M., Wang, X. and Deng, B., 2018. A cloud-based experimental platform for networked industrial control systems. International Journal of Modeling, Simulation, and Scientific Computing, 9(04), p.1850024.
[11] Mohurle, S. and Patil, M., 2017. A brief study of wannacry threat: Ransomware attack 2017. International journal of advanced research in computer science, 8(5), pp.1938-1940.
[12] Al-Omari, M., Rawashdeh, M., Qutaishat, F., Alshira’H, M. and Ababneh, N., 2021. An intelligent tree-based intrusion detection model for cyber security. Journal of Network and Systems Management, 29, pp.1-18.
[13] Tait, K.A., Khan, J.S., Alqahtani, F., Shah, A.A., Khan, F.A., Rehman, M.U., Boulila, W. and Ahmad, J., 2021, July. Intrusion detection using machine learning techniques: an experimental comparison. In 2021 International Congress of Advanced Technology and Engineering (ICOTEN) (pp. 1-10). IEEE.
[14] Uhm, Y. and Pak, W., 2021. Service-aware two-level partitioning for machine learning-based network intrusion detection with high performance and high scalability. IEEE Access, 9, pp.6608-6622.
[15] Smys, S., Balas, V.E., Kamel, K.A. and Lafata, P., 2021. Inventive Computation and Information Technologies. Springer Singapore.
[16] Thampi, M. and Bose, 2020. Applied Soft Computing and Communication Networks. Springer Singapore.
[17] Ahmad, Z., Shahid Khan, A., Wai Shiang, C., Abdullah, J. and Ahmad, F., 2021. Network intrusion detection system: A systematic study of machine learning and deep learning approaches. Transactions on Emerging Telecommunications Technologies, 32(1), p.e4150.
[18] Boiko, A., Shendryk, V. and Boiko, O., 2019. Information systems for supply chain management: uncertainties, risks and cyber security. Procedia computer science, 149, pp.65-70.
[19] Madhu, B., Chari, M.V.G., Vankdothu, R., Silivery, A.K. and Aerranagula, V., 2023. Intrusion detection models for IOT networks via deep learning approaches. Measurement: Sensors, 25, p.100641.
[20] Ullah, M.U., Hassan, A., Asif, M., Farooq, M.S. and Saleem, M., 2022. Intelligent Intrusion Detection System for Apache Web Server Empowered with Machine Learning Approaches. International Journal of Computational and Innovative Sciences, 1(1), pp.21-27.
[21] Sarker, I.H., Abushark, Y.B., Alsolami, F. and Khan, A.I., 2020. Intrudtree: a machine learning based cyber security intrusion detection model. Symmetry, 12(5), p.754.
[22] Otoum, Y., Liu, D. and Nayak, A., 2022. DL‐IDS: a deep learning–based intrusion detection framework for securing IoT. Transactions on Emerging Telecommunications Technologies, 33(3), p.e3803.
[23] Shitharth, S., 2017. An enhanced optimization-based algorithm for intrusion detection in SCADA network. Computers & Security, 70, pp.16-26.
[24] Nguyen, M.T. and Kim, K., 2020. Genetic convolutional neural network for intrusion detection systems. Future Generation Computer Systems, 113, pp.418-427.
[25] Wang, Q., Zhao, W. and Ren, J., 2021. Intrusion detection algorithm based on image enhanced convolutional neural network. Journal of Intelligent & Fuzzy Systems, 41(1), pp.2183-2194.
[26] Kan, X., Fan, Y., Fang, Z., Cao, L., Xiong, N.N., Yang, D. and Li, X., 2021. A novel IoT network intrusion detection approach based on adaptive particle swarm optimization convolutional neural network. Information Sciences, 568, pp.147-162.
[27] Khan, F.A., Gumaei, A., Derhab, A. and Hussain, A., 2019. A novel two-stage deep learning model for efficient network intrusion detection. IEEE Access, 7, pp.30373-30385.
[28] Haghighat, M.H. and Li, J., 2021. Intrusion detection system using voting-based neural network. Tsinghua Science and Technology, 26(4), pp.484-495.
Cite This Work
To export a reference to this article please select a referencing stye below:

Academic Master Education Team is a group of academic editors and subject specialists responsible for producing structured, research-backed essays across multiple disciplines. Each article is developed following Academic Master’s Editorial Policy and supported by credible academic references. The team ensures clarity, citation accuracy, and adherence to ethical academic writing standards
Content reviewed under Academic Master Editorial Policy.





