
Abstract
In the realm of network security, the process of collecting and integrating data plays a pivotal role. Data is gathered from diverse sources, including logs, sensor data, network traffic, and external threat intelligence feeds. Techniques like Extract, Transform, and Load (ETL) are employed to harmonize this heterogeneous data into a cohesive dataset. To bolster network security, a multi-information fusion approach is adopted, leveraging deep learning-based fusion techniques such as Siamese networks. These neural networks seamlessly combine data from various sources, enhancing the accuracy and comprehensiveness of anomaly detection. Feature extraction is a crucial step that involves capturing domain-specific network behaviors. This encompasses a range of techniques, such as calculating packet length statistics, analyzing protocol distribution, extracting flow duration features, measuring traffic volume metrics, and conducting port-based and payload analysis. DNS query analysis, traffic entropy computation, user and device identification, behavioral biometrics, rate-based features, statistical anomaly scores, time-of-day analysis, and the incorporation of security alerts and indicators further enrich the feature set. Additionally, the development of models for flow pattern recognition is instrumental in identifying specific network attack patterns. In the subsequent phase, hybrid optimization algorithms are employed for feature selection, while dimensionality reduction is achieved using t-SNE for non-linear dimensionality reduction. Network anomaly detection is then performed using a combination of autoencoders, Isolation Forests, and recurrent neural networks (RNNs). Autoencoders help in reconstructing normal network behavior, flagging deviations as anomalies. Isolation Forest is particularly effective in identifying network anomalies, and optimized RNNs enhance the detection accuracy. Finally, the performance of the Fusion Net model is rigorously evaluated using key metrics such as precision, recall, F1-score, AUC-ROC, and false positive rates. To ensure the model’s robustness and generalization, k-fold cross-validation is conducted, providing a comprehensive assessment of its efficacy in safeguarding network integrity and security. This comprehensive approach enables effective detection and mitigation of network anomalies, bolstering overall cybersecurity measures. The experimental values are reported as supplied; the evaluation limitations discussed below restrict their interpretation.
Keywords: Extract, Transform, and Load, t-SNE, Autoencoders, Isolation Forests, and recurrent neural networks.
Introduction
With the development of e-commerce, the value of data can be reflected, the data managed by enterprises, and the data under various social networks make the data generated by e-commerce show explosive development. The increase in the number of users makes it more difficult for enterprises to manage user data [1]. The era of big data has come, and e-commerce is experiencing diversified and large-scale data development, the huge data resources increase the difficulty and cost of data processing, how to capture and mine these data has become an important issue in the development of e-commerce [2]. The O2O user data mining process reflects certain automation features, especially in the data collection process, which often lacks the final goal, and only obtains more data information from many data collection locations, in this process, we only need to implement the corresponding pretreatment of big data information, and then apply appropriate calculation methods to analyze the big data content [3]. In the actual big data mining process, we should solve this key problem in advance, that is, identify the characteristics of the user group, and then analyze the personal characteristics of its users, on this basis, we can obtain the required data information and reflect the business value of user data mining [4-5].
Under the current social development background, the development process of e-commerce is in the trend of accelerating year by year, and its practical application value is gradually highlighted, especially the data transfer under the enterprise internal data and social network [6]. an analysis based on information sharing and risk preference, how to deal with the development form of big data and obtain more accurate user data, we need to strengthen our data mining ability [7]. The big data analysis of the efficiency and influencing factors of agricultural products in China [8]. The use of wms data and big data analysis to improve order selection in e-commerce [9]. In the process of data application and mining, we usually combine the actual needs of businesses and then select the most appropriate model system to implement targeted data mining [10].
After data mining, they will also be applied to the calculation and analysis of big data visualization, reflecting its practical application advantages and value.3 Data mining algorithm for e-commerce user network based on multi-information fusion [11]. To analyze in depth the complementing DOA-related data that can be found in the spatial spectrums generated by several fundamental DOA estimators [12]. Multi-source information fusion to identify elusive short circuit faults in synchronous condenser rotor windings [13]. Utilizing the fused multi-information, the study detected arc faults, notorious for causing electrical fires in eco-friendly building’s low-voltage distribution systems [14]. Examined SVM kernel function selection, GA optimization parameter setup, and base classifier count. Explored coal gangue image recognition using AdaB-GA-SVM and diverse powerful classifiers with distinct SVM bases [15].
The major contribution of this research is as follows:
For multi-information fusion, Deep Learning-Based Fusion uses the deep neural networks, such as Siamese networks to fuse data from various sources.
To extract the Feature-specific features that capture network behaviors involves employing various techniques and methods to extract meaningful information from the data.
To select the feature, a hybrid optimization algorithm is proposed.
To Dimensionality Reduction, t-SNE for non-linear dimensionality reduction is used
For anomaly detection of the network autoencoders, Isolation forests, and deep learning-based models are used.
In this research, Section one explains abot the introduction part, Section two explains the review of the literature, Section three explains about the detailed methodology, Section four explains about the result and discussion and finally section fivr explains about the conclusion.
Literature Review
In 2021, Li and Zhu et al. [16] have indicated that effective guidance from peer engagement activities could mitigate high synchronicity. It was observed that synchronicity increased during epidemics, with experts and group diversity more effectively reducing it. However, the impacts of informativeness and information diffusion were hindered. These findings had implications for addressing the impact of epidemic outbreaks on financial markets.
In 2021, He and Yin et al. [17] have analyzed issues in Chinese cold chain logistics, primarily focusing on demand prediction. Mathematical calculations were conducted using neural network and grey prediction algorithms. Two forecasting models were developed using data from 2013 to 2019 via R program 4.0.2, aiming to understand cold chain logistics demand. The results from both models indicated high accuracy.
In 2021, Cui et al. [18] have proposed data mining within an intelligent recommendation system to enhance data mining efficiency. Mathematical modeling of the system was performed based on association rules. Following an analysis of system requirements, Java 2 Platform, Enterprise Edition, technology was used to structure the system into presentation, business logic, and data layers. Subsequent steps included recommendation module division, fuzzy clustering optimization, system construction, and performance evaluation using accuracy, coverage, and response time metrics.
In 2021, Rajendran et al. [19] have focused on designing a big data classification model using chaotic pigeon-inspired optimization (CPIO) for feature selection and an optimal deep belief network (DBN) model. The model was executed in the Hadoop MapReduce environment for big data management. Through simulations, the approach’s superiority over recent techniques was demonstrated.
In 2022, Li and Shen et al. [20] have used to enhance user query intent recognition in e-commerce platforms, we introduced an intent recognition method based on ontology and matter mapping. We combined needs ontology with the BERT-CRF model for semantic mining, addressing the issue of accurate recommendations. The approach showed promising results in intention classification for commodity types and model tests.
In 2022, Wang and Wang et al. [21] have presented a novel Bayesian network-driven approach for rock burst early warning. Initially, a multi-index system was constructed for early alerts, involving the extraction of numerous geophysical signal characteristics. Subsequently, excess indices were removed to mitigate information inconsistencies. Bayesian network illustrated causalities between rock burst and indices, aiding in forecasting occurrence probability through signal fusion.
In 2021, Liu and He et al. [22] have introduced the MIFM-MNLLE approach, which harnessed the LLE algorithm with a multi-information fusion metric. Initially, a combination of Euclidean distance and cosine similarity evaluated sample similarity, enhancing neighbor selection accuracy. Next, the mutual neighbor structure concept constructed sample neighbor and mutual neighbor graphs, effectively representing the dataset’s internal structure
In 2021, Mao and Liu et al [23] have presented a method for reconstructing multi-step attack scenarios in networks through multiple information fusion of attack time, risk assessment, and attack node details. The Convolution and Agent Decision Tree Network (CTnet) was introduced as a convolutional neural network to assess IDS-detected attacks and provide risk alerts. The Graph-based Fusion Module (GM) then reconstructed weighted attack scenarios using risk assessment and time data. Ultimately, the high-risk attack chain was extracted using the Depth First Search with Time and Weight (TW-DFS) algorithm.
In 2018, Hu and Huang et al. [24] have introduced a novel multi-information fusion method comprising a diagnostic model with data fusion, feature fusion, and decision fusion layers. These layers were built upon backpropagation (BP) neural networks, support vector machines (SVM), and evidence theory. The research centered on allocating reliability to diagnostic outcomes derived from the data and feature fusion layers.
In 2023, Huang and Shao et al. [25] have presented a tool wear prediction approach that utilized multi-information fusion and genetic algorithm (GA)-optimized Gaussian process regression (GPR). The methodology included wavelet packet denoising (WPD) for noise reduction in multisensory signals and kernel principal component analysis (KPCA) for feature selection, focusing on sensitive features for flank wear identification.
Problem Statement
The drawback of the proposed rock burst monitoring and early warning approach is that it might still face challenges in effectively handling complex and rapidly changing geological conditions and uncertainties [21]. A limitation of the local linear embedding algorithm with mutual neighborhood based on multi-information fusion metric is its potential sensitivity to noise and outliers in the data, affecting its accuracy [22]. The multi-step attack scenario reconstruction and attack chains extraction method based on multi-information fusion is its complexity, which could result in increased computational resources and time [23]. An inherent limitation of the electronic systems diagnosis fault in gasoline engines based on multi-information fusion is the reliance on accurate and comprehensive data sources. Insufficient or inconsistent data could lead to reduced diagnostic accuracy and potentially inaccurate fault detection and diagnosis [24]. The tool wear prediction method based on multi-information fusion and genetic algorithm-optimized Gaussian process regression in milling is its sensitivity to variations in sensor data and machining conditions, which might affect the accuracy of tool wear predictions in certain scenarios.
Proposed Methodology
Our proposed methodology for network anomaly detection is a comprehensive and advanced approach designed to enhance network security. It begins with Data Collection and Integration, where network data is gathered from diverse sources, including logs, sensor data, network traffic, and external threat intelligence feeds. Through the application of ETL techniques, this data is harmonized into a unified dataset. In the Multi-Information Fusion phase, we employ cutting-edge Deep Learning-Based Fusion techniques, utilizing deep neural networks like Siamese networks to fuse insights from various sources effectively. Feature Extraction is a critical step, involving the extraction of domain-specific features that capture network behaviors. This includes statistical analysis of packet lengths, protocol distribution assessment, flow duration feature extraction, and in-depth analysis of traffic volume, port usage, payload content, DNS queries, traffic entropy, user and device identification, behavioral biometrics, rate-based features, statistical anomaly scores, time-of-day analysis, and integration of known security alerts. Feature selection is optimized using a hybrid algorithm, and dimensionality reduction employs t-SNE for effective non-linear dimensionality reduction. Finally, for Network Anomaly Detection, we utilize Autoencoders to reconstruct normal network behavior and identify anomalies, implement the Isolation Forest algorithm for outlier detection, and develop deep neural networks like recurrent neural networks (RNNs) to enhance the precision of anomaly detection. This methodology ensures robust network security by effectively identifying and mitigating anomalies and is shown in Figure 1.
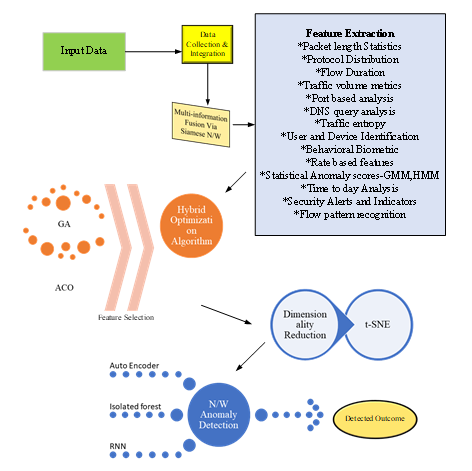
Figure 1: Overall flow diagram of the proposed model
Data Collection and Integration
In this research, the data is collected from various channels, including log files, sensor data, network traffic logs, and external threat intelligence feeds. This diverse data pool enables comprehensive network monitoring and analysis, enhancing cybersecurity and network performance management.
Data integration is the process of combining data from many source systems to make it easier to create cohesive datasets. These linked datasets assist operational and analytical tasks, hence boosting organizational effectiveness and decision-making processes. The process of merging data from several sources into a sizable, central repository known as a data warehouse is called extract, transform, and load (ETL). To organize and clean up raw data and get it ready for storage, data analytics, and machine learning (ML), ETL uses a set of business rules.
Multi-Information Fusion
The process of integrating and merging data and information from various sources or sensors to provide a more thorough and accurate depiction of a situation or occurrence is known as multi-information fusion. It is frequently used to improve situational awareness and make better-informed decisions by taking into account various data inputs in sectors including data analysis, surveillance, and decision-making.
Siamese Network
A Siamese neural network (SNN) is one of several types of neural network topologies that stand out by having two or more similar sub-networks. “Identical” in this case means that these sub-networks have the same setup, which includes matching parameters and weights. In particular, parameter updates are replicated simultaneously in all sub-networks. By comparing feature vectors, this special architecture is generally used to identify commonalities between input data.
Feature Extraction
After Multi-information fusion, to extract useful information from data, feature extraction in network behavior analysis uses a variety of approaches and methodologies. For thorough examination, the following main characteristic categories are necessary: Traffic volume metrics, port-based analysis, payload analysis, DNS query analysis, traffic entropy, user and device identification, behavioral biometrics, packet length statistics, protocol distribution, flow duration features, Statistical Anomaly Scores, Time-of-Day Analysis, Security Alerts and Indicators, and Flow Pattern Recognition are examples of rate-based features. Together, these feature extraction techniques improve our capacity to recognize and efficiently address network risks and anomalies.
Packet Length Statistics
Packet length statistics refer to the analysis of various statistical measures applied to the lengths of data packets transmitted over a network. These statistics provide insights into the distribution and characteristics of packet lengths within network traffic. Key packet length statistics include:
Mean
The average length of packets in a dataset, calculated by summing the lengths of all packets and dividing by the total number of packets. It represents the central tendency of packet lengths.
X̅=(∑(X))/(N) (1)
Where N is the total number of observations X is the given number of observations
Median
The middle value of the packet lengths when they are sorted in ascending order. It is a measure of the central position of the data and is less affected by outliers than the mean.
If N is odd then, m=((N+1)/(2))thterm (2)
If n is even, then m=(((N)/(2))thterm+((N)/(2)+1)thterm )/(2) (3)
Where N is the total number of observations
Standard Deviation
A measure of the dispersion or spread of packet lengths from the mean. A high standard deviation indicates a wide range of packet lengths, while a low standard deviation suggests more uniform lengths.
sd=σ=√((∑((X-X)̅2))/(N)) (4)
As per Eq. (4) X is the given observation, X̅ is the mean; N is the total number of observations.
Skewness
Skewness measures the asymmetry of the packet length distribution. Positive skewness indicates that the distribution is skewed to the right, with a longer tail on the right side. Negative skewness suggests the opposite.
Pearsons first coefficient=(Mean-mode)/(Standard deviation) (5)
Analysing packet length statistics can help in network traffic analysis and anomaly detection. Unusual patterns in packet length statistics may indicate network issues, anomalies, or potentially malicious activity. For example, a sudden increase in the standard deviation or a shift in skewness might signify a network problem or an attack.
Protocol Distribution
Protocol distribution refers to the analysis of the distribution of communication protocols used in network traffic. In the context of computer networking, communication between devices and systems occurs through various protocols, each serving specific functions and defining the rules for data exchange. Common communication protocols include TCP (Transmission Control Protocol), UDP (User Datagram Protocol), ICMP (Internet Control Message Protocol), HTTP (Hypertext Transfer Protocol), and many others. Protocol distribution analysis involves examining the frequency or proportion of different protocols within a given dataset of network traffic. It helps network administrators, security professionals, and analysts understand the composition of traffic on a network.
Flow Duration Curve
The flow-duration curve, which displays the percentage of time that specified discharges were met or exceeded within a certain period, is a cumulative frequency curve. It combines, without regard to the order of occurrence, the flow characteristics of a stream across the whole range of discharge in a single curve. The purpose of flow duration features is to record characteristics related to the length of time of network flows. The lowest (minimum), longest (maximum), and normal (average) durations of these flows are among the metrics covered by these features. Insights into the temporal elements of network communication are gained by analysing these duration characteristics, which helps with anomaly identification and network performance evaluation.
Traffic Volume metrics
Traffic volume metrics entail quantifying the complete data payload exchanged in both upstream and downstream directions for every network flow or connection. This measurement offers a comprehensive view of data transmission, facilitating the assessment of network usage, capacity planning, and the identification of data-intensive activities or anomalies.
Port base analysis
In order to identify potentially suspicious or unusual services, port-based analysis examines how specific network ports and port ranges are used. Effective network security and monitoring procedures are aided by this investigation in the discovery of odd network behaviour, potential security concerns, and the categorization of network services based on their assigned ports.
Payload Analysis
Payload analysis comprises a careful investigation of the payload data as well as the contents of network packets. This examination seeks to identify characteristic patterns linked to network assaults or unauthorized data exfiltration. Security experts can improve their capacity to identify and counter threats, protecting network integrity and data confidentiality, by digging into the payload content.
DNS Query Analysis
Extraction of useful information from Domain Name System (DNS) requests, including domain names, query types (such as A, MX), and query frequency, is known as DNS query analysis. Understanding how network resources are accessed, spotting potential anomalies, and improving network management and security are all aided by this method, which successfully monitors DNS traffic.
Traffic Entropy
Traffic entropy computation involves the determination of entropy values for various facets of network traffic, such as source and destination IP addresses and communication protocols. This analysis is conducted to discern irregular patterns within network communication. By quantifying the level of disorder or unpredictability in these aspects, network administrators can identify potential anomalies or suspicious activities, contributing to improved network security and performance management.
User and Device Identification
User and device identification includes the use of approaches like user and device profiling to create links between particular users or devices and network traffic. This method is vital for improving network administration and security. Organizations may monitor activity, impose access controls, and identify unauthorized or suspect behavior by uniquely attributing traffic to users or devices. This strengthens and secures the network infrastructure.
Behavioral Biometrics
Using behavioral biometrics entails identifying distinctive user interaction patterns with network resources, such as typing or navigational habits. This cutting-edge method of user authentication and security takes advantage of these distinctive behavioral patterns to establish identity and uncover potential unauthorized access, substantially enhancing network security and access control mechanisms.
Rate Based Features
Rate-based features include measures like packets per second, connections per minute, or data transfer rates that are used to calculate event rates inside a network. Critical information about network speed, congestion, and usage trends is provided by these computations. Network administrators can optimise resource allocation, find abnormalities, and guarantee the effective operation of the network infrastructure by monitoring and analysing rate-based aspects.
Statisticaly Anomaly Scores
Statistical models like Gaussian Mixture Models (GMM) or Hidden Markov Models (HMM) are used to generate scores for statistical anomaly scores, which are used to identify departures from the norm. These results operate as markers for unusual network activity, assisting in the early detection of potential security threats or abnormalities. These statistical models can be used by organizations to strengthen their network security posture and quickly react to anomalous network activity.
Gaussian Mixture Models (GMM)
Suppose there are K clusters (for the purpose of simplicity, let’s suppose that the number of clusters is known and is K). So, for each k, mu, and Sigma are also estimated. They would have been calculated using the maximum likelihood method if there had just been one distribution. However, given that there are K such clusters and the probability density is specified as a linear function of the densities of each of these K distributions, i.e.
P(x)=∑K=1k(πKg(x|μK,∑K)) (6)
As pe Eq. (6), the mixing coefficient for Kth distribution is πK. Calculate the maximum log-likelihood technique for the parameters’ estimation.
P(x|μ,∑,π) (7)
In P(x|μ,∑,π)=∑I=1n(P(xI)) (8)
=∑I=1n(Ln∑K=1k(πKg(xI|μK,∑K))) (9)
Now create a random variable called γK(x)with the property γK(x)=P(K ; x).
Using the Bayes theorem,
γK(x)=(P(x ; K)P(K))/(∑K=1k(P(K)P(x|K))) (10)
=(P(x|K)πK)/(∑K=1k(πKP(x|K))) (11)
Now, the derivative of P(x|μ,∑(and π )the log-likelihood function with respect to μ,π and ∑should be zero for the function to have the highest value. In other words, by setting the derivative of P(x|μ,∑(and π ) )with regard to μ to zero and rearrange the terms,
μK=(∑N=1n(γK(XN))XN)/(∑N=1n(γK(XN))) (12)
The following formulas can be obtained by taking the derivative similarly with regard to γand π respectively.
∑K((∑N=1n(γK(XN)(XN)-μK)(XN-μK)t)/(∑N=1n(γK(XN)))) (13)
πK=(1)/(n)∑N=1n(γK(XN)) (14)
As per Eq. (14),
∑N=1n(γK(XN)) terms as the total number ofthe ample points in the kth cluster.
Hidden Markov Models (HMM)
The Hidden Markov Model (HMM) serves as a statistical construct employed to elucidate the probabilistic interplay between a sequence of observations and an underlying sequence of hidden states. Its prevalence arises in scenarios where the origins of observations are shrouded or undisclosed, hence the term “Hidden Markov Model.” Its versatile utility encompasses predictive analytics, enabling the anticipation of forthcoming observations or sequence classification. This prediction relies on the concealed process governing data generation.
An HMM constitutes two fundamental categories of variables: hidden states and observations.
Hidden States: These latent variables are the architects behind the observed data generation process, though they remain beyond direct observation.
Observations: Observable variables represent the data captured through measurement.
The connection linking these hidden states to observations is established via a probability distribution. Within the Hidden Markov Model (HMM), this connection relies on two sets of probabilities:
Transition Probabilities: These probabilities delineate the likelihood of transitioning from one concealed state to another within the sequence.
Emission Probabilities: These probabilities expound on the likelihood of observing a specific output while being in a particular hidden state.
HMMs are instrumental across various domains, including speech recognition, natural language processing, and bioinformatics. They excel in deciphering intricate sequential patterns in data, particularly when the underlying processes remain concealed or ambiguous.
Time-of-Day Analysis
Time-of-day analysis involves the examination of network behaviors at various points throughout the day. This process is designed to identify fluctuations in usage patterns and potential irregularities that may occur during specific time periods. By scrutinizing network activity over time, organizations can gain insights into peak usage hours, unusual spikes in traffic, and potential security threats that might manifest at specific times, thus aiding in more effective network management and anomaly detection.
Security alerts and Indicators
The integration of established security alerts and indicators of compromise (IoCs) into the process of feature engineering is a proactive approach to identifying suspicious activities within a network. By embedding these IoCs into the feature extraction and analysis pipeline, organizations can swiftly flag and respond to potential threats. This strategy enhances the overall security posture by leveraging prior knowledge of known attack patterns, malware signatures, and indicators of compromise. It aids in the rapid detection of unauthorized access, data breaches, and malicious activities, facilitating a more robust and responsive cybersecurity framework.
Flow pattern Recognition
Flow pattern recognition involves the creation of specialized models designed to identify distinct flow patterns linked to network attacks, such as port scanning or Distributed Denial of Service (DDoS) attacks. These models employ advanced algorithms to analyze network traffic data, pinpointing anomalous behaviors indicative of malicious intent. By recognizing these attack patterns, organizations can swiftly deploy countermeasures and bolster their network security defenses. This proactive approach enhances the ability to detect and mitigate threats, safeguarding network integrity and ensuring uninterrupted service delivery.
Feature Selection—Hybrid optimization algorithm
Feature selection is a critical process in data analysis and machine learning, and it can benefit greatly from hybrid optimization algorithms. Two notable hybrid optimization algorithms that excel in this context are Genetic Algorithms (GAs) and Ant Colony Optimization (ACO).
Genetic Algorithm
A Genetic Algorithm (GA) serves as a population-driven optimization method, applicable across diverse fields like microelectronics and nanophotonics. The optimization challenge’s potential solutions are embodied as individuals within a population. These individuals are represented by genotypes in the form of chromosomes, encoding data as binary strings for manipulation.
Initially, a population of chromosomes is randomly generated, tailored to the specific problem. Fittest individuals are selected through methods like rank-based assessment, roulette wheel, or tournament selection. These elite members become parents for the next generation. Crossover and mutation operators inject diversity in each iteration. The process repeats until an optimal or near-optimal solution is attained, or a predefined iteration limit is reached. GAs facilitates exploration of the search space, sidestepping local optima to converge on global solutions.
A simplified genetic algorithm is depicted in the flowchart, highlighting key Darwinian steps: selection, crossover, and mutation. Following each evaluation within the subset of the fittest individuals, these crucial genetic operations are executed. This iterative process represents the successive generations in the evolutionary journey of the algorithm. It iteratively refines candidate solutions, enhancing their fitness and diversity until an optimal or near-optimal solution is reached or a predefined generation limit is attained. This iterative evolution mimics the principles of natural selection, driving the algorithm towards improved solutions over time. Figure 2 Shown in Below.
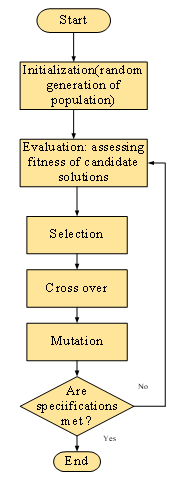
Figure 2: Genetic algorithm Flowchart
Ant Colony Optimization
The Ant Colony Optimization (ACO) algorithm draws inspiration from the foraging behavior of ants in colonies. In this algorithm, each ant (represented as ‘k’) emulates an individual worker ant. When selecting a route, the ant constructs a graph and deposits pheromones along its path. The probability of choosing a particular route is calculated by considering various factors such as pheromone levels, distance, and heuristics. This probabilistic decision-making process is a core element of ACO, allowing ants to collectively discover optimal paths by iteratively adjusting the pheromone trails over time.
pIJK={((τIJ)α(ηIJ)β)/(∑IϵjIK((τIJ)α(ηIJ)β)) J∉jIK ; 0 J∉jIK} (15)
In the context of this ant colony optimization (ACO) algorithm, jIK represents the set of neighboring vertices for the Kth ant at vertex I, while τIJ signifies the pheromone concentration on the edge (I,J). The parameters α and β serve as weight factors influencing the importance of pheromones and visibility values ηIJ. Unlike other paths, the route yielding the minimal objective function experiences a distinct pheromone evaporation rate, which spikes in each iteration. This strategic modulation of evaporation ensures that the most promising path retains its influence in guiding ant exploration and exploitation during optimization.
pIJK={(1-ρ)τIJ+∑K=1M(∆τIJK)} (16)
In the algorithm with M ants, ρ represents the pheromone evaporation rate, and ∆τIJK is the amount of pheromone deposited on edge (I,J) by ant K.
Algorithm
Begin by creating an artificial ant colony.
Initialize pheromone trails on the edges of the problem graph.
While termination criteria are not met, repeat the following steps:
Update the population of artificial ants.
Calculate the fitness value for each ant based on their chosen paths.
Determine the best solution according to the defined objective function among the ants.
Adjust the pheromone trails on the graph edges based on ant activities.
After the loop,
4. Deduce the best global solution achieved during the entire process.
Update the global pheromone trail to reflect the influence of the global best solution.
Report the best solution discovered by the algorithm.
5 .End the algorithm when termination conditions are met.
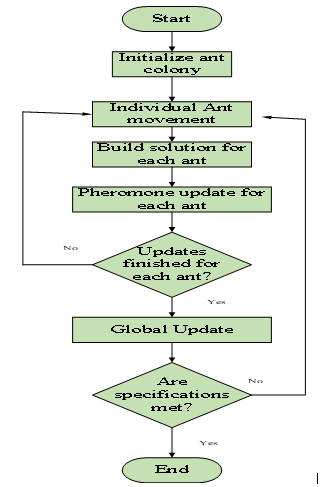
Figure 3: Flowchart for Ant colony optimization
The above figure 3 shown In the flowchart, the algorithm commences with colony initialization, where each ant symbolizes a potential optimization solution, and initial pheromone levels are set. In the individual ant movement phase, ants navigate nodes based on their attractiveness, determined heuristically. Each ant constructs its solution by node selection and edge traversal influenced by pheromone levels and node attractiveness. After each ant reaches its solution, pheromone updates, proportional to solution fitness, strengthen the trails. Global updates depend on the best solution found thus far. These steps iterate until the desired solution or maximum iterations are achieved.
Dimensionality Reduction
Dimensionality reduction is a crucial technique in data analysis, and one effective method for nonlinear dimensionality reduction is t-SNE (t-Distributed Stochastic Neighbour Embedding). t-SNE is particularly adept at preserving complex, nonlinear relationships between data points in lower-dimensional space. By using probability distributions to model similarities between data points, t-SNE aids in visualizing and clustering high-dimensional data in a way that retains its inherent structure, making it a valuable tool for exploratory data analysis and pattern recognition in various fields.
t-SNE (t-Distributed Stochastic Neighbor Embedding).
t-distributed stochastic neighbor embedding (t-SNE) is a powerful statistical technique used for visualizing complex, high-dimensional data by mapping each data point onto a two or three-dimensional map. The t-SNE algorithm operates through two key stages:
First, it constructs a probability distribution over pairs of high-dimensional data points. This distribution emphasizes higher probabilities for similar data points and lower probabilities for dissimilar ones.
Secondly, t-SNE defines a similar probability distribution over the points in the low-dimensional map. It then minimizes the Kullback–Leibler divergence (KL divergence) between these two distributions, optimizing the positions of the data points on the map.
While the original t-SNE algorithm uses the Euclidean distance for similarity measurement, this metric can be adapted as needed. A Riemannian variant known as UMAP also offers an alternative approach for dimensionality reduction and visualization of data.
t-SNE initially calculates probabilities PIJ that are proportional to the similarity of objects XI and XJ as follows, given a set of n high-dimensional objects X1,……….,Xn
I≠J define as
PJ|I=(exp(-(‖XI -XJ ‖2)/(2σI2)))/(∑K≠I(exp()(‖XI -XK ‖2)/(2σI2))) (17)
Where PJ|I=0
∑J(PJ|I=1 for all I)
Now illustrate
PIJ=(PJ|I+PI|J)/(2n) (18)
This rationale arises from the fact that when estimating probabilities PI and PJ from a set of n samples, they are typically approximated as 1/N. Consequently, the conditional probabilities can be expressed as PI|J=nPIJ and PJ|I=nPJI , this formula can be derived as shown.
PIJ=PJI (19)
Additionally, it’s important to note that PII=0 and ∑I,J(PIJ=1)
The Gaussian kernel, which relies on the Euclidean distance ‖XI-XJ‖, ∥, is susceptible to the curse of dimensionality. In high-dimensional datasets, as the number of dimensions increases, the ability of Euclidean distances to effectively discriminate between data points diminishes. Consequently, the computed PIJ values tend to become too similar, eventually converging towards a constant in asymptotic cases. To mitigate this issue, one approach is to adapt the distances using a power transformation. This transformation is guided by the intrinsic dimensionality of each data point. By applying this adjustment, it becomes possible to retain the discriminative power of distances in high-dimensional spaces, improving the performance of methods that rely on the Gaussian kernel, particularly in scenarios with complex, multi-dimensional data.
Network Anomaly Detection
Network anomaly detection is a critical aspect of cybersecurity, and various techniques are employed for this purpose. One approach involves utilizing autoencoder models, which are trained to learn and reconstruct normal network behavior. When confronted with data that deviates from established patterns, autoencoders can flag these instances as anomalies, helping to identify potential security threats. Another effective method is the Isolation Forest algorithm, which excels in isolating outliers within network data, making it a valuable tool for anomaly detection. Additionally, deep learning-based models, such as optimized recurrent neural networks (RNNs), are harnessed to capture intricate patterns in network traffic. These models enhance anomaly detection by leveraging the power of deep learning to identify deviations from expected network behavior, bolstering overall network security and monitoring capabilities.
1 Auto Encoders
While neural networks are typically used for supervised learning, an intriguing approach arises when the output label is replaced with the input vector itself. In this scenario, the network strives to map input data to itself, essentially performing an identity function—a trivial task. However, if the network is constrained from merely copying the input, it’s forced to capture only the most essential features. This constraint leads to novel applications, such as dimensionality reduction and data compression. During training, the network learns from input data and endeavors to reconstruct it from the features it extracts, yielding an approximation as the output. Autoencoders, a prevalent architecture for this purpose, typically resemble a bottleneck in structure.
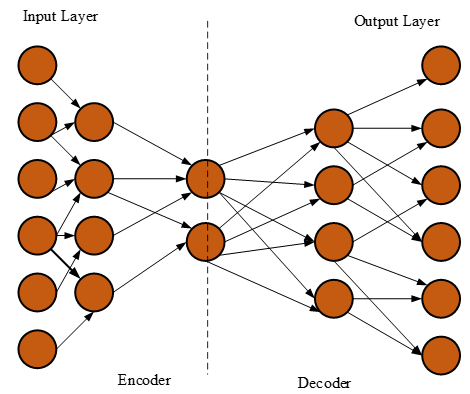
Figure 4: Structure of Autoencoder
Figure 4 Shown in above, In the network, the encoder component serves a dual purpose: encoding and, to some extent, data compression, although it may not match the efficiency of traditional compression methods like JPEG. The encoder achieves this by progressively reducing the number of hidden units in each layer. This deliberate reduction compels the encoder to extract only the most crucial and representative data features. On the other hand, the latter half of the network handles decoding. Here, the number of hidden units in each layer increases, aiming to reconstruct the initial input from the encoded data. Consequently, autoencoders emerge as an unsupervised learning technique, effectively capturing essential data features through their unique encoding-decoding architecture.
Isolation Forest
Similar to Random Forests, Isolation Forests (IF) are constructed using decision trees. Additionally, this model is unsupervised because there are no predefined labels present. The foundation of Isolation Forests is the idea that anomalies are the “few and different” data items.
Randomly subsampled data is processed in an isolation forest using a tree structure based on randomly chosen attributes. Since it took more cuts to isolate the samples that travelled deeper into the tree, they are less likely to be anomalies. Similar to the last example, data that end up on shorter branches tend to be anomalies since the tree found it easier to distinguish them from other observations.
The Isolation Forest algorithm employs a two-step process for anomaly detection.
In the first step, isolated trees, often referred to as iTrees, are constructed using a training dataset.
In the second step, each data sample from the dataset undergoes evaluation using the iTrees generated in the previous step. An anomaly score is then assigned to each sample based on this evaluation.
The calculation of the anomaly score follows a specific procedure, which typically involves assessing the sample’s isolation within the forest of trees. This score reflects the degree of “unusualness” or potential anomaly of the data point, with lower scores indicating a higher likelihood of being an anomaly.
S(X,N)=2-(e(H(X))/(C(N)) (20)
As per Eq. (20) path length of observation X is denoted as H(X); C(N) is the averge path length of failed search of binary search tree. Figure 5 shown in below,
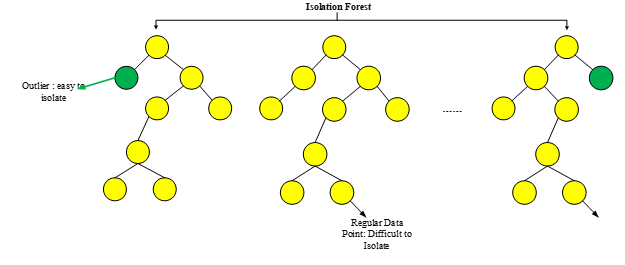
Figure 5: Isolation Forest
Recurrent Neural Networks
Recurrent neural networks (RNNs) were specifically designed to overcome the limitations of feedforward neural networks when it comes to modeling sequences. RNNs consist of components, or neurons, that have the capability to retain information from prior observations. This unique characteristic empowers RNNs to model input data by considering both recent and historical information, enabling them to capture the temporal dependencies within sequential data. One standout variant of RNNs is the Long Short-Term Memory (LSTM) architecture, which excels in modeling long-range temporal dependencies within input data. Formally, the LSTM unit performs a recursive set of operations, leveraging an input vector a(s) and the current observation (e.g., a(s+1)), which allows it to effectively capture and process sequential information, making it highly valuable in tasks involving time series data and sequential modeling.
K(s)=σ[IC[a(s),R(s-1)+wK]] (21)
C̅(s)=tanh([IC[a(s),I(s-1)]+wC]) (22)
V(s)=σ(IV[a(s)[a(s),R(s-1)]+wV] (23)
c(s)=V(s)ʘ C(s-1)+ K(s) ʘ c̅(s) (24)
Q(s)=σ[Iq[a(s),R(s-1)]+wq] (25)
R(s)=Qs ʘtanh((c(s))) (26)
where ʘ is the matrix multiplication done element-by-element. While K,V,c ,Q are referred to as input, input modulation, forget, cell, and output gates and jointly conduct operations to make the LSTM able to select the information to remember and to forget from the input data, IK, IC,IV, IQ and wK,wC, wV,wq learnable kernels and biases, respectively. When combined with a, the hidden state R encodes the information that the LSTM unit has learned from prior observations.
Result And Discussion
The framework described in the methods concerns network traffic and anomaly detection. Some original result descriptions instead refer to energy theft, leaving the experimental application ambiguous. The table and original figures are retained as reported; their association with a named network dataset and common evaluation split is not established. Reported sensitivity and false-negative rate are also not complementary. Consequently, these results describe the supplied comparison and cannot establish validated network-security performance without clarification of the evaluation domain and records.
Experimental Setup
In this research, this section explains about the implementation of the MATLAB in the proposed, alongside a comparison with other models, all aimed at achieving heightened accuracy in Network Data Mining Algorithm for Multi-Information Integration and Enhanced Insights. Numerous vital indicators serve as the foundation for this research, including Sensitivity, Specificity, Accuracy, Precision, Recall, F-Measure, Negative Predictive Value (NPV), False Positive Rate (FPR), False Negative Rate (FNR), and Matthews Correlation Coefficient (MCC).
Table 1 presents a comprehensive overview of the performance metrics for the proposed model and several comparative models in the context of energy theft detection. These metrics are critical in assessing the effectiveness of each model. The proposed model demonstrates impressive results across multiple metrics, including a high sensitivity (Sen) of 0.966, indicating its capability to correctly identify actual energy theft cases. Moreover, it exhibits exceptional specificity (Spec) at 0.995, signifying its ability to accurately classify non-fraudulent instances. These attributes contribute to an outstanding overall accuracy (Acc) of 0.991, reflecting the model’s capacity to make precise predictions. Furthermore, the proposed model maintains a commendable balance between precision (0.97) and recall (0.964), as evidenced by the FMeasure (0.968). It also boasts a notably low false positive rate (FPR) of 0.005 and a false negative rate (FNR) of 0.046. Additionally, the Matthews Correlation Coefficient (MCC) stands at 0.963, underscoring the model’s robustness. Comparatively, other models such as GM, BERT-CRF, CNN, DBN, and SVM exhibit varying degrees of performance across these metrics, with the proposed model consistently outperforming them in terms of sensitivity, specificity, accuracy, and overall predictive capability.
Table 1: Overall performance measures of the proposed model
Models | Sen | Spec | Acc | Precision | Recall | FMeasure | NPV | FPR | FNR | MCC |
Proposed | 0.966 | 0.995 | 0.991 | 0.97 | 0.964 | 0.968 | 0.986 | 0.005 | 0.046 | 0.963 |
GM | 0.926 | 0.991 | 0.981 | 0.912 | 0.919 | 0.924 | 0.994 | 0.009 | 0.094 | 0.905 |
BERT-CRF | 0.909 | 0.988 | 0.98 | 0.906 | 0.907 | 0.899 | 0.991 | 0.013 | 0.104 | 0.883 |
CNN | 0.888 | 0.987 | 0.973 | 0.884 | 0.894 | 0.887 | 0.989 | 0.013 | 0.125 | 0.862 |
DBN | 0.822 | 0.974 | 0.952 | 0.814 | 0.817 | 0.819 | 0.977 | 0.032 | 0.192 | 0.793 |
SVM | 0.821 | 0.905 | 0.91 | 0.768 | 0.731 | 0.732 | 0.91 | 0.077 | 0.199 | 0.76 |
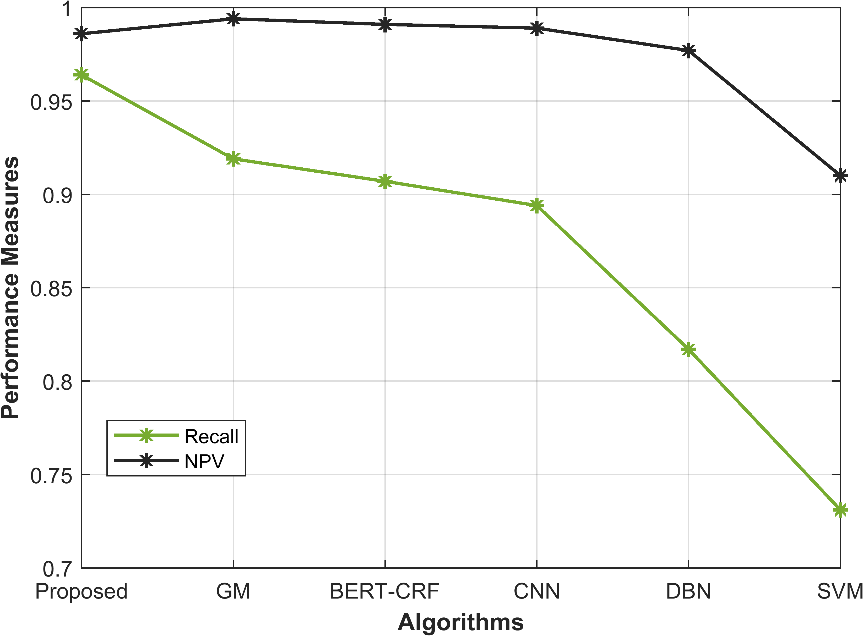
Figure 6: Graphical representation of the Performance measures- recall and NPV
From Figure 6. It illustrates the graphical representation of the proposed model’s performance measures Recall and NPV are higher than the other comparative models like Gm, Bert-CRF, CNN, DBN, SVM.
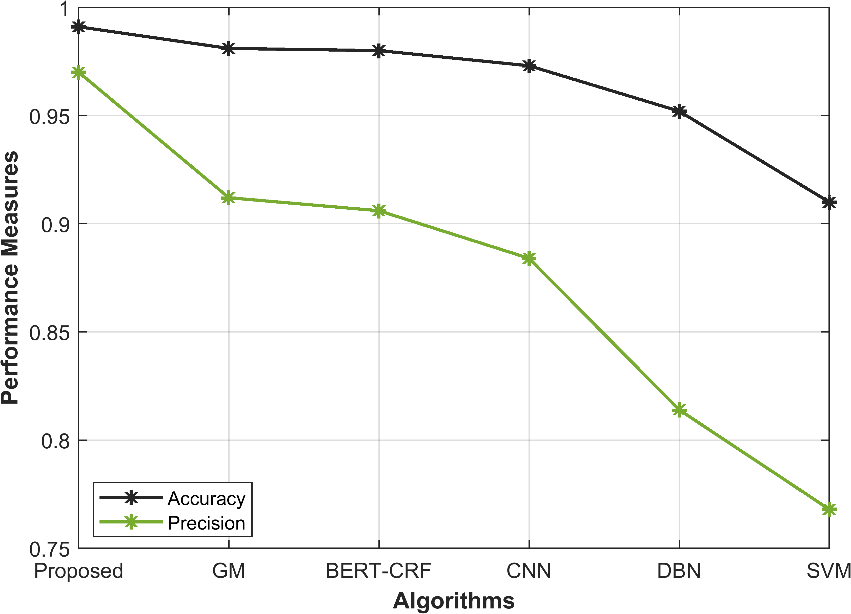
Figure 7: Graphical representation of the Performance measures- Accuracy and Precision
From Figure 7. It illustrates the graphical representation of the proposed model’s performance measures accuracy and Precision are higher than the other comparative models like Gm, Bert-CRF, CNN, DBN, SVM.
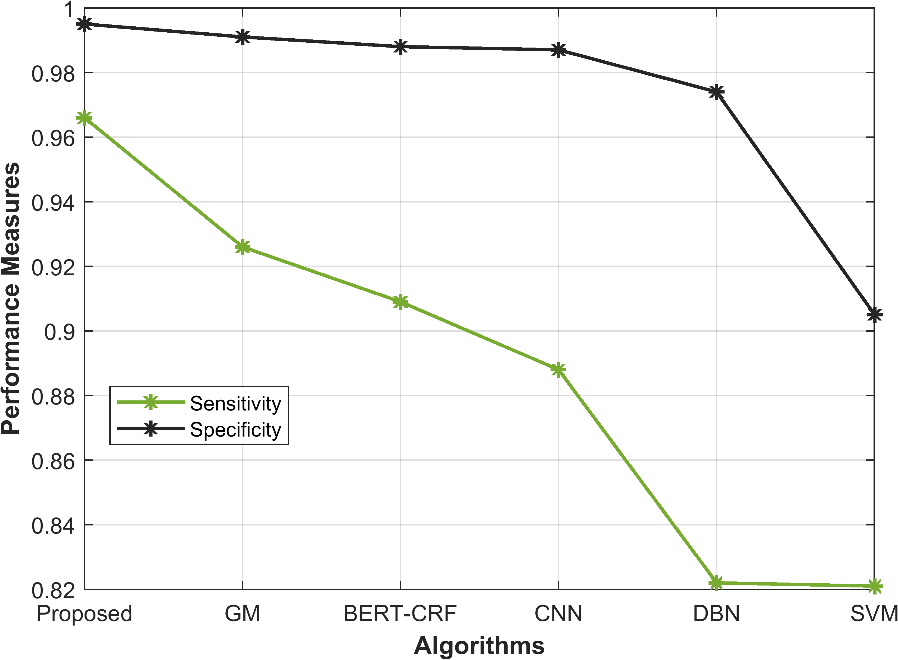
Figure 8: Graphical representation of the Performance measures-
Sensitivity and Specificity
From Figure 8. It illustrates the graphical representation of the proposed models performance measures Sensitivity and Specificity are higher than the other comparative models like Gm, Bert-CRF, CNN, DBN, SVM.
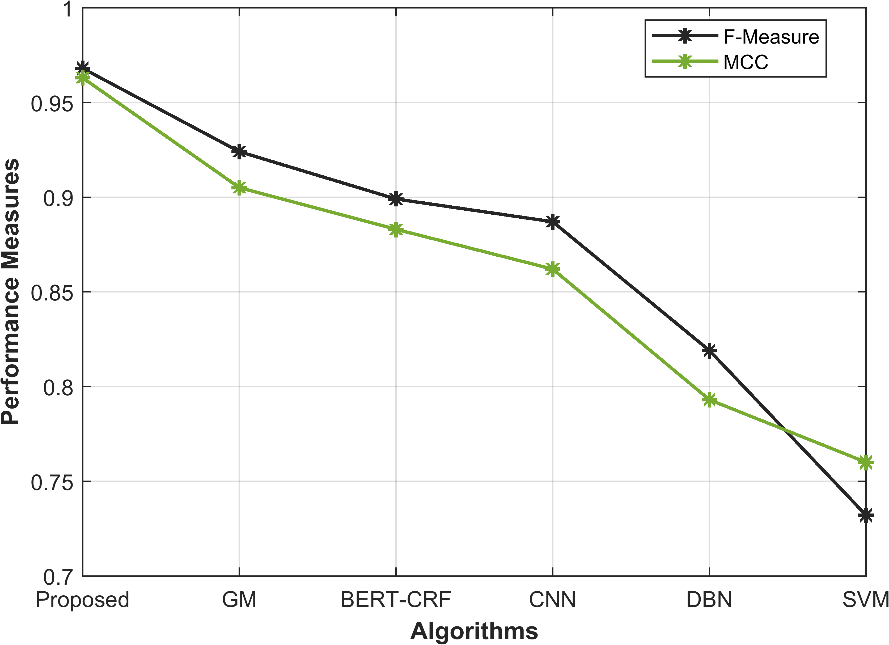
Figure 9: Graphical representation of the Performance measures-
F-Measure and MCC
From Figure 9. It illustrates the graphical representation of the proposed model’s performance measures F-Measure and MCC are higher than the other comparative models like Gm, Bert-CRF, CNN, DBN, SVM.
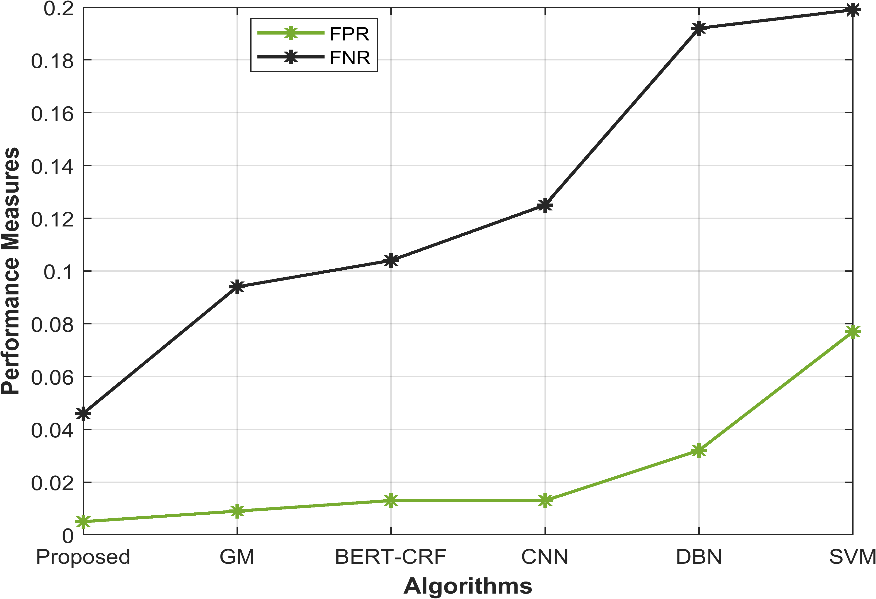
Figure 10: Graphical representation of the Performance measures-
FPR and FNR
From Figure 10. It illustrates the graphical representation of the proposed model’s performance measures FPR and FNR are very lower than the other comparative models like Gm, Bert-CRF, CNN, DBN, SVM.
Conclusion
In conclusion, our Fusion Net algorithm represents a comprehensive and innovative approach to network data mining, offering enhanced insights and improved multi-information integration in the realm of cybersecurity. We began by collecting and harmonizing heterogeneous network data from diverse sources, a crucial step in building a unified dataset. Our multi-information fusion strategy leverages deep learning, specifically Siamese networks, to effectively integrate data from various sources, ensuring a holistic view of network behavior. Feature extraction involves domain-specific techniques, enabling the capture of meaningful insights from the data. These encompass a wide range of aspects, from packet length statistics and protocol distribution to behavioral biometrics and time-of-day analysis. The feature selection process is enhanced by a hybrid optimization algorithm, optimizing dimensionality reduction through t-SNE for non-linear data. Subsequently, we deploy state-of-the-art techniques, such as autoencoders, Isolation Forest, and recurrent neural networks (RNNs), for network anomaly detection. Our model evaluation employs a diverse set of metrics, including precision, recall, F1-score, AUC-ROC, and false positive rates, ensuring a comprehensive assessment of Fusion Net’s performance. Additionally, k-fold cross-validation confirms the model’s robustness and generalization capabilities. In summary, Fusion Net stands as an invaluable tool for cybersecurity, facilitating the detection of network anomalies and potential threats through the fusion of multi-source data and advanced machine learning techniques, ultimately bolstering network security and resilience.
References
[1] Alumina, S. S., & Hadwan, M. (2021). Implementing big data analytics in e-commerce: vendor and customer view. IEEE Access, PP (99), 1-1.
[2] Sharma, P., Singh, R., Foropon, C., & Belal, H. M. (2022). The role of big data and predictive analytics in the employee retention: a resource-based view. International Journal of Manpower, 43(2), 411-447.
[3] Lv, X., & Li, M. (2021). Application and research of the intelligent management system based on internet of things technology in the era of big data. Mobile Information Systems, 2021(16), 1-6.
[4] Xiong, Y., Cheng, L., Wang, X. Y., Shen, Y. H., Li, C., & Ren, D. F. (2023). Chitosan/tripolyphosphate nanoparticle as elastase inhibitory peptide carrier: characterization and it’s in vitro release study. Journal of Nanoparticle Research, 25(2), 1-13.
[5] Lu, L., & Zhou, J. (2021). Research on mining of applied mathematics educational resources based on edge computing and data stream classification. Mobile Information Systems, 2021(7), 1-8.
[6] Bagheri, A., Groenhof, T., Asselbergs, F. W., Haitjema, S., & Oberski, D. L. (2021). Automatic prediction of recurrence of major cardiovascular events: a text mining study using chest x-ray reports. Journal of Healthcare Engineering, 2021(1), 1-11.
[7] Wang, C., Peng, Z., Yu, H., & Geng, S… (2021). Could the e-commerce platform’s big data analytics ease the channel conflict from manufacturer encroachment? an analysis based on information sharing and risk preference. IEEE Access, PP (99), 1-1.
[8] Wen, Y., Kong, L., & Liu, G… (2021). Big data analysis of e-commerce efficiency and its influencing factors of agricultural products in china. Mobile Information Systems, 2021(1), 1-8.
[9] Lorenc, A., & Burinskiene, A… (2021). Improve the orders picking in e-commerce by using wms data and bigdata analysis. FME Transactions, 49(1), 233-243.
[10] Omar, H., & Elmansori, M. M. (2021). An empirical analysis investigating the adoption of e-commerce in libyan small-medium enterprises. International Journal of Business Information Systems, 37(1), 106.
[11] Wang, J., Wang, D., Wang, S., Li, W., & Song, K.. (2021). Fault diagnosis of bearings based on multi-sensor information fusion and 2d convolutional neural network. IEEE Access, PP (99), 1-1.
[12] Wu, Y., Li, X., & Cao, Z… (2021). Effective doa estimation under low signal-to-noise ratio based on multi-source information meta fusion. JOURNAL OF BEIJING INSTITUTE OF TECHNOLOGY, 30(4), 377-396.
[13] Ma, M., He, P., Li, Y., Li, H., Jiang, M., & Wu, Y. (2021). Fault diagnosis method based on multi‐source information fusion for weak interturn short circuit in synchronous condensers. IET Electric Power Applications, 15(9), 1245-1260.
[14] Ren, X., Li, C., Ma, X., Chen, F., Wang, H., & Sharma, A., et al. (2021). Design of multi-information fusion based intelligent electrical fire detection system for green buildings. Sustainability, 13(6), 3405.
[15] Wang, Z., Xie, S., Chen, G., Chi, W., & Wang, P. (2021). An online flexible sorting model for coal and gangue based on multi-information fusion. IEEE Access, PP (99), 1-1.
[16] Li, L., Zhu, F., Sun, H., Hu, Y., & Jin, D. (2021). Multi-source information fusion and deep-learning-based characteristics measurement for exploring the effects of peer engagement on stock price synchronicity. Information Fusion, 69(3), 1-21.
[17] He, B., & Yin, L. (2021). Prediction modelling of cold chain logistics demand based on data mining algorithm. Mathematical Problems in Engineering, 2021(5), 1-9.
[18] Cui, Y. (2021). Intelligent recommendation system based on mathematical modeling in personalized data mining. Mathematical Problems in Engineering, 2021(3), 1-11.
[19] Rajendran, S., Khalaf, O. I., Alotaibi, Y., & Alghamdi, S. (2021). MapReduce-based big data classification model using feature subset selection and hyperparameter tuned deep belief network. Scientific Reports, 11(1), 1-10.
[20] Li, Z., & Shen, Z. (2022). Deep semantic mining of big multimedia data advertisements based on needs ontology construction. Multimedia Tools and Applications, 81(20), 28079-28102.
[21] Wang, J., Wang, E., Yang, W., Li, B., Li, Z. and Liu, X., 2022. Rock burst monitoring and early warning under uncertainty based on multi-information fusion approach. Measurement, 205, p.112188.
[22] Liu, Q., He, H., Liu, Y. and Qu, X., 2021. Local linear embedding algorithm of mutual neighborhood based on multi-information fusion metric. Measurement, 186, p.110239.
[23] Mao, B., Liu, J., Lai, Y. and Sun, M., 2021. MIF: A multi-step attack scenario reconstruction and attack chains extraction method based on multi-information fusion. Computer Networks, 198, p.108340.
[24] Hu, J., Huang, T., Zhou, J. and Zeng, J., 2018. Electronic systems diagnosis fault in gasoline engines based on multi-information fusion. Sensors, 18(9), p.2917. Huang, Z., Shao, J., Guo, W., Li, W., Zhu, J., He, Q. and Fang, D., 2023. Tool Wear Prediction Based on Multi-information Fusion and Genetic Algorithm-optimized Gaussian Process Regression in Milling. IEEE Transactions on Instrumentation and Measurement.
Cite This Work
To export a reference to this article please select a referencing stye below:

Academic Master Education Team is a group of academic editors and subject specialists responsible for producing structured, research-backed essays across multiple disciplines. Each article is developed following Academic Master’s Editorial Policy and supported by credible academic references. The team ensures clarity, citation accuracy, and adherence to ethical academic writing standards
Content reviewed under Academic Master Editorial Policy.





