
 Math
MathTextbook
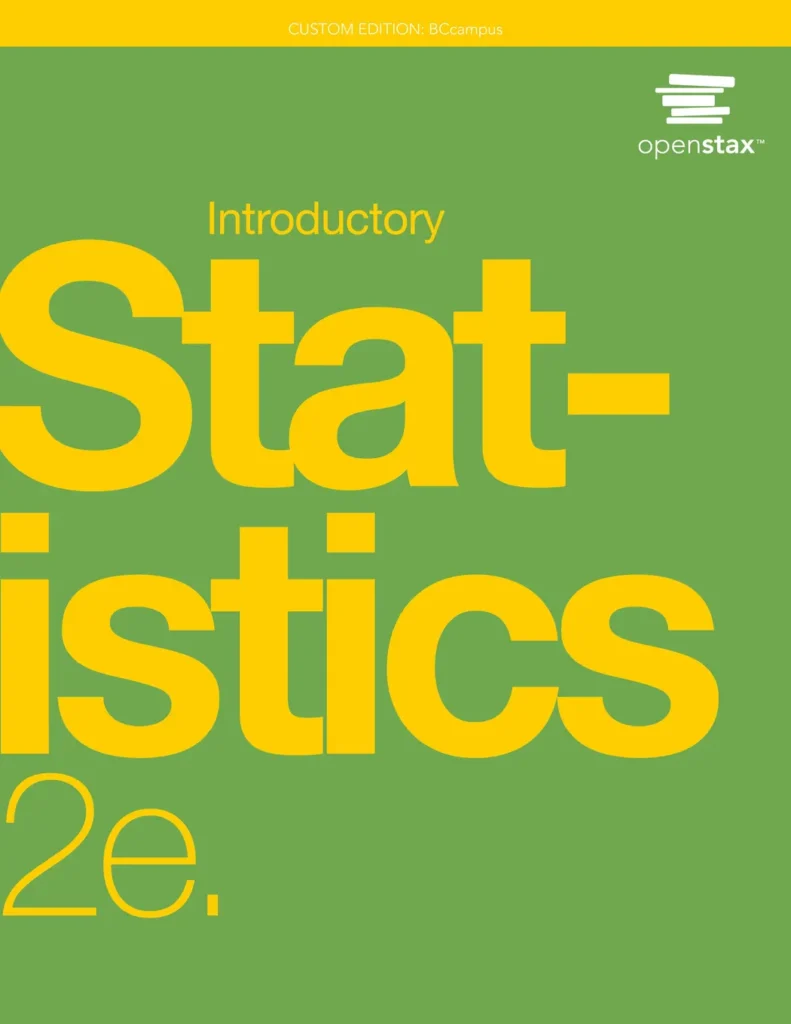
Introductory Statistics 2e
Not rated yetRate this bookIntroductory Statistics 2e develops statistical reasoning through data collection, probability models, inference, and relationships between variables. Its thirteen chapters combine explanations with experiments and practical activities. This guide follows the general statistics edition, where regression is chapter 12 and ANOVA is chapter 13, and distinguishes it from the separate business-statistics textbook. The emphasis is on identifying the question and data structure, checking assumptions, carrying out an analysis, and explaining what the evidence does and does not support.
Free reading is available at the official source. Opens in a new tab.
 Free
About this book
Introductory Statistics 2e develops statistical reasoning through data collection, probability models, inference, and relationships between variables. Its thirteen chapters combine explanations with experiments and practical activities. This guide follows the general statistics edition, where regression is chapter 12 and ANOVA is chapter 13, and distinguishes it from the separate business-statistics textbook. The emphasis is on identifying the question and data structure, checking assumptions, carrying out an analysis, and explaining what the evidence does and does not support.
Chapter-wise summaries and reading tasks
Chapter 1 Sampling and Data
Statistical work begins with a clearly defined population, a sample, and variables that represent the question of interest. The chapter introduces the difference between a parameter and a statistic, types of data, frequency summaries, measurement levels, and ethical data collection. A sample’s usefulness depends on how it was obtained, not only its size. Experiments and observational studies support different conclusions, and random sampling should not be confused with random assignment. The practical activities make variation visible by comparing samples. Readers should record the unit of observation and selection process before considering any calculation, because later inference cannot repair a fundamentally unrepresentative design.
Study task. Design a small data-collection study and specify population, sampling unit, variables, and method. Explain whether its design supports a causal conclusion.
Chapter 2 Descriptive Statistics
Descriptive statistics make a dataset’s pattern visible through graphs and numerical summaries. The chapter connects stem plots, histograms, time-series displays, and box plots with location, centre, skewness, and spread. The same average can represent very different distributions, so a measure of centre should usually be interpreted with variability and shape. Quartiles and outliers depend on a clear definition and context rather than automatically identifying errors. Graph scales and groupings can change an impression without changing the data. A useful summary explains why its chosen display and statistics suit the variable and the question.
Study task. Describe one dataset using a graph, a centre measure, and a spread measure. Explain how an extreme observation affects your account and whether it should be removed.
Chapter 3 Probability Topics
Probability formalizes uncertainty through events, outcomes, and rules for combining them. Independence describes whether information about one event changes the probability of another; mutual exclusivity describes whether both can occur together. Contingency tables, trees, and Venn diagrams reveal different aspects of those relationships. Addition rules address alternatives and overlap, while multiplication rules account for joint occurrence under the appropriate conditional information. A diagram can expose an error that is hard to notice in a formula alone. The chapter prepares readers to distinguish probabilities attached to data under a model from statements about the model’s truth.
Study task. Represent one event problem with both a table and a tree. Calculate a joint and conditional probability and explain why independence and exclusivity are different.
Chapter 4 Discrete Random Variables
A discrete random variable assigns numerical values to countable outcomes. Its probability distribution supports calculation of expected value and variability, but those summaries do not predict one guaranteed result. The chapter compares binomial, geometric, hypergeometric, and Poisson models through the processes that generate observations. Fixed trials differ from waiting until a first success, and sampling without replacement differs from independent repeated trials. Model choice should follow those distinctions rather than the mere appearance of whole-number data. The experiments with cards and dice provide opportunities to compare theoretical probabilities with observed relative frequencies.
Study task. Construct a small discrete distribution and verify that its probabilities sum to one. Choose between two candidate distributions for a scenario and justify the generating assumptions.
Chapter 5 Continuous Random Variables
Continuous variables describe quantities measured over intervals. Probability is represented by area under a density, so the height of the curve is not itself a probability and a single exact value has zero probability in the model. Uniform and exponential distributions illustrate different patterns: equal density over a bounded interval versus a waiting-time structure with a particular decreasing density. Their assumptions should be connected with the application. The chapter’s activities encourage readers to visualize the requested interval before calculating. This geometric interpretation provides the foundation for normal models and later sampling distributions.
Study task. Sketch a uniform and an exponential density and shade a stated interval on each. Explain what the area means and why comparing curve heights alone can mislead.
Chapter 6 The Normal Distribution
The normal distribution describes symmetric continuous variation using a mean and standard deviation. Standardization maps an observation to its signed distance from the mean in standard-deviation units. This makes it possible to obtain probabilities or find cutoffs using one standard reference distribution. The practical examples connect the model with measurements, while also requiring attention to whether the observed shape is reasonably compatible with normality. Calculating a tail area and finding a percentile reverse the direction of the problem. A sketch helps identify the region and detect a result that cannot plausibly answer the question.
Study task. For a normal model, distinguish an observation, a z-score, a percentile, and a probability. Solve one cutoff problem and one area problem and check both with sketches.
Chapter 7 The Central Limit Theorem
The central limit theorem concerns the behaviour of statistics across repeated samples, not a promise that all raw data become normally distributed. The chapter develops sampling distributions for means and sums and explains how their variability relates to sample size. Appropriate independence and sample conditions are essential. The practical activities show how repeated averages differ from individual observations. Separating the population distribution, one observed sample, and the theoretical sampling distribution resolves many later errors in confidence intervals and hypothesis tests. A larger sample can reduce random uncertainty without removing systematic selection or measurement bias.
Study task. Sketch a skewed population and several sampling distributions of its mean for increasing sample sizes. Explain which distribution the central limit theorem describes.
Chapter 8 Confidence Intervals
Confidence intervals express uncertainty about a population quantity using a method with a stated long-run coverage rate. The chapter treats a mean with suitable normal or t procedures and a population proportion, then applies the ideas in several contexts. Choosing the method depends on the parameter, available variance information, design, and assumptions. The margin of error reflects both uncertainty and the selected confidence level. It should not be interpreted as a guarantee about an individual observation. A complete report identifies the target population, units, interval, confidence level, and limitations of the data collection process.
Study task. Choose an interval method for a mean and one for a proportion. Explain how sample size and confidence level affect width and what the confidence statement actually refers to.
Chapter 9 Hypothesis Testing with One Sample
One-sample hypothesis testing compares observed evidence with a specified null model. The chapter develops null and alternative hypotheses, test distributions, p-values, decision rules, and Type I and Type II errors. A p-value is calculated under assumptions that include the null hypothesis; it is not the probability that the null is true. Failing to reject also differs from proving equality or absence of an effect. The practical meaning of a conclusion depends on the size of the observed difference and the study context, not solely on crossing a significance threshold. The full examples connect those steps into one defensible argument.
Study task. Write hypotheses for a single mean or proportion, identify the possible decision errors in context, and explain a hypothetical p-value without treating it as a probability of the hypothesis.
Chapter 10 Hypothesis Testing with Two Samples
Two-sample inference asks whether populations differ while accounting for how the observations are related. Independent samples and matched pairs require different analyses; paired data are analysed through within-pair differences rather than treated as unrelated groups. The chapter considers means with different variance-information conditions and independent proportions. Checking design and assumptions comes before selecting a formula. Statistical evidence about a difference does not automatically establish a treatment effect when the groups were not appropriately assigned. Reporting an estimated difference and uncertainty helps readers understand magnitude as well as the test decision.
Study task. Compare a before-and-after study with a study of two unrelated groups. Identify the analysis unit and explain why using an independent-samples method on paired data discards relevant information.
Chapter 11 The Chi-Square Distribution
Chi-square methods use distributions of nonnegative statistics to compare observed patterns with model-based expectations. The chapter distinguishes goodness of fit, independence, homogeneity, and a test concerning one variance. These procedures answer different questions even when some use similar calculations. Expected counts, category definitions, and sampling design affect validity. A significant categorical result indicates a departure from the specified model but does not identify every category responsible without further examination. The laboratory activities reinforce the link between the question, table structure, degrees of freedom, and conclusion.
Study task. Choose between goodness of fit and independence for two scenarios. Construct expected counts for a simple table and explain what a significant overall result would establish.
Chapter 12 Linear Regression and Correlation
Regression models a response as related to an explanatory variable, while correlation summarizes linear association. The chapter begins with equations and scatterplots before estimating a line, assessing correlation, predicting, and examining outliers. Residuals reveal departures from the fitted pattern and should be inspected rather than hidden behind one coefficient. Predictions outside the observed range can be unreliable even when the fit within the sample is strong. An association is not a causal explanation. Readers should interpret slope in units and distinguish uncertainty about an average response from the variability of individual observations around it.
Study task. Fit a simple line, interpret its slope and intercept, and inspect residuals. Explain why extrapolation and a causal claim require more justification than a large correlation.
Chapter 13 F Distribution and One-Way ANOVA
One-way ANOVA compares several population means through variation between groups relative to variation within groups. The F distribution supplies the reference for the relevant ratio under the null model and assumptions. The chapter also considers comparison of two variances. A significant ANOVA indicates that the all-equal-means claim is not supported; it does not show that every pair differs or identify the responsible groups by itself. Repeatedly performing many unadjusted pairwise tests changes error risk. The laboratory work helps readers connect the source of variation, degrees of freedom, test result, and practical context.
Study task. Explain an ANOVA table in words and identify what its overall test can conclude. State what additional analysis would be needed before claiming a particular pair of means differs.
How to study this book
- Identify the observational unit, variable types, target parameter, and sampling or experimental design before selecting a method.
- Sketch distributions and requested probability regions before using tables or software.
- Record assumptions and inspect relevant displays instead of treating a software output as self-validating.
- Report effect estimates and uncertainty alongside test decisions and distinguish statistical from practical importance.
- Use the source experiments to compare theoretical predictions with repeated observations and keep a log of interpretation errors.
Questions for reflection
- Why can a large sample still produce a biased estimate?
- How does a confidence interval differ from a range containing most individual observations?
- What design information is necessary before comparing two groups?
Source edition and coverage
All thirteen main chapters of OpenStax Introductory Statistics 2e are covered in source order, including regression in chapter 12 and ANOVA in chapter 13. This original study guide explains the source in new wording and adds learning activities. Read the publisher’s book and complete exercises.
About access & copyright
This page provides book information and study material. Full-text access is provided by the original publisher or authorised source; a listing does not grant permission to republish the book.
Read our Library Access & Copyright policyExplore the contents
Check the chapters covered in this edition.
Visit the official source
See reading, preview or purchase options.
Save for later
Keep this textbook in your saved collection.
Reader ratings & reviews
Share your thoughts
Your review helps other students choose the right resources.
KEEP LEARNING
Your next great read
Math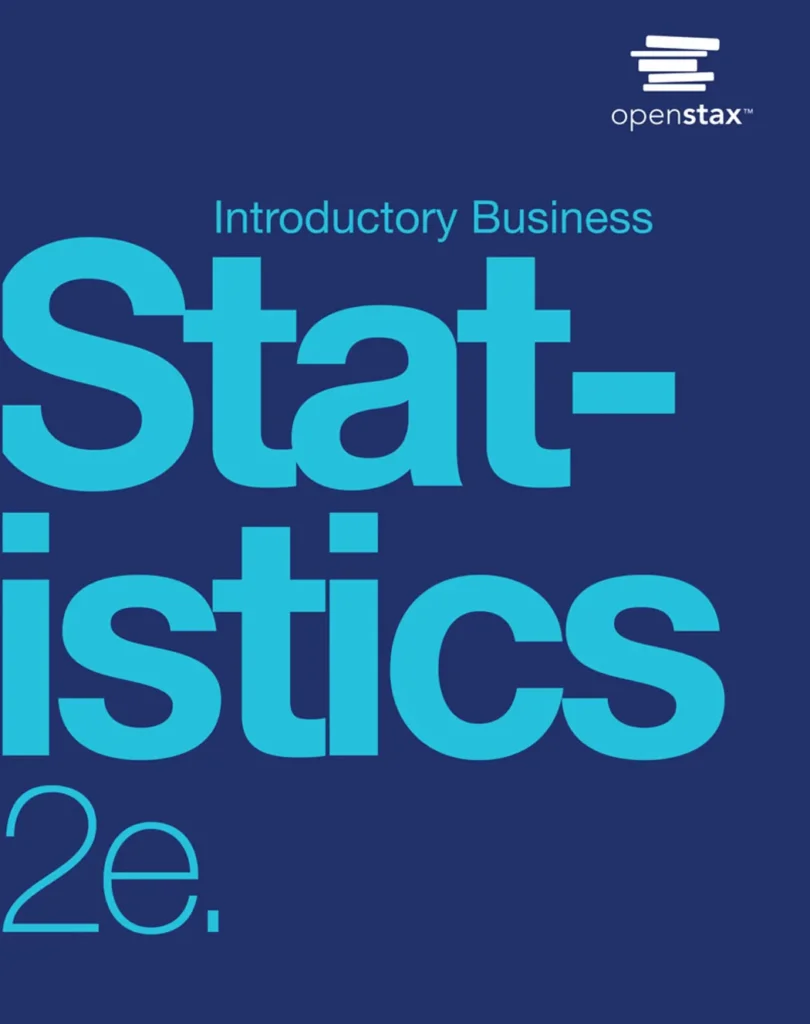 Business
Introductory Business Statistics 2e
View Introductory Business Statistics 2e — book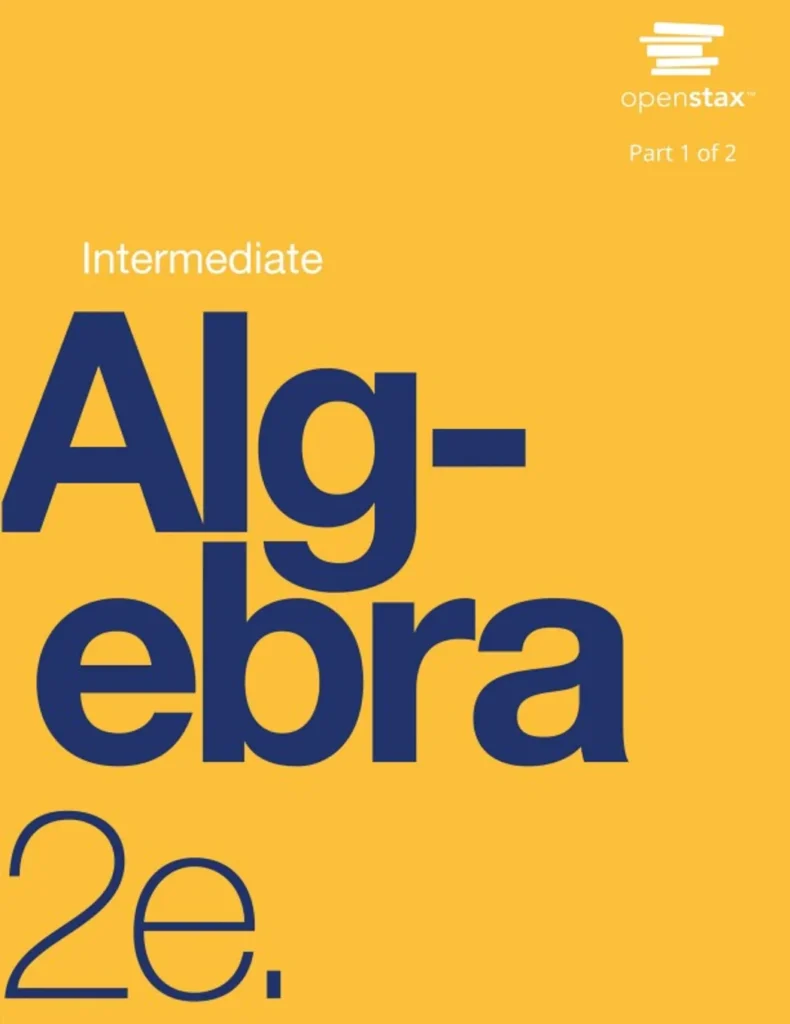 Math
Intermediate Algebra 2e
View Intermediate Algebra 2e — book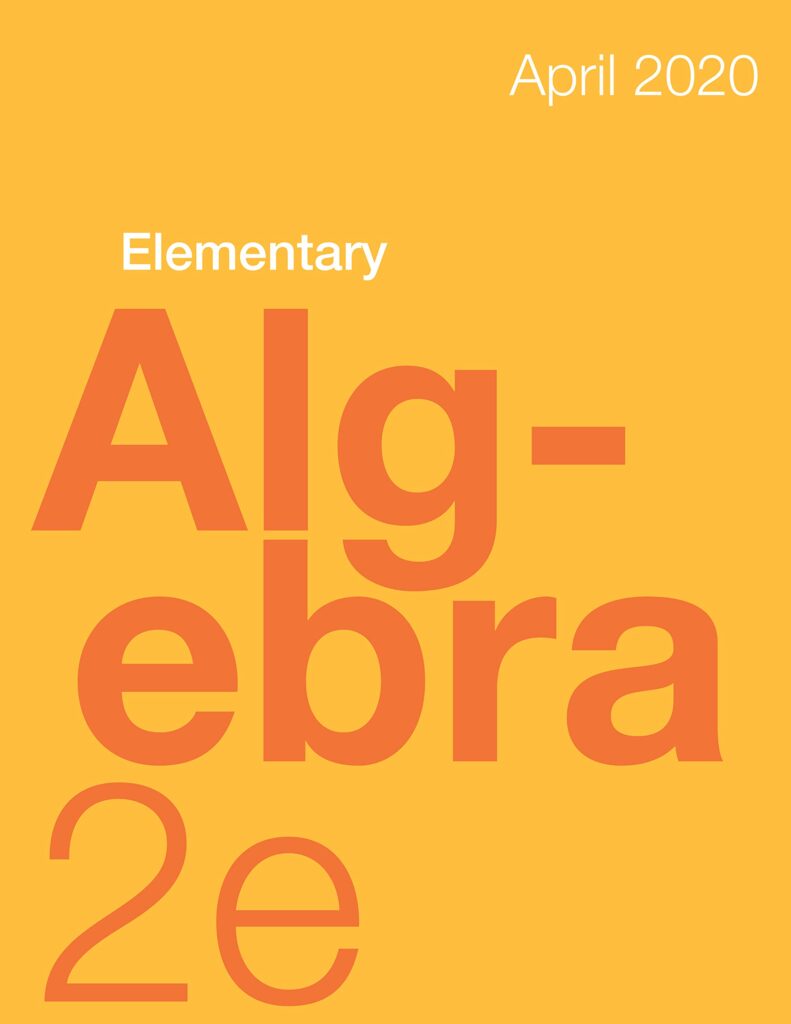 Math
Elementary Algebra 2e
View Elementary Algebra 2e — book Math
Contemporary Mathematics
View Contemporary Mathematics — book Math
College Algebra 2e with Corequisite Support
View College Algebra 2e with Corequisite Support — book Math
College Algebra 2e
View College Algebra 2e — book Math
Calculus Volume 3
View Calculus Volume 3 — book Math
Calculus Volume 1
View Calculus Volume 1 — book Math



