
 Math
BusinessTextbook
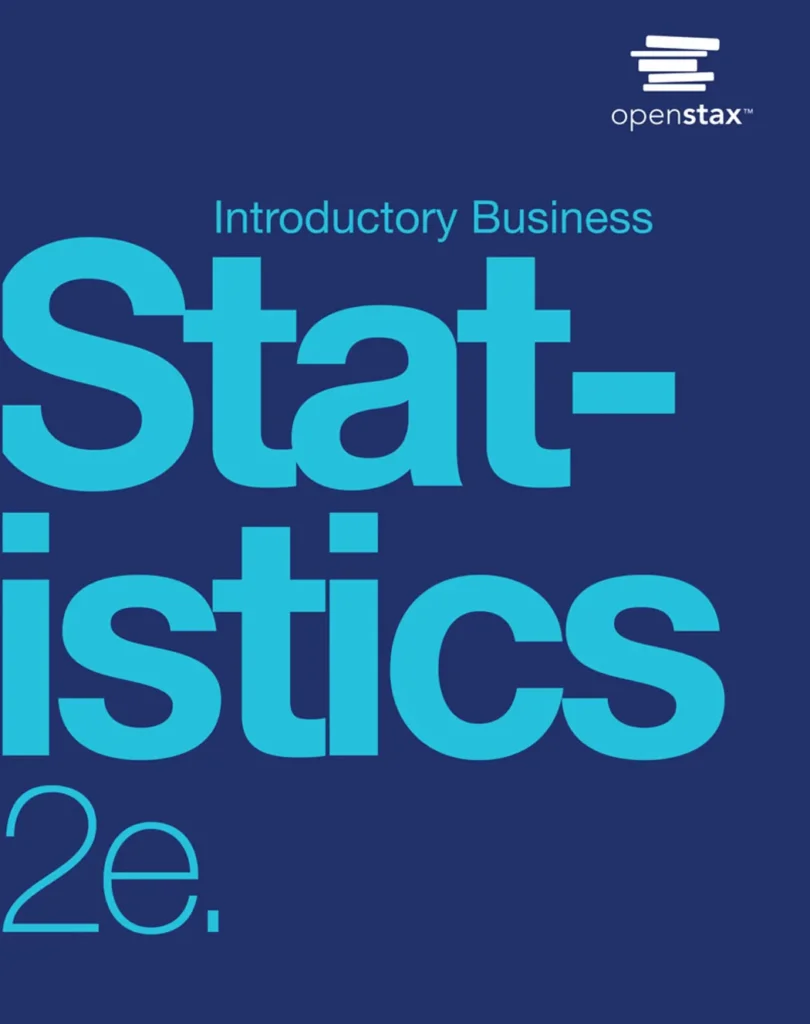
Introductory Business Statistics 2e
Not rated yetRate this bookIntroductory Business Statistics 2e connects quantitative evidence with business questions about variation, risk, estimates, comparisons, and relationships. The thirteen chapters include business-specific emphases such as geometric means, finite population correction, sample-size planning, effect size, elasticity, and Excel regression. This guide follows the business edition’s order, with ANOVA in chapter 12 and regression in chapter 13, and links calculation with decisions that must also account for assumptions, costs, and practical consequences.
Free reading is available at the official source. Opens in a new tab.
 Free
About this book
Introductory Business Statistics 2e connects quantitative evidence with business questions about variation, risk, estimates, comparisons, and relationships. The thirteen chapters include business-specific emphases such as geometric means, finite population correction, sample-size planning, effect size, elasticity, and Excel regression. This guide follows the business edition’s order, with ANOVA in chapter 12 and regression in chapter 13, and links calculation with decisions that must also account for assumptions, costs, and practical consequences.
Chapter-wise summaries and reading tasks
Chapter 1 Sampling and Data
Business data represent particular transactions, customers, employees, or other units, and the unit determines what an analysis can reasonably say. The chapter defines populations, samples, statistics, parameters, measurement levels, and ethical study design. A convenient customer list may exclude precisely the people whose experience a decision should consider. Numerical codes can label categories without having an arithmetic meaning. Observational records also differ from a planned experiment in the strength of their causal implications. Before calculating a KPI or sample average, the analyst should establish the target question, the source and coverage of the records, and the privacy and fairness implications of their use.
Study task. Frame a customer-service question and define its population, unit, variables, and collection method. Identify one coverage problem and one ethical consideration.
Chapter 2 Descriptive Statistics
Business summaries need to show both a typical value and the variability surrounding it. The chapter develops graphical displays, position measures, arithmetic and geometric means, skewness, and spread. Sigma notation helps express calculations compactly, while the geometric mean is relevant to multiplicative change under suitable conditions rather than an interchangeable alternative to every average. Skewed transaction or income data can make a mean a poor description of the typical case. A report should explain the statistic’s business meaning and retain units. The choice of summary should reflect how the quantity is generated and which comparison the decision requires.
Study task. Compare arithmetic and geometric summaries for a sequence of positive growth factors. Explain which question each addresses and why averaging percentage changes can be misleading.
Chapter 3 Probability Topics
Probability supports business reasoning about uncertain events, including overlap and conditional information. The chapter uses tables, trees, and Venn diagrams to distinguish unions, intersections, independence, and mutual exclusivity. A customer’s probability of buying after receiving an offer is a conditional question and need not equal the overall purchase probability. Independence is an assumption about information, not a synonym for events being different. Explicit event definitions prevent double counting or using the wrong denominator. These tools turn a verbal risk question into a transparent calculation whose assumptions can be challenged.
Study task. Build a table of offer exposure and purchase outcome. Calculate an overall, joint, and conditional probability and explain which comparison would still be insufficient to demonstrate a causal marketing effect.
Chapter 4 Discrete Random Variables
Count models translate different business processes into distinct probability distributions. Hypergeometric models fit finite-population sampling without replacement, binomial models fit suitable repeated success/failure trials, geometric models address waiting for a first success, and Poisson models describe counts under particular occurrence assumptions. The same observed count does not by itself determine which distribution is appropriate. The analyst must identify the process, time or trial basis, and parameter meanings. Software functions also distinguish exact values from cumulative probabilities, so a clearly worded event is essential before entering a calculation.
Study task. Compare quality-inspection sampling with the number of arrivals in a time interval. Specify candidate models, parameter units, and assumptions that would need to be checked.
Chapter 5 Continuous Random Variables
Continuous models describe quantities such as time or amount through probability density over intervals. The chapter develops general density properties, the bounded uniform distribution, and the exponential waiting-time model. A probability corresponds to area, not the density’s height at one point. The exponential model’s particular assumptions should be justified by the process rather than selected simply because all waiting times are positive. A uniform model likewise assumes equal density throughout its range, a stronger claim than knowing minimum and maximum values. Drawing the event region helps connect a business question with the correct cumulative or interval calculation.
Study task. Propose a waiting-time application and assess whether uniform or exponential assumptions make sense. Sketch the probability that the wait falls between two limits.
Chapter 6 The Normal Distribution
Normal models organize variation around a mean with a specified standard deviation. Standardization permits comparisons and probability calculations across different business scales. The chapter also considers using a normal approximation for a binomial quantity when its conditions are appropriate. That approximation does not change the underlying discrete process and may require careful treatment of boundaries. A tail probability, central interval, and percentile ask different questions even when they use the same distribution. Checking the model against context and data is more important than obtaining a highly precise number from an unsuitable assumption.
Study task. Use a sketch to distinguish a service-performance cutoff from a probability of exceeding it. Explain what conditions would make a normal approximation to a count model questionable.
Chapter 7 The Central Limit Theorem
The central limit theorem explains why sample means or proportions can have more predictable distributions than individual business observations. The chapter relates standard errors to sample size and includes finite population correction for suitable sampling without replacement. Sampling a substantial share of a small workforce is different from selecting the same number from a vast customer base. A more precise estimate is not necessarily a less biased one, so selection and measurement still require attention. Distinguishing individual variation from uncertainty in an estimate is essential when planning a survey or interpreting an average.
Study task. Compare surveys with the same sample size drawn from a small and a large population. Explain when sampling fraction matters and distinguish standard deviation from standard error.
Chapter 8 Confidence Intervals
Interval estimation expresses uncertainty about a population mean or proportion and supports planning for desired precision. The chapter contrasts procedures based on known or unknown population variability and develops sample-size calculations. Increasing confidence and tightening the desired margin of error place different demands on sample size. An interval does not remove nonresponse or coverage errors, and a planning calculation rests on assumptions about variability or proportions. Business reports should connect the statistical interval with the actual decision threshold and the cost of uncertainty. A complete interpretation states the target population and the data-collection conditions under which the interval is justified.
Study task. Plan a survey for a specified margin of error and confidence level. Explain which assumptions enter the sample-size calculation and which sources of error it does not address.
Chapter 9 Hypothesis Testing with One Sample
One-sample tests assess evidence about a stated benchmark for a population mean or proportion. The chapter develops hypotheses, reference distributions, decision errors, and worked analyses. Choosing the alternative should reflect the question before examining the outcome rather than switching direction after seeing the data. A significance level describes a procedure’s error control under assumptions, while the p-value describes evidence relative to the null model. Neither directly measures the financial importance of a deviation. A business decision should therefore consider magnitude, uncertainty, and consequences alongside the statistical result.
Study task. Formulate a benchmark test for a business process. Explain Type I and Type II errors in operational terms and identify why their costs might differ.
Chapter 10 Hypothesis Testing with Two Samples
Comparing business groups requires distinguishing independent samples from matched observations and identifying what parameter differs. The chapter covers mean and proportion comparisons, variance assumptions, paired samples, and effect-size interpretation. Statistical significance can occur for a small difference in a large sample, while a meaningful difference may remain uncertain in a small one. Cohen-style reference values offer context but should not replace business judgement about worthwhile change. A before-and-after design also raises different questions from independent groups, particularly when other conditions changed over time. Reporting the estimated difference and its uncertainty makes the conclusion more useful.
Study task. Compare an independent branch study with a paired before-and-after employee study. Identify the appropriate unit of analysis and define a practically meaningful difference before testing.
Chapter 11 The Chi-Square Distribution
Chi-square procedures address several business questions involving categorical patterns or a population variance. Goodness of fit compares one observed distribution with specified expectations, independence examines association within a contingency table, and homogeneity compares distributions across populations. Similar arithmetic does not make those questions identical. Expected counts and the study design affect validity, and percentages must be interpreted with their underlying denominators. An overall significant result signals a pattern requiring explanation rather than proving which operational mechanism caused it. The analysis should retain the distinction between statistical association and a justified causal recommendation.
Study task. Choose a chi-square procedure for customer-category data and explain the sampling design. Calculate an expected count and state what an overall significant result would not establish.
Chapter 12 F Distribution and One-Way ANOVA
The F distribution supports comparison of variances and the one-way ANOVA framework. ANOVA assesses whether observed differences among group means are large relative to within-group variation under its assumptions. It is useful for comparing several business conditions without interpreting a collection of unadjusted pairwise tests as one controlled overall procedure. A significant result does not identify every differing pair or establish that group membership caused the outcome. The practical interpretation must consider design, effect size, and the actual differences of interest. Graphical inspection and variance considerations remain important alongside the table of calculated values.
Study task. Outline a comparison of several service methods using ANOVA. Explain the roles of between-group and within-group variation and what follow-up would be needed after a significant result.
Chapter 13 Linear Regression and Correlation
Regression connects a response with an explanatory variable and supports conditional prediction within an appropriate range. The chapter develops correlation, fitting and testing a line, prediction, logarithmic transformations, elasticity interpretation, and Excel analysis. Coefficients have meanings determined by the model’s scale, so a log-transformed relationship cannot be read as if it used the original units unchanged. Residual patterns and unusual observations help assess model adequacy. A strong association does not eliminate omitted-variable explanations or establish causation. The useful output is an interpretable model with checked assumptions and a clear account of where its predictions are credible.
Study task. Fit a business relationship in Excel and interpret its coefficient in the model’s actual units or transformed scale. Inspect residuals and explain a limit on extrapolation or causal interpretation.
How to study this book
- Write the business decision and target population before translating them into a statistical question.
- Distinguish random variation, sampling bias, and measurement problems; do not assume a larger sample solves all three.
- Keep a reproducible spreadsheet with labelled inputs, formulas, units, and method assumptions.
- Report estimates, uncertainty, and practical consequences together rather than recommending action from a p-value alone.
- Compare the data range with the proposed prediction range and test whether the model remains plausible under changed conditions.
Questions for reflection
- When does an observed statistical difference fail to justify a business change?
- How can multiplicative growth require a different summary from additive quantities?
- Why must regression coefficients be interpreted differently after a logarithmic transformation?
Source edition and coverage
All thirteen main chapters of OpenStax Introductory Business Statistics 2e are covered, including its distinct chapters on ANOVA and business regression applications. This original study guide explains the source in new wording and adds learning activities. Read the publisher’s book and complete exercises.
About access & copyright
This page provides book information and study material. Full-text access is provided by the original publisher or authorised source; a listing does not grant permission to republish the book.
Read our Library Access & Copyright policyExplore the contents
Check the chapters covered in this edition.
Visit the official source
See reading, preview or purchase options.
Save for later
Keep this textbook in your saved collection.
Reader ratings & reviews
Share your thoughts
Your review helps other students choose the right resources.
KEEP LEARNING
Your next great read
Math Business
Organizational Behavior
View Organizational Behavior — book Math
Introductory Statistics 2e
View Introductory Statistics 2e — book Business
Introduction to Intellectual Property
View Introduction to Intellectual Property — book Business
Introduction to Business 2e
View Introduction to Business 2e — book Math
Intermediate Algebra 2e
View Intermediate Algebra 2e — book Math
Elementary Algebra 2e
View Elementary Algebra 2e — book Math
Contemporary Mathematics
View Contemporary Mathematics — book Math
College Algebra 2e with Corequisite Support
View College Algebra 2e with Corequisite Support — book Math



