
Think Python: How to Think Like a Computer Scientist
Computer ScienceTextbook
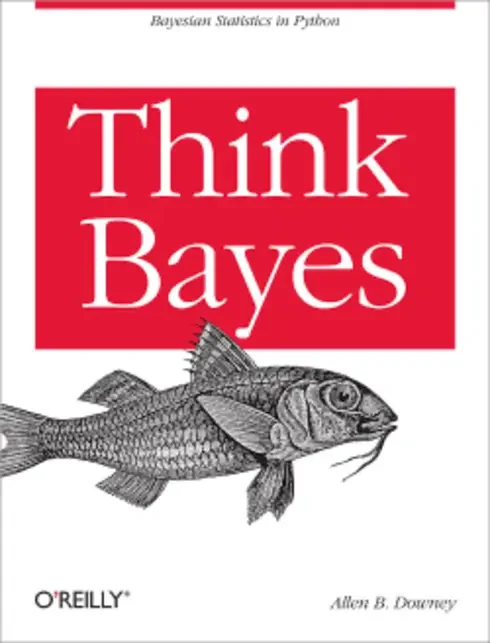
Think Bayes: Bayesian Statistics Made Simple
Not rated yetRate this bookAllen B. Downey’s Think Bayes develops Bayesian reasoning through small computational models and progressively richer examples. This guide follows first-edition version 1.0.9, whose fifteen chapters differ from the later second edition. The approach is to state hypotheses, represent prior uncertainty, evaluate how evidence would arise, update, and examine predictions. The edition’s code and dependencies should be read in their historical software context rather than assumed compatible with every current environment.
Free reading is available at the official source. Opens in a new tab.
 Free
About this book
Allen B. Downey’s Think Bayes develops Bayesian reasoning through small computational models and progressively richer examples. This guide follows first-edition version 1.0.9, whose fifteen chapters differ from the later second edition. The approach is to state hypotheses, represent prior uncertainty, evaluate how evidence would arise, update, and examine predictions. The edition’s code and dependencies should be read in their historical software context rather than assumed compatible with every current environment.
Book summary
About this book
Allen B. Downey’s Think Bayes develops Bayesian reasoning through small computational models and progressively richer examples. This guide follows first-edition version 1.0.9, whose fifteen chapters differ from the later second edition. The approach is to state hypotheses, represent prior uncertainty, evaluate how evidence would arise, update, and examine predictions. The edition’s code and dependencies should be read in their historical software context rather than assumed compatible with every current environment.
Chapter and section guide
1. Bayes’s Theorem
Conditional probability connects a hypothesis with evidence through an explicitly stated model. Prior, likelihood, and posterior play different roles. Reversing a condition changes the question, and a likelihood is not automatically a probability distribution over hypotheses. The chapter’s small examples make the updating relationship visible before the computational machinery becomes more elaborate.
Study application: Construct a two-hypothesis example and calculate an update. Explain which quantity describes the evidence given a hypothesis and which describes the hypothesis after observing evidence.
2. Computational Statistics
Distributions become objects that can be represented and manipulated in code. Normalization turns relative weights into probabilities when the model and support are specified. Students should distinguish a representation from the uncertainty it is intended to describe. A program returning values that sum to one has passed one check, not proved that the hypotheses or likelihood are appropriate.
Study application: Implement or tabulate a small discrete update and verify normalization independently. State one modeling mistake that normalization would not detect.
3. Estimation
Estimation assigns uncertainty across possible parameter values rather than only returning one preferred value. The likelihood connects each candidate with the observed data. Students should state the parameter’s support, prior, and observation process before interpreting the posterior. A posterior mean, mode, and interval summarize different features and need not coincide.
Study application: Compare posterior summaries in a small discrete example and explain which question each answers. Identify how a restrictive support could predetermine the apparent result.
4. More Estimation
Further examples develop sensitivity to prior choices and the amount of information in the data. A useful Bayesian analysis makes assumptions visible rather than presenting a prior as either irrelevant or beyond discussion. Students should compare alternatives and identify where evidence changes the distribution. Agreement among methods in one example does not establish that all priors will produce identical answers.
Study application: Repeat a small estimation problem with two defensible priors. Explain which conclusions are stable and which depend noticeably on the prior assumption.
5. Odds and Addends
Odds provide another representation of belief and can make sequential evidence updates easier to interpret. Mixtures and related probability operations support more complex constructions. Students should distinguish adding mutually exclusive possibilities from multiplying conditional contributions. A compact odds calculation still depends on the same model and cannot bypass an independence assumption.
Study application: Convert a small probability to odds, apply a stated evidence factor, and convert back. Explain what additional assumption is needed when combining two pieces of evidence.
6. Decision Analysis
A probability distribution informs a decision but does not determine the decision without a description of consequences or preferences. The chapter connects uncertainty with expected outcomes in a concrete example. Students should separate estimation from action and make the decision criterion explicit. A choice that maximizes one modeled expectation may not satisfy a different objective or account for an omitted cost.
Study application: Compare two fictional actions using a small posterior distribution and stated outcome values. Explain how changing the consequence model can change the action without changing the posterior.
7. Prediction
Prediction integrates uncertainty about parameters with variability in future observations. A posterior over a parameter is not the same object as a distribution of future outcomes. Students should identify what is being predicted and how the model generates it. A useful predictive calculation accounts for uncertainty rather than substituting a single estimate without explanation.
Study application: Build a simple predictive mixture over two parameter possibilities. Compare it with a plug-in prediction and explain what uncertainty the plug-in calculation omits.
8. Observer Bias
The observation process can change which situations a person is likely to encounter. The chapter’s waiting-time and related reasoning makes selection effects concrete. Students should model how the observer arrives and what is visible, not treat the observed sample as automatically representative. A discrepancy may reflect the sampling mechanism rather than an arithmetic error.
Study application: Compare selecting an interval uniformly with arriving at a random time. Explain why longer intervals can be overrepresented in the second experience.
9. Two Dimensions
Joint distributions represent uncertainty about more than one quantity. Marginalization and conditioning extract different information from the joint model. Students should preserve dependencies rather than assume that separate marginal summaries fully describe the relationship. Grid resolution and representation size also become practical computational choices.
Study application: Create a small two-parameter probability table, compute a marginal, and compute a conditional distribution. Explain why the two operations answer different questions.
10. Approximate Bayesian Computation
Simulation-based approximation supports inference when evaluating a likelihood directly is difficult. The comparison between simulated and observed data requires a choice of summaries and acceptance or similarity criteria. Students should identify what information the approximation retains and discards. Increasing computation does not remove bias introduced by an unsuitable model or an overly coarse summary.
Study application: Outline a small simulation-and-comparison procedure. State the summary statistic and explain how a looser comparison criterion could change both efficiency and precision.
11. Hypothesis Testing
Bayesian comparisons evaluate hypotheses within a specified model and prior framework. Students should distinguish this process from assigning a frequentist p-value a posterior interpretation. The set of hypotheses and their predictions determine what evidence can discriminate among them. A conclusion is conditional on those choices, not a statement that every possible alternative has been ruled out.
Study application: Compare two explicit hypotheses using the same data. Identify an important alternative omitted from the comparison and explain the limit that omission places on the conclusion.
12. Evidence
Evidence gains meaning through the contrast between what different hypotheses predict. Data that are likely under one hypothesis may also be likely under another and therefore discriminate weakly. Students should examine relative support rather than use the word evidence as a synonym for certainty. Dependence and the process of selecting observations can alter the relevant likelihood.
Study application: Construct data that fit two competing hypotheses similarly and explain why they provide little discrimination. Then propose an observation that would distinguish them more strongly under the model.
13. Simulation
Simulation generates outcomes from an explicit process and supports exploration, validation, and approximation. A simulation can reveal consequences of assumptions without verifying that those assumptions describe the world. Students should check simple cases where a result is known and compare multiple runs when randomness matters. Reproducibility requires documenting the model and relevant settings.
Study application: Design a small simulation with a known benchmark and explain the comparison you would use to detect an implementation error.
14. A Hierarchical Model
Hierarchical structure connects parameters and observations across levels, allowing information to be shared under a stated model. The chapter’s counting example distinguishes an underlying rate from an imperfect observation process. Students should identify each layer and avoid treating a measured count as a direct reading of the latent quantity. Dependencies need to remain explicit when interpreting a posterior.
Study application: Draw a small generative hierarchy and label observed and unobserved quantities. Explain what additional information would help distinguish two parameters that can produce similar observations.
15. Dealing with Dimensions
The final chapter addresses models whose uncertainty cannot be summarized adequately by a simple one-dimensional calculation. Representation, computation, and interpretation become linked challenges. Students should identify which dimensions matter to the question and how approximation affects conclusions. A more elaborate model can describe more possibilities while also becoming harder to identify or validate.
Study application: Compare a simple model with a richer version adding one parameter. State what new behavior it captures and what evidence would be needed to estimate the extra dimension responsibly.
Study instructions
- Write the hypotheses, prior, likelihood, and observation process before implementing an update.
- Check normalization and simple known cases separately from the validity of the model.
- Distinguish posterior parameter uncertainty, future observation variability, and decision consequences.
- Perform sensitivity checks for important prior and modeling choices.
- Treat the first-edition code as version-specific and document any adaptation rather than assuming a later edition uses the same API.
Practice and review task
Build a small discrete Bayesian analysis with an original dataset or fictional observations. Include two prior choices, a posterior comparison, a predictive distribution, and a discussion of one selection effect or model limitation.
Questions for reflection
Why can a normalized posterior still describe a poorly specified problem? What is the difference between evidence favoring one modeled hypothesis and proof that it is the only possible explanation?
Sources and coverage
This original study guide follows First edition, version 1.0.9. It draws on the source contents, chapter introductions, selected explanations and examples, and review material. It condenses the resource rather than replacing the full text; study applications are original exercises.
About access & copyright
This page provides book information and study material. Full-text access is provided by the original publisher or authorised source; a listing does not grant permission to republish the book.
Read our Library Access & Copyright policyExplore the contents
Check the chapters covered in this edition.
Visit the official source
See reading, preview or purchase options.
Save for later
Keep this textbook in your saved collection.
Reader ratings & reviews
Share your thoughts
Your review helps other students choose the right resources.
KEEP LEARNING
Your next great read
Computer Science
Essentials of Geographic Information Systems
Essentials of Geographic Information Systems
View Essentials of Geographic Information Systems — bookPhysical Modeling in MATLAB
Physical Modeling in MATLAB
View Physical Modeling in MATLAB — book Computer Science
Open Data Structures: An Introduction
View Open Data Structures: An Introduction — book Computer Science
Foundations of Computation
View Foundations of Computation — book Computer Science
Python for Everybody: Exploring Data Using Python 3
View Python for Everybody: Exploring Data Using Python 3 — book Computer Science
An Introduction to Computer Networks
View An Introduction to Computer Networks — book Computer Science
Introduction to Computer Graphics
View Introduction to Computer Graphics — book Computer Science
Introduction to Programming Using Java
View Introduction to Programming Using Java — book Computer Science



