
Abstract
EDM is a nonconventional technique employing spark erosion phenomena in the machining of difficult-to-machine materials. However, the dielectrics most often employed in the process are hydrocarbon EDM oils, which emit toxic, carcinogenic fumes and pose fire hazards. This paper explores the Near-dry EDM variant with the objective of sustainable EDM drilling. Glycerin-air mist, an eco-friendly mixture, is employed as near-dry dielectric medium and its performance against DEF-92 EDM oil by wet EDM is evaluated. The comparative analysis is conducted on 3 superalloys – Inconel 718, Hastelloy C276 and Titanium Grade 5. These superalloys are of interest to the manufacturing community due to their exciting mechanical properties in extreme conditions and also due to the challenges they present in conventional machining techniques. In this study, a total 6 sets of 9 experiments each are conducted using Taguchi L9 Orthogonal array. The machining performance is measured by Material Removal Rate (MRR), Tool Wear Rate (TWR) and Surface Roughness (SR). The investigation shows that all 3 superalloys can be successfully machined with glycerin- air mist by ND-EDM, and no fumes are produced and the process is free from fire hazards. The investigations reveal that, though absolute the GA mist MRR is less than EDM oil MRR, the Relative Workpiece Melting Ratio of the GA mist drills was higher. This means that more for the same working gap energy, a greater fraction is utilized in workpiece material removal in case of GA mist.
Keywords — Electrical Discharge Machining, Near-Dry EDM, Superalloy, Inconel 718, Hastelloy C276, Titanium Grade 5, Glycerin-air mist, Sustainable Manufacturing.
Introduction
Electrical Discharge machining (EDM) is a well- established technique in the machining of electrically conductive materials, difficult-to-machine materials, such as alloys with high hardness, high tensile strengths at moderate-to-high temperatures etc. [1]– [6]. In the EDM process, the workpiece and tool are separated by an Inter-Electrode Gap (IEG) or spark gap. B. Xin et al. (2020) in [7] report this gap to be in the range of 10 – 70 microns. The workpiece is submerged in a liquid dielectric, which may be a specialized EDM oil, kerosene, deionized water etc.
To initiate the machining process, an open-circuit voltage is applied across the spark gap. This triggers a field emission of electrons from the cathode, which ionizes the neutral molecules in the dielectric, as well as those on the anode face. After a certain threshold is reached, the dielectric strength of the fluid is breached (dielectric breakdown) [8]; a narrow column of ionized gas is created (plasma channel) in the IEG. A high discharge current is then passed through the IEG, which rapidly melt the material across both surfaces. The temperature in the IEG during the discharge phase is 8000 – 12000 °C [9]. When the current is switched off, the plasma channel
implodes and the melted material is thrown out of the IEG due to a combination of explosive forces and flushing action of the dielectric from the regions adjacent to the IEG [8]. Dominant material removal takes place at the side where the heavier charge carriers (ions) collide with the electrode surface.
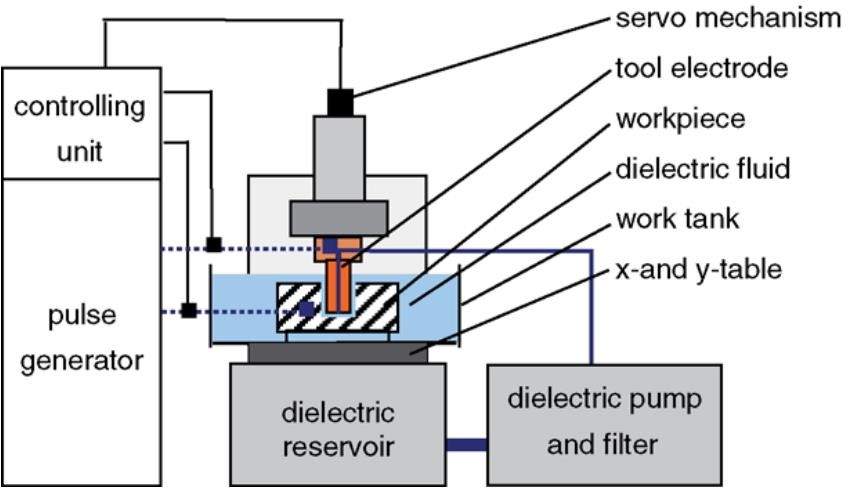
Fig. 1: Die-sink EDM machine [8]
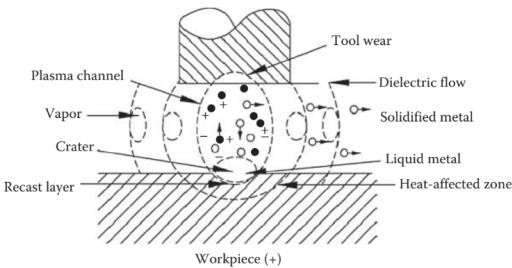
Fig. 2: Illustration of discharge phase at IEG [9]
Oftentimes, hydrocarbon-based EDM oils are used in the industry. However, as a result of the EDM process, there is a release of toxic and carcinogenic fumes, such as aerosols, Polycyclic Aromatic Hydrocarbons (PAH), benzenes, CO, N2O etc. [2], [3], [10]–[12]. These fumes pose a significant environmental hazard as well as health risks to the worker. Furthermore, hydrocarbon-based EDM oils pose a serious fire hazard [12], [13]; they may ignite if sparks are near the liquid-air boundary (the liquid gives off vapors forming an ignitable liquid-air mixture).
This research explores the Near-dry EDM variant (ND-EDM) with the objective of sustainable EDM drilling. In this variant, the dielectric used is a dual- phase dielectric ‘mist’, i.e., mixture of liquid and compressed gas. Taminura et al. in [14] reports that ND-EDM results in stable machining, resulting in higher MRR, negligible tool wear and thinner recast layer. Certain studies also report that the MRR of Near-dry EDM in specific machining conditions was more than conventional EDM [1], [2], [14], [15].
Preliminary literature reports that high viscosity fluids like glycerin have potential in giving higher MRR due to their high Prandtl number, since more thermal energy is available at the IEG [2], [10], [11]. High viscosity dielectrics constrain the plasma channel to a smaller area, resulting in a larger hydromechanical force during material removal [15], [16]. However, in the literature available for using glycerin as an EDM dielectric, its use was limited to HSS as workpiece [2], [10], [11]. Hence, there exists an opportunity to test the efficacy of glycerin for other workpiece materials, such as superalloys. There is also a need to explore different ways of addressing the machinability issues that these superalloys present [5], [17]–[19]. Sections A, B, C give an overview of the workpieces chosen for this study.
Inconel 718
Inconel 718 is an austenitic nickel-chromium superalloy. I718 has been widely used in several industries such as in spacecraft, gas turbines, pumps, and as well as in nuclear reactors. On the other side of the temperature spectrum, it is also used for cryogenic applications [4], [6], [19]. It has a density of 8.22 g/cm3. Inconel alloys are corrosion-resistant and possess exceptional tensile strength from –253
°C to 704 °C. The melting range of I718 is 1260 – 1336 °C, while its Hardness is 43 – 46 HRC [20]. However, Inconel 718 is said to have poor machinability by conventional processes due to work hardening, surface tearing and induced stresses [17].
Research on the EDM of I718 has been explored so far in the avenues of wet EDM with using RSM methodology by S. Rajesha et al. in [21], comparative investigations of performance of new electrode materials (Cu-SiC) with Wire-cut EDM by L. Li et al. in [19], comparative investigations of different electrode materials by Multi Objective Particle Swarm Optimization (MOPSO) approach by C. P. Mohanty et. al in [22], and exploration of the effects of addition of new materials to dielectric media, such as application of Multi-Walled Carbon Nanotube (MWNCT) [23] or SiC powder [6].
Hastelloy C276
Hastelloy® C276 an austenitic nickel-chromium- molybdenum superalloy with appreciable corrosion inertness. C276 exhibits properties such as high resistance to stress corrosion cracking, pitting and creep resistance at high temperatures [24]. It finds applications in aerospace, chemical, and nuclear industries as well as cryogenics [25]. It has a density of 8.89 g/cm3. The melting point of C276 is in the range of 1323 – 1371 °C, while its Hardness is 86 HRB at room temperature [26]. Existing literature on the EDM of C276 has been explored in powder- mixed EDM (PM-EDM) by Die-sink and Wire-cut EDM processes by Singh et al. in [24], parametric studies in wet EDM by water [27], and the influence of conventional and cryogenically treated copper by Choudhury et al. in [28].
Titanium Grade 5
Titanium Grade 5 or Ti–6Al–4V, also known as Ti64, is a dual phase α–β alloy with low density, high corrosion resistance and a high strength-to-weight ratio, making it an ideal candidate for many
aerospace applications [29]. It forms a stable and contiguous oxide film on its surface, making it highly resistant to corrosion. Ti64 has a density of 4.43 g/cm3. The Yield Strength (0.2% Offset) is at an excellent 150 ksi (1035 MPa) min. at room temp, however it reduces drastically to about 70 ksi (482 MPa) as it approaches 873 K (600 °C). This makes it readily formable at intermediate temperatures. It exhibits a hardness of typically 36 HRC. The melting range is 1604 – 1660 °C [30]. Table 1 lists the thermoelectric properties of all the 3 superalloys.
A study in the thermoelectric properties of Ti–6Al– 4V in relation to EDM was done by P. Fonda et al. in [5], where they remark that titanium alloys are rarely machined by EDM due to their low thermal conductivity and high strength at elevated temperatures. A. Hasçalık et. al in [31] discuss in depth, the surface topography and X-ray diffraction profiles of Ti–6Al–4V after EDM machining. P. Karmiris-Obratański et al. in [18] provide a study of High-power EDM of Ti–6Al–4V ELI grade.
Table 1: Thermal and Electrical Conductivities (λ & γ) of the chosen superalloys [20], [26], [32]
Superalloys | I718 | C276 | Ti64 |
|---|---|---|---|
λ (W/m-K) | 11.39 | 10.5 | 7.28 |
γ (MS/m) | 82.99 | 81.30 | 58.47 |
Materials and Methods
Research Objective
This study provides a comparative experimental analysis of EDM Drilling between two dielectrics, GA mist versus DEF-92 EDM oil — each on 3 superalloys, Inconel 718, Hastelloy C276, Titanium Grade 5. It explores the possibility of using GA mist as an environmentally friendly alternative to the EDM oil, for the EDM drilling of the 3 superalloys. The performance of the 2 dielectrics is compared on the basis of the same process parameters.
Through-holes are drilled into the workpieces using hollow copper electrodes. Using the Taguchi method, 9 experiments are conducted per superalloy
– dielectric combination. Owing to the 6 such possible sets, a total of 54 experiments are conducted in this entire investigation. The comparative analysis is made by on 3 response parameters, the Material Removal Rate (MRR), the Tool Wear Rate (TWR) and Surface Roughness (SR). For Surface Roughness, Ra profiles of the cylindrical surfaces of the machines holes are measured.
Pilot Experimentation and Selection of Process Parameters
Table 2: Physical Properties of Dielectrics and Process Constants [34]–[36]
Glycerin – air | |
|---|---|
Air pressure | 7 bars |
Mist flow setting | 3 revs |
Density of glycerin | 1.26 g/cm3 |
Viscosity (at 25 °C) | 934 cP |
Thermal Conductivity of bulk glycerin | 0.292 W/m-K |
Total quantity of glycerin consumed | 0.8 L |
EDM oil | |
EDM oil re-circulation pressure | 0.8 bars |
Density | 0.76 g/cm3 |
Viscosity (at 29 °C) | 1.64 cP |
Thermal Conductivity | 0.114 W/m-K |
Quantity of EDM oil in re- circulation | 400 L |
Table 3: Process Parameter Levels and Machine Settings
Levels | 1 | 2 | 3 |
|---|---|---|---|
Current (A) | 10 | 14 | 18 |
Pulse-on time (μs) | 200 | 260 | 320 |
Pulse-off time (μs) | 50 | 75 | 100 |
Open Circuit Voltage | 180 V | ||
Gap Voltage | 45 V | ||
Work Setting | 4 | ||
Lift Setting | 2 | ||
Polarity of tool | + for I718, C276 – for Ti64 | ||
Experiments are conducted on the die-sink EDM Machine SZNC 5040 GMT, manufactured by Kelkar-Gayatri CNC Pvt. Ltd., Pune, India. The dielectric mist is supplied by a Minimum Quantity Lubrication (MQL) setup. The MQL used was a Dropsa MiQuel BASE (reservoir capacity 1 – 3 L).
The MQL setup had an ungraduated dial to regulate the mist flow (range 0.3 – 8 cc/min) into the IEG. Pilot experiments were carried out to set the optimum setting of mist outflow from the MQL setup. The mist flow setting was varied from 1 to 4 revolutions and found to be optimum at 3 revolutions. At higher flow levels, the glycerin did not atomize properly, leading to carbon deposition problems and unstable sparks. The 3 revs setting provided the most efficient flushing and an optimum glycerin droplet
size, thereby giving higher MRR. Similarly, the air- inflow pressure into the MQL was varied from 4 to 7 bar, and was found to be optimum at 7 bar. At higher pressure, the debris was ejected more efficiently, resulting in better flushing.
Furthermore, pilot experimentation with near-dry EDM revealed that when the polarity of the tool was positive in case of I718 and C276, it resulted in higher MRR. On the contrary, when the polarity of tool is negative in case of Ti64, it resulted in higher MRR. Nair et al. in [37] also reported higher MRR with negative polarity EDM of Ti64. Positive polarity machining of Ti64 at the chosen process parameters lead to excessive tool wear with negligible advancement of the tool. Sudden flashes of light were also reported as seen in Fig 6(b).
Table 3 details the Process Parameters and Machine Settings used for the experiments. The Process Parameter Levels (Current, TON, TOFF) have been selected considering existing literature [1], [3], [16], [33] as well as pilot experiments performed on the workpieces with the objective of maximizing MRR and minimizing TWR. The corresponding Taguchi L9 Orthogonal Array is listed in Table 4.
ANOVA tests for the experiments are performed in Minitab 21 Statistical Software. A confidence level of 90% (or α = 0.1) was decided. The confidence level was decided considering the sample size of 9 per workpiece – dielectric combination; and considering phenomena which, during pilot experimentation, were observed to cause undesired variability in the data, such as micron-level precision in perpendicularity of the tool with respect to the electrode, distribution of droplet sizes in GA mist etc.
Table 4: Taguchi L9 Orthogonal Array of Process Parameters
Expt no. | Current (A) | TON time (μs) | TOFF time (μs) |
|---|---|---|---|
1 | 10 | 200 | 50 |
2 | 10 | 260 | 75 |
3 | 10 | 320 | 100 |
4 | 14 | 200 | 50 |
5 | 14 | 260 | 75 |
6 | 14 | 320 | 100 |
7 | 18 | 200 | 50 |
8 | 18 | 260 | 75 |
9 | 18 | 320 | 100 |
The workpieces are disc-shaped with a 60 mm diameter and 3 mm thickness — each for Inconel 718, Hastelloy C276 and Titanium Grade 5. The tool electrode used was 99.95% pure, EC grade copper (hollow) with OD 12 mm, ID 8.5 mm, length 80 mm. The melting range of copper is 1065 – 1083 °C with a density of 8.94 g/cm3, a high thermal conductivity of 394 W/m-K and an electrical conductivity of 58.6 MS/m.
Through-holes are drilled into the workpieces using the hollow copper electrode via centrifugal dielectric flushing. Impressively, all 3 sets of experiments with GA mist consumed a quantity of just 0.8 L of glycerin. On the other hand, EDM oil was required in vast quantities of about 400 L, albeit in recirculation, to keep the workpiece submerged in the dielectric tank. Hence, GA mist ND-EDM severely cuts down on the quantity of dielectric consumption, and hence reduces the cost of the machining process.
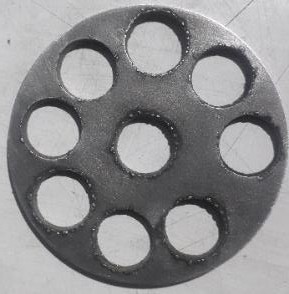
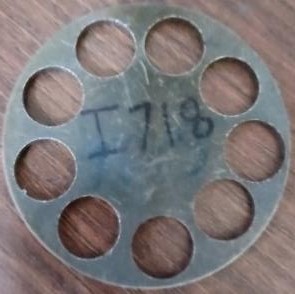
Fig. 3(a) I718 – GA mist (b) I718 – EDM oil
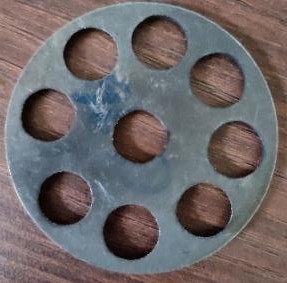
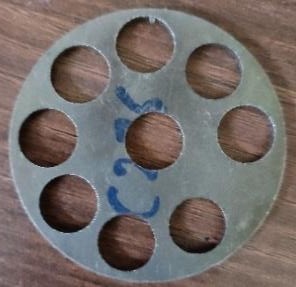
Fig. 4(a) C276 – GA mist (b) C276 – EDM oil
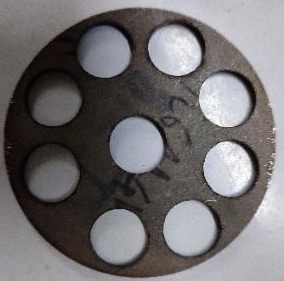
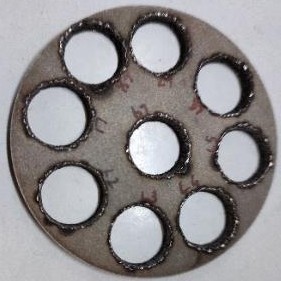
Fig. 5(a) Ti64 – GA mist (b) Ti64 – EDM oil
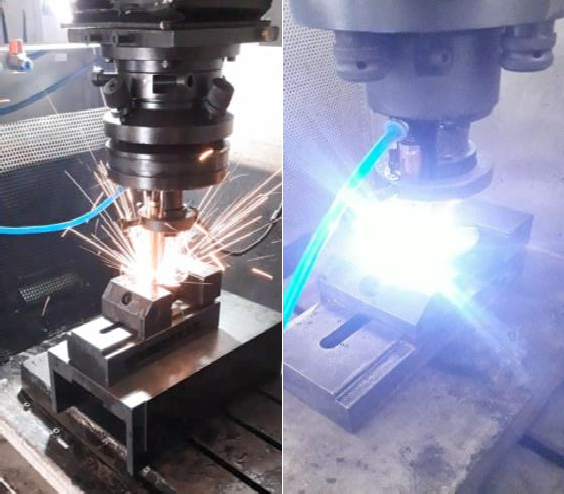
Fig. 6(a) ND-EDM of C276 at high current
(b) Pilot experimentation on ND-EDM of Ti64
Results and Discussion
Inconel 718
Effect of process parameters on MRR
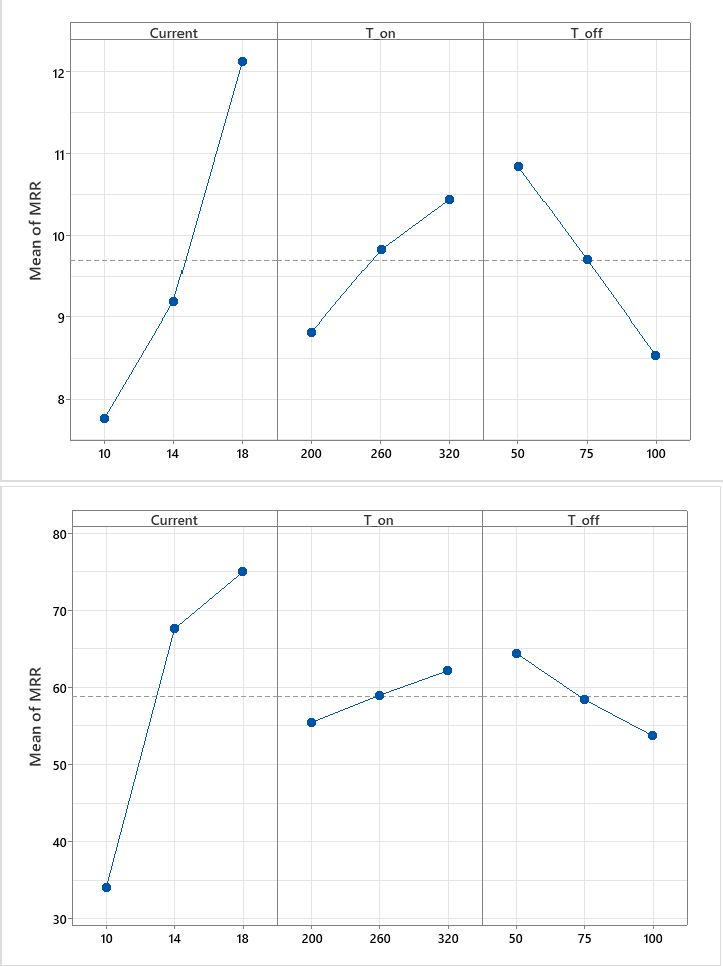
Fig. 7: Main Effects Plot of MRR for I718
GA mist & (b) EDM oil
| Term | DF | Ad SS | Ad MS | F-Stat | P-Value | % P |
|---|---|---|---|---|---|---|
| Regression | 6 | 41.9396 | 6.9899 | 506.64 | 0.002 | 99.93 % |
| Current | 2 | 29.8660 | 14.9330 | 1082.37 | 0.001 | 71.16 % |
| TON | 2 | 4.0624 | 2.0312 | 147.22 | 0.007 | 9.68 % |
| TOFF | 2 | 8.0112 | 4.0056 | 290.33 | 0.003 | 19.09 % |
| Error | 2 | 0.0276 | 0.0138 | 0.07 % | ||
| Total | 8 | 41.9672 | 100.00 % | |||
| S | R-sq | R-sq(adj) | R-sq(pred) | |||
| 0.117459 | 99.93% | 99.74% | 98.67% | |||
| Term | DF | Ad SS | Ad MS | F-Stat | P-Value | % P |
|---|---|---|---|---|---|---|
| Regression | 6 | 3100.85 | 516.81 | 280.05 | 0.004 | 99.88 % |
| Current | 2 | 2859.68 | 1429.84 | 774.82 | 0.001 | 92.11 % |
| TON | 2 | 67.94 | 33.97 | 18.41 | 0.052 | 2.19 % |
| TOFF | 2 | 173.23 | 86.62 | 46.94 | 0.021 | 5.58 % |
| Error | 2 | 3.69 | 1.85 | 0.12 % | ||
| Total | 8 | 3104.54 | 100.00 % | |||
| S | R-sq | R-sq(adj) | R-sq(pred) | |||
| 1.35845 | 99.88% | 99.52% | 97.59% | |||
It was observed that I718 can be machined with GA mist by ND-EDM. No fumes were observed during ND-EDM with GA mist. Hence, it may be considered as a sustainable machining process. With a continuous inflow of glycerin-air stream, no apparent risk of fire hazards is reported. The variation of the MRR with the 3 process parameters is seen in the Main Effects Plots (henceforth MEP’s) in Fig. 7(a) & (b). It is found from the ANOVA tests in
The variation of MRR with TON and TOFF is also shown in Fig 7(a) & (b) for the respective dielectrics. The contribution is 9.68 % and 2.19 % respectively for GA mist and EDM oil. When TON increases, the discharge pulse is available for longer. This leads to more thermal energy during discharge leading to more material removal. This finding concurs with [3], [24]. On the other hand, MRR reduces as TOFF increases. The contribution of TOFF is seen to be more than TON, at 19.09 % for GA mist, and 5.58 % for EDM oil. The observed trend is because as TOFF increases, the sparks are absent for longer and the MRR reduces. Higher TOFF times lead to more efficient flushing and better reconditioning of the IEG. Hence, in order to maximize MRR for GA mist, the Current and TON should be kept highest (18 A and 320 μs), while TOFF should be lowest 50 μs.
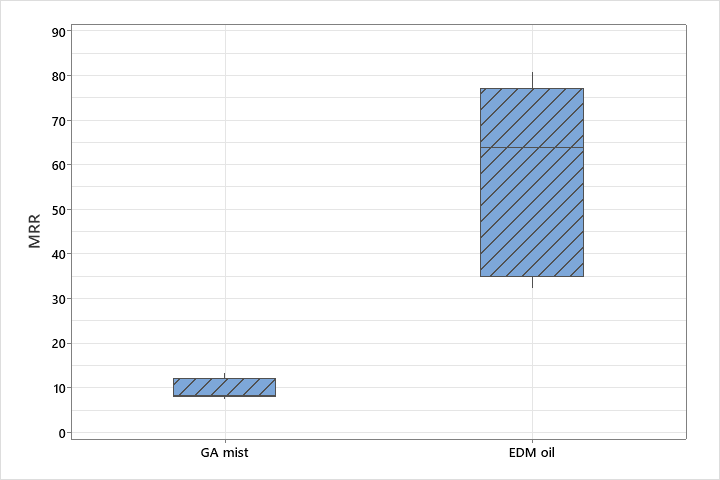
Fig. 8: Boxplot of MRR for I718 MRR – GA mist vs EDM oil
Another key observation (Fig 8) is that there is a significant difference in the MRR ranges of GA mist and EDM oil. The MRR of I718 – EDM oil is 6.1 times more than GA mist. This can be attributed to breakdown of dielectric at a higher temperature and higher thermal energy at discharge in case of EDM oil. One of the salient features of near-dry EDM lies in the constraining of plasma channel to a smaller area leading to a higher energy density field [2], [3], [15], [16]. In light of this statement, the above finding is of particular interest because it reveals that
— despite the superior viscosity and higher thermal conductivity of the bulk glycerin medium, which in turn affects the thermal energy density in the IEG; the overall energy density of a 2-phase glycerin-air mist must be significantly lower than that of the bulk EDM oil medium.
Furthermore, the distribution of droplet size also plays important role in the overall energy density. It is to be noted that glycerin has a very high Prandtl number of 7612 [36], in contrast to the EDM oil’s calculated Prandtl number of 14 [35]. A high Prandtl number such as glycerin’s means that heat transfer to the spark site is heavily favored by fluid momentum rather than by thermal diffusion. Moreover, air is a very poor conductor of heat and the Prandtl number of air is just 0.72 [36]. It favors its heat transfer to thermal diffusion rather than fluid momentum. Also, comparing thermal conductivities of bulk glycerin vs EDM oil suggests that glycerin should be a far better carrier of heat than EDM oil. A dual-phase mist of these two fluids should mean that, the a very small fraction of heat is lost by the glycerin to air.
It is concluded that, for the energy density in GA mist to be lower than the bulk EDM oil, the breakdown must be at a lower temperature. However, the presence of air at an optimum pressure remains crucial to the success of ND-EDM with GA mist
because it was seen during pilot experimentation that if the glycerin did not atomize properly, MRR decreased due to unstable sparks. The measurement of the actual breakdown temperature and energy density for these dielectrics is, however, out of the scope of this study, and hence more research is needed to investigate deeper into the thermophysical interactions in these 2 processes.
Effect of process parameters on TWR
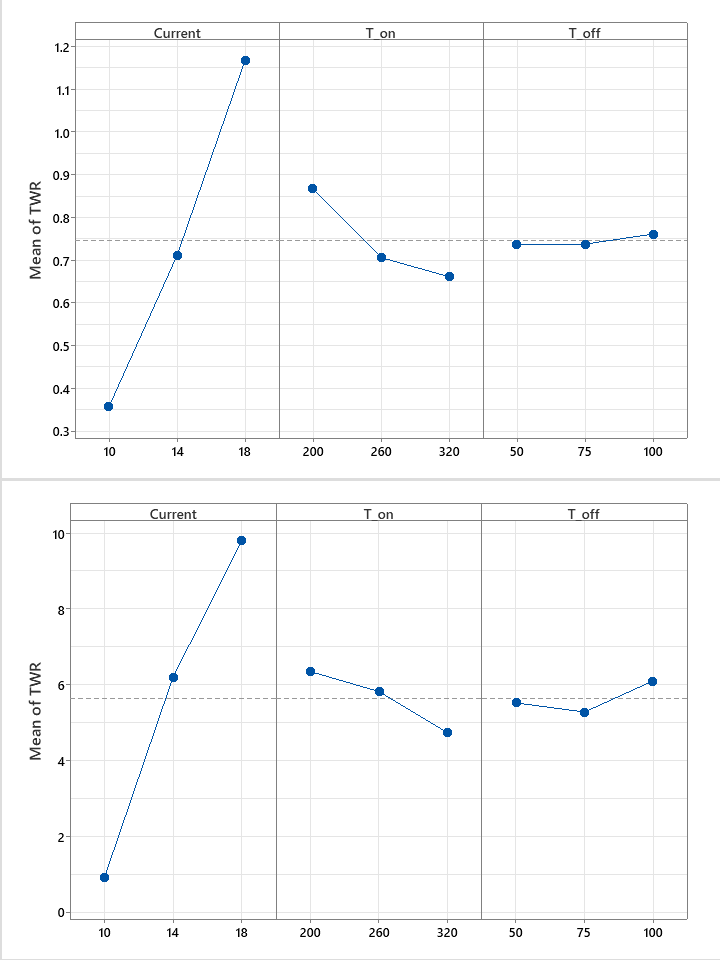
Fig 9: Main Effects Plot of TWR for I718
 GA mist & (b) EDM oil
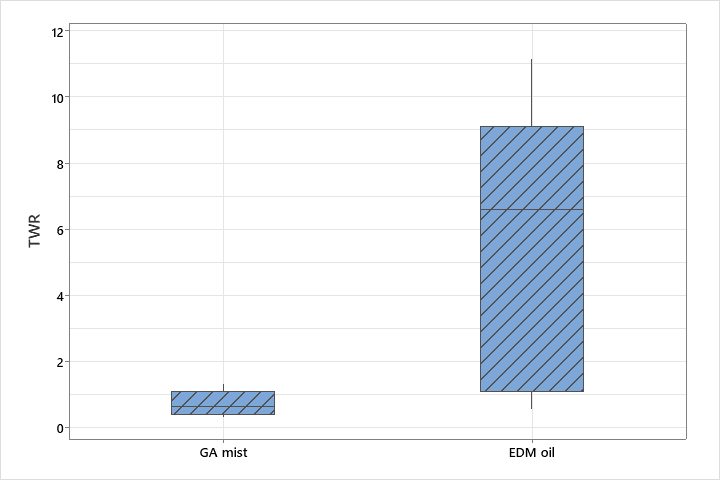
Fig. 10: Boxplot of TWR for I718 – GA mist vs EDM oil
| Term | DF | Ad SS | Ad MS | F-Stat | P-Value | % P |
|---|---|---|---|---|---|---|
| Regression | 6 | 1.0640 | 0.17733 | 63.93 | 0.015 | 99.48 % |
| Current | 2 | 0.9919 | 0.49595 | 178.79 | 0.006 | 92.74 % |
| TON | 2 | 0.0709 | 0.03547 | 12.79 | 0.073 | 6.63 % |
| TOFF | 2 | 0.0012 | 0.00058 | 0.21 | 0.827 | 0.11 % |
| Error | 2 | 0.0056 | 0.00277 | 0.52 % | ||
| Total | 8 | 1.0696 | 100.00 % | |||
| S | R-sq | R-sq(adj) | R-sq(pred) | |||
| 0.0526685 | 99.48% | 97.93% | 89.50% | |||
| Term | DF | Ad SS | Ad MS | F-Stat | P-Value | % P |
|---|---|---|---|---|---|---|
| Regression | 6 | 125.279 | 20.8799 | 123.00 | 0.008 | 99.73 % |
| Current | 2 | 120.124 | 60.0620 | 353.82 | 0.003 | 95.63 % |
| TON | 2 | 4.094 | 2.0468 | 12.06 | 0.077 | 3.26 % |
| TOFF | 2 | 1.062 | 0.5310 | 3.13 | 0.242 | 0.84 % |
| Error | 2 | 0.340 | 0.1698 | 0.27 % | ||
| Total | 8 | 125.619 | 100.00 % | |||
| S | R-sq | R-sq(adj) | R-sq(pred) | |||
| 0.412009 | 99.73% | 98.92% | 94.53% | |||
The MEP’s in Fig. 9(a) & (b) show the variation of MRR against the 3 process parameters. ANOVA tests in Tables 6(a), (b) reveal that only Current and TON are statistically significant contributing parameters in case of TWR, while TOFF is insignificant (p-value 0.827 and 0.242 respectively). The Current contribution is 92.74 % and 95.63 % for the respective dielectrics. Current increase leads to an increase in TWR. Again, this is attributed to higher electrical energy at the IEG lead to relatively bigger sparks, creating bigger craters on the tool side, leading to more tool wear. From Fig. 10, it is revealed that mean TWR for GA mist is 7.5 times less than that of EDM oil. It is inferred to be as a result of the breakdown temperature being lower for GA mist.
The next most statistically significant parameter is the TON duration. The contribution is 6.63 % and 3.26
% respectively for TON. It is observed that with increase in TON, TWR decreases. This is a consequence of lower thermal energy density near the tool side compared to the workpiece. This can be explained as a result of the differing mobility of the charge carriers. The electrons have significantly more mobility than the ions. During the pulse, the electrons which are much denser near the tool side (forming a cloud), dissipate a greater fraction of their energy due to chaotic inter-electronic collisions, as compared to the less mobile ions. These chaotic collisions last longer at higher TON, dissipating more of the heat. This leads to lower TWR. This reasoning concurs with [5]. Primary tool removal takes place at the very beginning of the discharge pulse. Finally, the optimum process parameters for minimizing TWR are lowest current (10 A) and highest TON (320 μs).
Effect of process parameters on SR
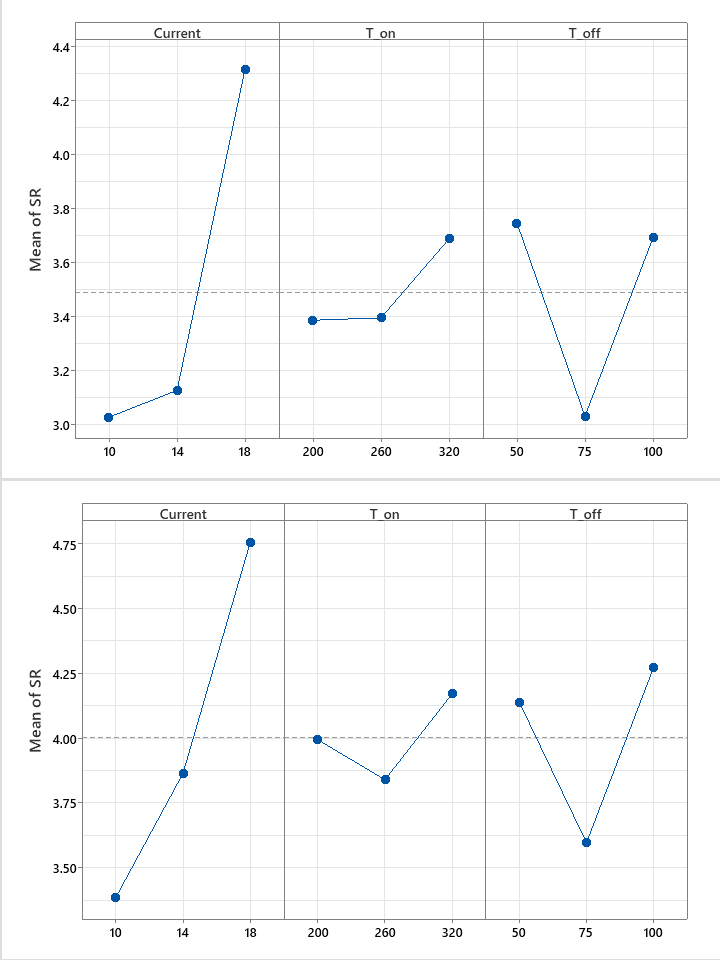
Fig 11: Main Effects Plot of SR for I718
 GA mist & (b) EDM oil
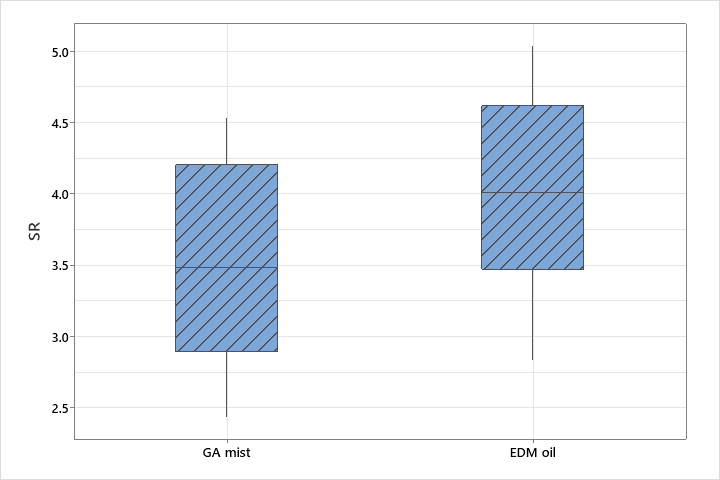
Fig. 12: Boxplot of SR for I718 – GA mist vs EDM oil
| Term | DF | Ad SS | Ad MS | F-Stat | P-Value | % P |
|---|---|---|---|---|---|---|
| Regression | 6 | 4.2098 | 0.70163 | 96.85 | 0.010 | 99.66 % |
| Current | 2 | 3.0816 | 1.54080 | 212.69 | 0.005 | 72.95 % |
| TON | 2 | 0.1761 | 0.08807 | 12.16 | 0.076 | 4.17 % |
| TOFF | 2 | 0.9520 | 0.47603 | 65.71 | 0.015 | 22.54 % |
| Error | 2 | 0.0145 | 0.00724 | 0.34 % | ||
| Total | 8 | 4.2243 | 100.00 % | |||
| S | R-sq | R-sq(adj) | R-sq(pred) | |||
| 0.0851143 | 99.66% | 98.63% | 93.05% | |||
| Term | DF | Ad SS | Ad MS | F-Stat | P-Value | % P |
|---|---|---|---|---|---|---|
| Regression | 6 | 3.8476 | 0.6413 | 91.56 | 0.011 | 99.64 % |
| Current | 2 | 2.9145 | 1.4573 | 208.07 | 0.005 | 75.47 % |
| TON | 2 | 0.1658 | 0.0829 | 11.84 | 0.078 | 4.29 % |
| TOFF | 2 | 0.7673 | 0.3836 | 54.77 | 0.018 | 19.87 % |
| Error | 2 | 0.0140 | 0.0070 | 0.36 % | ||
| Total | 8 | 3.8616 | 100.00 % | |||
| S | R-sq | R-sq(adj) | R-sq(pred) | |||
| 0.0836881 | 99.64% | 98.55% | 92.65% | |||
The micro-hardness of the hills and craters generated during one discharge cycle also plays a role in the ease of machining in the successive discharge cycle. The final SR in EDM is thus a superimposition of many such craters, micro-cracks, pockmarks, carbon deposition, resolidified debris etc. However, machining process parameters do play a role in the final SR. As such, the MEPs of mean SR for GA mist and EDM oil are reported in Fig. 11(a) & (b). The mean SR ranged from 3.03 – 4.32 μm for GA mist and 3.38 – 4.75 μm for EDM oil. The ANOVA Tables 7(a), (b) for these measurements reveal that all 3 process parameters are significant. Current is the most significant contributor (72.95 % and 75.47 % respectively) and it is seen that SR increases with increase in current. It is because larger current levels lead to bigger craters per discharge, leading to a rougher surface.
The dependence of SR with TON and TOFF is also seen in Fig. 10(a) and (b). TON times are known to influence the width of the craters [18]. Albeit statistically significant, the contribution of TON is only 4.17 % for GA mist and 4.29 % for EDM oil. In case of GA mist, the mean SR seems to be constant for 200 to 260 μs, but increases from 260 to 320 μs. Whereas for EDM oil, a V-shaped trend is seen. Both of these trends might be attributed to more optimal flushing conditions the micro level and the amount of carbon deposition. In case of TOFF, a near identical V- shaped trend is seen for both GA mist and EDM oil, with percentage contributions of 22.54 % and 19.87 % respectively. Since the EDM is a chaotic and non- stationary process and the final SR is a superimposition of millions of craters, it is difficult to make a rigorous interpretation of this trend. Similar to the case of TON, it might be due to more optimal flushing conditions at the micro level.
While examining the surface morphology of the GA mist EDMed workpiece of I718, it was observed that at all current levels, there were islets of resolidified material near the circumference at the top surface; a result of debris reattachment during entry of the tool into the workpiece. However, once the tool had penetrated the top surface up to a few hundred microns, the overall morphology of the cylindrical surface was better with no islets or even craters. The surface morphology of the EDM oil counterpart was observed to be significantly better. There were no visible debris islets or uneven craters near the entry circumference, and minimal accumulation of carbon.
Hastelloy C276
Effect of process parameters on MRR
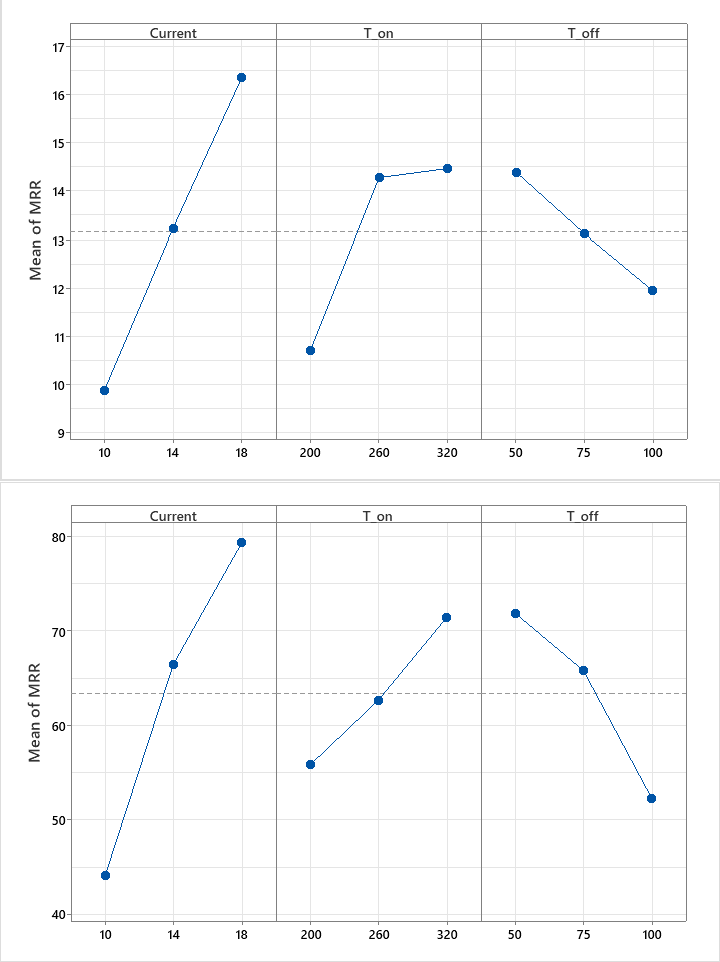
Fig 13: Main Effects Plot of MRR for C276
GA mist & (b) EDM oil
| Term | DF | Adj SS | Adj MS | F-Value | P-Value | % P |
|---|---|---|---|---|---|---|
| Regression | 6 | 98.3968 | 16.3995 | 52.69 | 0.019 | 99.37 % |
| Current | 2 | 62.6988 | 31.3494 | 100.73 | 0.010 | 63.32 % |
| TON | 2 | 26.7598 | 13.3799 | 42.99 | 0.023 | 27.02 % |
| TOFF | 2 | 8.9382 | 4.4691 | 14.36 | 0.065 | 9.03 % |
| Error | 2 | 0.6225 | 0.3112 | 0.63 % | ||
| Total | 8 | 99.0193 | 100.00 % | |||
| S | R-sq | R-sq(adj) | R-sq(pred) | |||
| 0.557878 | 99.37% | 97.49% | 87.27% | |||
| Term | DF | Adj SS | Adj MS | F-Value | P-Value | % P |
|---|---|---|---|---|---|---|
| Regression | 6 | 2885.74 | 480.956 | 50.27 | 0.020 | 99.34 % |
| Current | 2 | 1911.40 | 955.702 | 99.90 | 0.010 | 65.80 % |
| TON | 2 | 368.12 | 184.062 | 19.24 | 0.049 | 12.67 % |
| TOFF | 2 | 606.21 | 303.105 | 31.68 | 0.031 | 20.87 % |
| Error | 2 | 19.13 | 9.567 | 0.66 % | ||
| Total | 8 | 2904.87 | 100.00 % | |||
| S | R-sq | R-sq(adj) | R-sq(pred) | |||
| 3.09303 | 99.34% | 97.37% | 86.66% | |||
It is seen that machining is successful with GA mist. No fumes are observed during ND-EDM with GA mist and no apparent fire hazard was seen. The MEP’s in Fig. 13(a) & (b) show the variation of MRR. ANOVA tests in
The variation of MRR with TON can be seen in Fig. 11(a) & (b). In case of GA mist, interestingly, the MRR increases with TON from 200 to 260 μs, but increases very marginally from 260 to 320 μs. This lack of variation highlights the presence of underlying complex interactions. It is possible that there was plasma channel expansion, which hindered further material melting after a certain point of time in the discharge phase. In general, when TON increases, the discharge pulse is available for longer, increasing the collision rate of the charge carriers on the workpiece in a single discharge. But when the pressure buildup due to prolonged thermal energy concentration at the spark site exceeds the pressure sustaining the plasma channel, the channel expands in volume, thereby resulting in a reduced thermal energy density at the spark site. This expansion is not beneficial to further material melting. In case of EDM oil, however, no such plateauing MRR is seen and the MRR continues to increase with increase in TON, similar to the I718 – EDM oil counterpart. In case of TOFF, the contributions are at 6.21 % and 20.00 % and the MRR was found to decrease with increase in TOFF. The reason is same as that for I718, absence of sparks for longer leading to a fall in MRR.
Further, in case of C276 also, we see a substantial difference in the interquartile ranges of MRR for GA mist and EDM oil (Fig. 14). The C276 – EDM oil MRR is on average 4.7 times more than GA mist. Again, this can be attributed to the breakdown temperature being lower in case of GA mist, despite having superior thermal conductivity and Prandtl number. Hence, in order to maximize MRR for GA mist, current should be kept at 18 A, TON may be kept at either 260 or 320 μs, while TOFF should be at 50 μs.
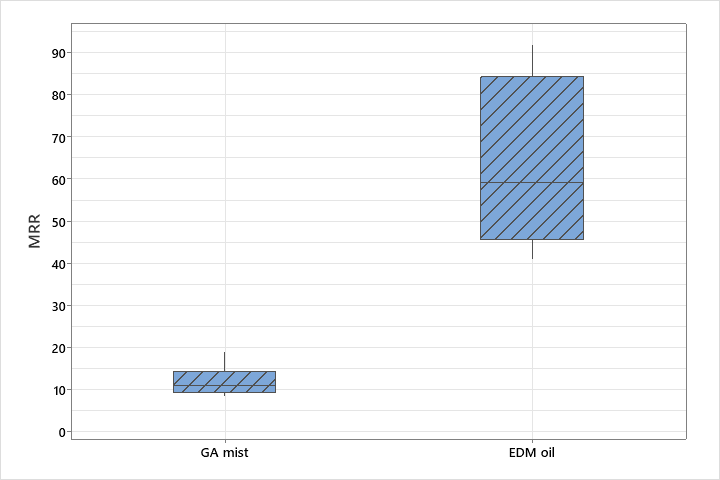 Fig. 14: Boxplot of MRR for C276 – GA mist vs EDM oil
Effect of process parameters on TWR
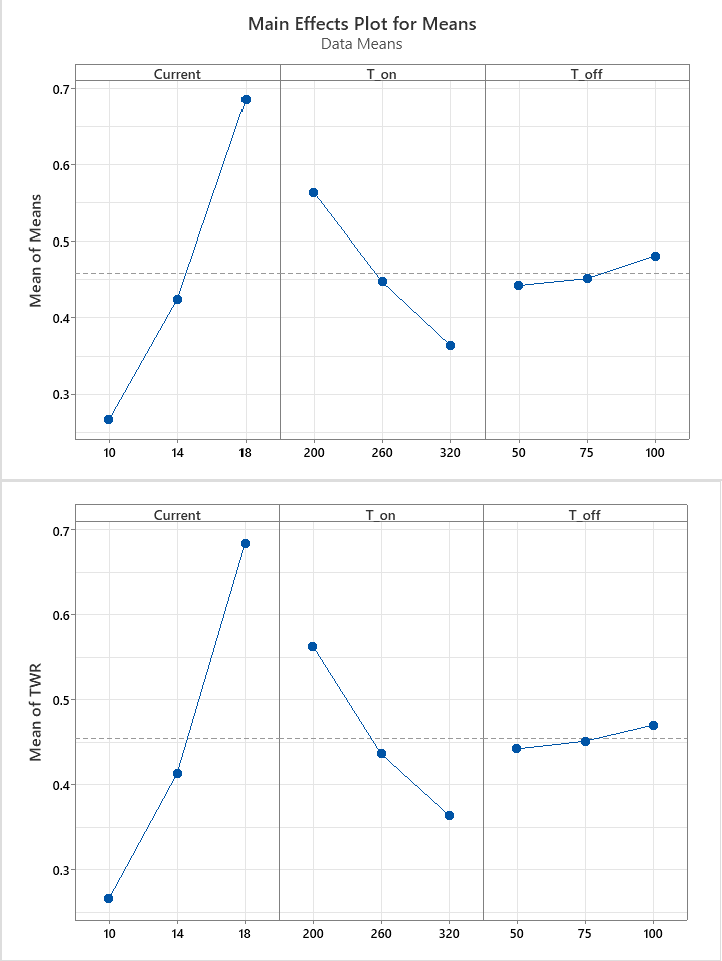
Fig 15: Main Effects Plot of TWR for C276
GA mist & (b) EDM oil
| Term | DF | Adj SS | Adj MS | F-Value | P-Value | % P |
|---|---|---|---|---|---|---|
| Regression | 6 | 0.3304 | 0.0551 | 53.95 | 0.018 | 99.43 % |
| Current | 2 | 0.2680 | 0.1340 | 131.26 | 0.008 | 80.63 % |
| TON | 2 | 0.0600 | 0.0300 | 29.38 | 0.033 | 18.05 % |
| TOFF | 2 | 0.0025 | 0.0012 | 1.21 | 0.453 | 0.75 % |
| Error | 2 | 0.0020 | 0.0010 | 0.60 % | ||
| Total | 8 | 0.3324 | 100.00 % | |||
| S | R-sq | R-sq(adj) | R-sq(pred) | |||
| 0.0319491 | 99.39% | 97.54% | 87.56% | |||
| Term | DF | Ad SS | Ad MS | F-Stat | P-Value | % P | |
|---|---|---|---|---|---|---|---|
| Regression | 6 | 146.932 | 24.4887 | 40.50 | 0.024 | 99.18 % | |
| Current | 2 | 130.826 | 65.4131 | 108.17 | 0.009 | 88.31 % | |
| TON | 2 | 12.986 | 6.4932 | 10.74 | 0.085 | 8.77 % | |
| TOFF | 2 | 3.120 | 1.5598 | 2.58 | 0.279 | 2.10 % | |
| Error | 2 | 1.209 | 0.6047 | 0.82 % | |||
| Total | 8 | 148.142 | 100.00 % | ||||
| S | R-sq | R-sq(adj) | R-sq(pred) | ||||
| 0.777637 | 99.18% | 96.73% | 83.47% | ||||
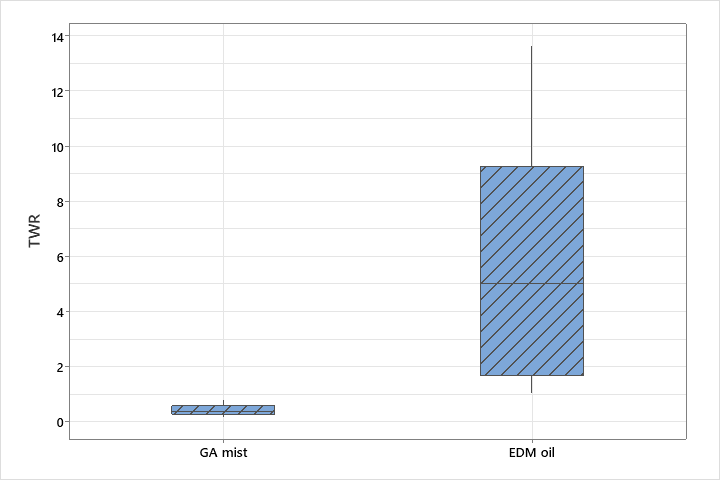
Figure 16. Boxplot of TWR for C276 – GA mist versus EDM oil.
The MEP’s in Fig. 15(a) & (b) show the variation of MRR. ANOVA tests in Tables 9(a), (b) found Current and TON to be statistically significant, while TOFF was insignificant (p-value 0.425 and 0.279 respectively). The variation of TWR with current in case of GA mist is an increasing trend, as seen in Fig. 12(a) & (b). The contribution is seen to be 81.09 % for GA mist and 88.31 % for EDM oil. A higher electrical energy at higher currents lead to larger, more erosive sparks. TWR for GA mist is an astonishing 12.7 times less than EDM oil (Fig. 16). Hence, though C276 – EDM oil gave highest MRR, it also gives the highest TWR. The variation of TWR with TON follows a decreasing trend, as seen in Fig. 11(a) & (b). The contribution is seen to be 18.27 % for GA mist and 8.77 % for EDM oil. Near the tool side, a greater fraction of the energy is dissipated by the chaotic inter-electronic collisions. Hence, when the discharge pulse was available for longer, the thermal energy dissipated more. For the process parameter TOFF, it is seen that the trends are not statistically significant. This is also evident in conjunction with TWR’s apparent variation with TOFF in Fig. 12(a) & (b), which seems to be increasing. This contradicts logical reasoning as TWR must decrease with increase in TOFF, since the spark cycles are absent for longer. Fig. 13 reveals the optimum process parameters for minimizing TWR, a lowest current level of 10 A and highest TON level of 320 μs.
Effect of process parameters on SR
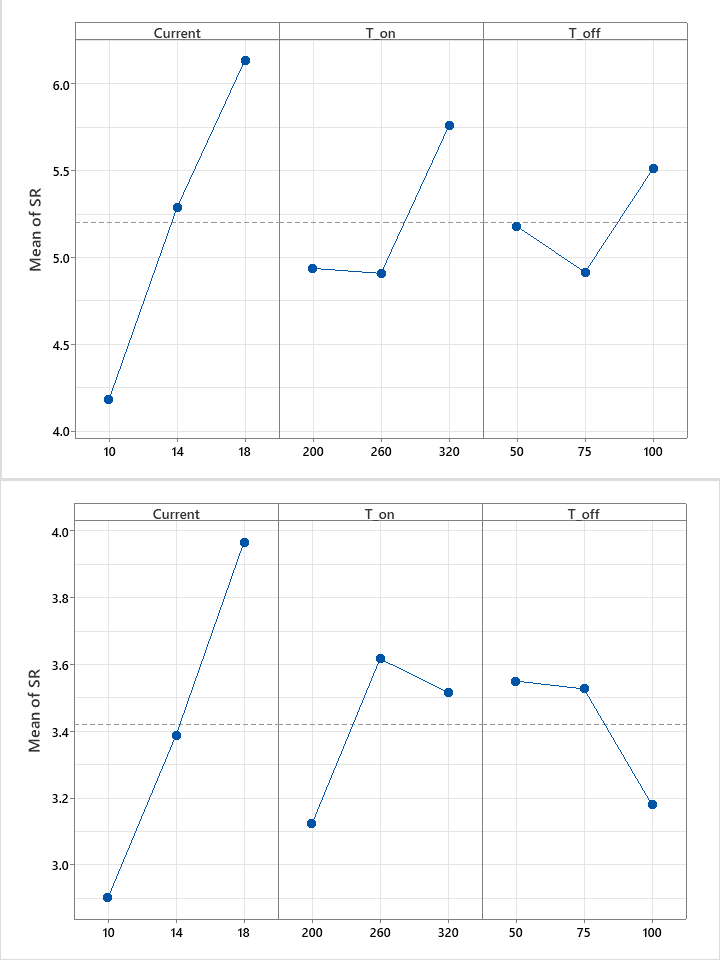
Fig 17: Main Effects Plot of SR for C276
GA mist & (b) EDM oil
| Term | DF | Ad SS | Ad MS | F-Stat | P-Value | % P | |
|---|---|---|---|---|---|---|---|
| Regression | 6 | 7.7233 | 1.2872 | 51.38 | 0.019 | 99.36 % | |
| Current | 2 | 5.7820 | 2.8910 | 115.39 | 0.009 | 74.38 % | |
| TON | 2 | 1.4050 | 0.7025 | 28.04 | 0.034 | 18.07 % | |
| TOFF | 2 | 0.5363 | 0.2682 | 10.70 | 0.085 | 6.90 % | |
| Error | 2 | 0.0501 | 0.0250 | 0.65 % | |||
| Total | 8 | 7.7734 | 100.00 % | ||||
| S | R-sq | R-sq(adj) | R-sq(pred) | ||||
| 0.158282 | 99.36% | 97.42% | 86.95% | ||||
| Term | DF | Ad SS | Ad MS | F-Stat | P-Value | % P | |
|---|---|---|---|---|---|---|---|
| Regression | 6 | 2.2324 | 0.37207 | 32.57 | 0.030 | 98.99 % | |
| Current | 2 | 1.5999 | 0.79998 | 70.03 | 0.014 | 70.94 % | |
| TON | 2 | 0.3927 | 0.19633 | 17.19 | 0.055 | 17.41 % | |
| TOFF | 2 | 0.2398 | 0.11990 | 10.50 | 0.087 | 10.64 % | |
| Error | 2 | 0.0229 | 0.01142 | 1.01 % | |||
| Total | 8 | 2.2552 | 100.00 % | ||||
| S | R-sq | R-sq(adj) | R-sq(pred) | ||||
| 0.106881 | 98.99% | 95.95% | 79.49% | ||||
The MEP’s for mean SR of C276 are shown in Fig. 17(a) & (b). The SR interquartile ranges are seen in Fig. 18. Similar to the case of I718, current is the
most dominant factor with 74.38 % and 70.94 % contributions for the respective dielectrics. Bigger craters are created at higher currents, generating a rougher overall surface. The trend of SR with TON and TOFF for C276 – GA mist combination is similar to the I718 counterpart, and hence similar reasoning can be used to explain the variation. The contributions of TON are reported at 18.07 % and
17.41 % for the respective dielectrics, while for TOFF it is reported at 6.90 % and 10.64 % respectively. However, for EDM oil, it follows a different trend in that, SR first increases sharply and then decreases with increasing TON. Possibly, the most optimal flushing conditions in this case were obtained at 320 μs. In case of TOFF, the trend is seen to be decreasing throughout, and this is expected as the absence of sparks for longer leads to a decrease in SR.
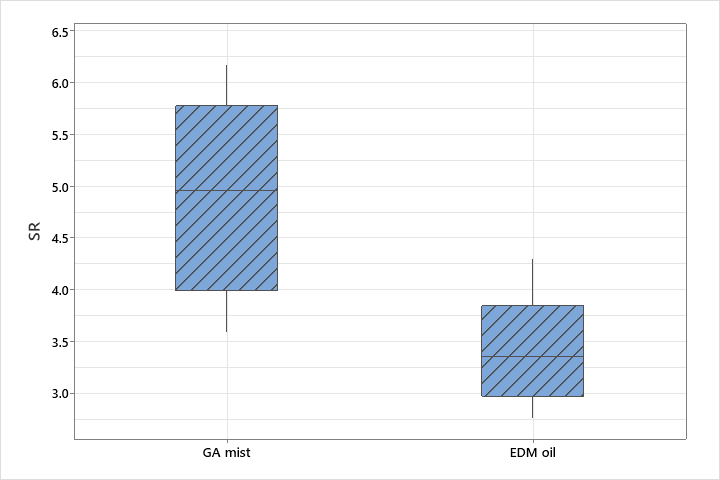
Fig. 18: Boxplot of SR for C276 – GA mist vs EDM oil
The Surface Morphology of the GA mist EDMed workpiece was considerably better than its I718 counterpart. No visible islets of debris are observed in the hole proximity on the top circumference. Minimal carbon deposition was seen at high currents near the bottom surface. For the EDM oil workpiece, the surface morphology the most impressive, there is no visible debris accumulation or carbon deposition, no cracks, or islets on the cylindrical surface of the generated hole. As such, the surface roughness of the EDM oil workpiece was significantly lesser.
Titanium Grade 5
Effect of Process Parameters on MRR
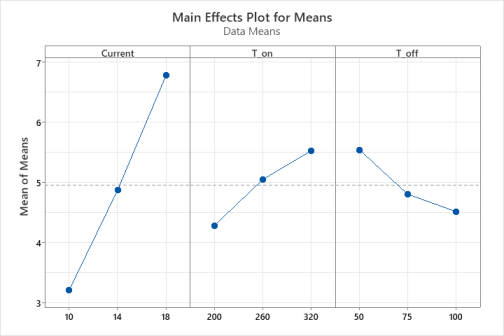
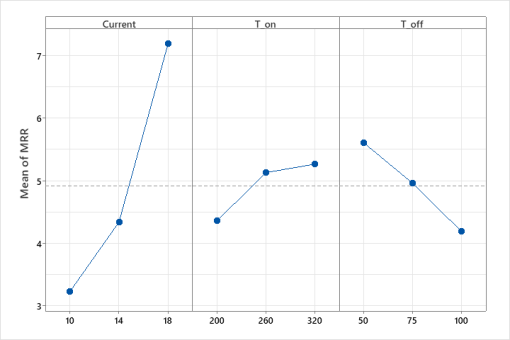
Fig 19: Main Effects Plot of MRR for Ti64
 GA mist & (b) EDM oil
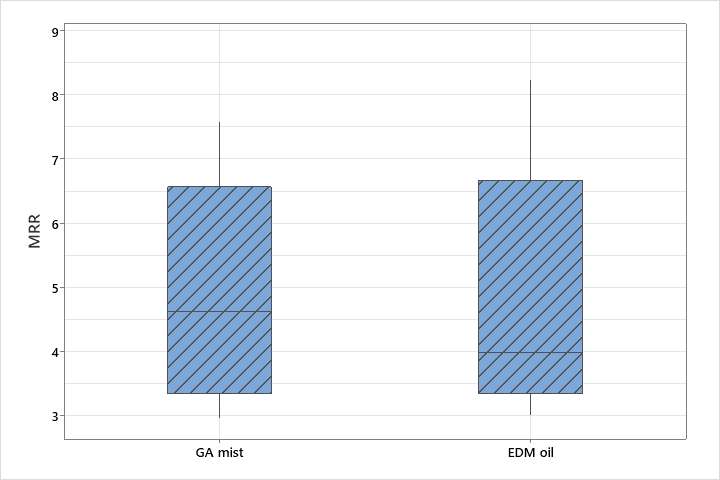
Fig. 20: Boxplot of MRR for Ti64 – GA mist vs EDM oil
| Term | DF | Adj SS | Adj MS | F-Value | P-Value | % P |
|---|---|---|---|---|---|---|
| Regression | 6 | 23.2212 | 3.87020 | 41.01 | 0.024 | 99.19 % |
| Current | 2 | 19.1942 | 9.59712 | 101.69 | 0.010 | 81.99 % |
| TON | 2 | 2.3454 | 1.17271 | 12.43 | 0.074 | 10.02 % |
| TOFF | 2 | 1.6815 | 0.84076 | 8.91 | 0.101 | 7.17 % |
| Error | 2 | 0.1888 | 0.09438 | 0.81 % | ||
| Total | 8 | 23.4099 | 100.00 % | |||
| S | R-sq | R-sq(adj) | R-sq(pred) | |||
| 0.307214 | 99.19% | 96.77% | 83.67% | |||
| Term | DF | Ad SS | Ad MS | F-Stat | P-Value | % P |
|---|---|---|---|---|---|---|
| Regression | 6 | 20.2604 | 3.37673 | 38.41 | 0.026 | 99.14 % |
| Current | 2 | 16.6152 | 8.30760 | 94.49 | 0.010 | 81.30 % |
| TON | 2 | 1.6214 | 0.81069 | 9.22 | 0.098 | 7.94 % |
| TOFF | 2 | 2.0238 | 1.01189 | 11.51 | 0.080 | 9.90 % |
| Error | 2 | 0.1758 | 0.08792 | 0.86 % | ||
| Total | 8 | 20.4362 | 100.00 % | |||
| S | R-sq | R-sq(adj) | R-sq(pred) | |||
| 0.296520 | 99.14% | 96.56% | 82.58% | |||
For Ti64, the MEP’s are shown Fig. 19(a) & (b), The mean MRR is observed to be low and nearly the same for both dielectrics, as seen in Fig. 20. Similar to I718 and C276, no hazardous fumes or apparent fire hazard was seen for the ND-EDM variant. The low MRR is due to the relatively poor electrical conductivity (58.47 MS/m) of Ti64 compared to the other superalloys. A poor electrical conductivity leads to smaller sparks during the discharge phase, leading to a lower discharge current and a low MRR. Furthermore, Ti64 being a very hard material which immediately forms a passivating oxide layer on the surface. This layer not only weakens the effect of the explosive forces due to plasma collapse, but also consumes some of the discharge energy is spent in removing this layer during each pulse. Lastly, the melting range for Ti64 is the highest of the 3 superalloys (1604 – 1660 °C). Its Hardness is also at a high 36 HRC. All of these factors contribute to a low overall MRR.
The variation of MRR with the 3 process parameters is shown in Fig. 15(a) & (b). The contributions of Current are at 81.30 % for GA mist and 84.61 % for EDM oil (ANOVA
Effect of process parameters on TWR
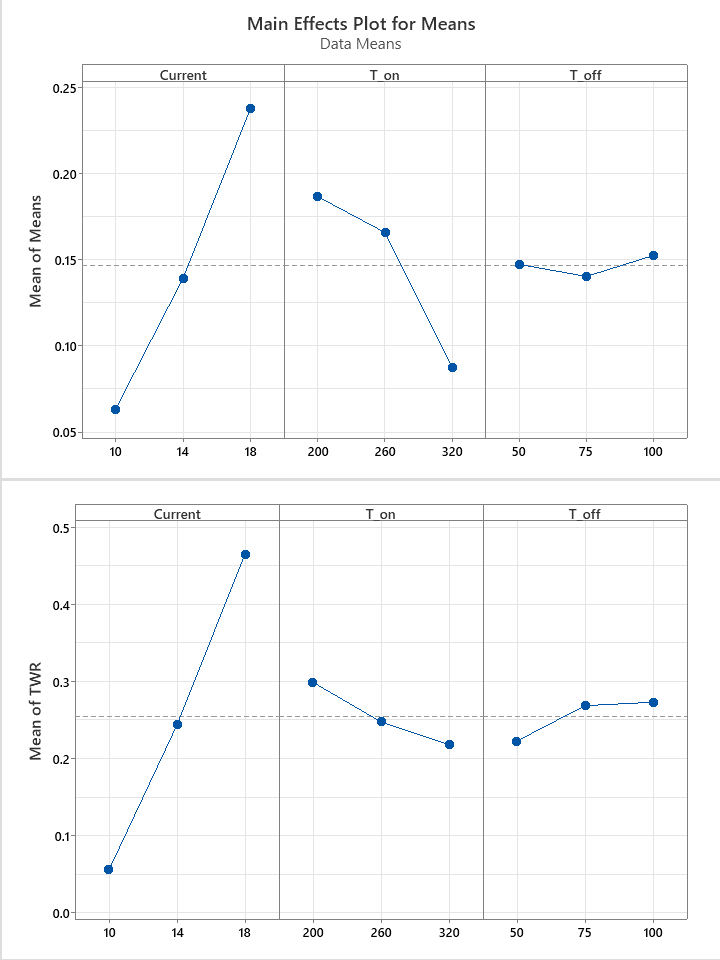
Fig 21: Main Effects Plot of TWR for Ti64
GA mist & (b) EDM oil
| Term | DF | Ad SS | Ad MS | F-Stat | P-Value | % P | ||
|---|---|---|---|---|---|---|---|---|
| Regression | 6 | 0.0623 | 0.0104 | 40.54 | 0.024 | 99.20 % | ||
| Current | 2 | 0.0457 | 0.0229 | 89.25 | 0.011 | 72.77 % | ||
| TON | 2 | 0.0164 | 0.0082 | 31.94 | 0.030 | 26.11 % | ||
| TOFF | 2 | 0.0002 | 0.0001 | 0.44 | 0.696 | 0.32 % | ||
| Error | 2 | 0.0005 | 0.0003 | 0.80 % | ||||
| Total | 8 | 0.0628 | 100.00 % | |||||
| S | R-sq | R-sq(adj) | R-sq(pred) | |||||
| 0.0160081 | 99.18% | 96.74% | 83.49% | |||||
| Term | DF | Ad SS | Ad MS | F-Stat | P-Value | % P |
|---|---|---|---|---|---|---|
| Regression | 6 | 0.2666 | 0.0444 | 136.40 | 0.007 | 99.74 % |
| Current | 2 | 0.2519 | 0.1260 | 386.60 | 0.003 | 94.22 % |
| TON | 2 | 0.0101 | 0.0050 | 15.44 | 0.061 | 3.77 % |
| TOFF | 2 | 0.0047 | 0.0023 | 7.15 | 0.123 | 1.75 % |
| Error | 2 | 0.0007 | 0.0003 | 0.26 % | ||
| Total | 8 | 0.2673 | 100.00 % | |||
| S | R-sq | R-sq(adj) | R-sq(pred) | |||
| 0.0180500 | 99.76% | 99.02% | 95.06% | |||
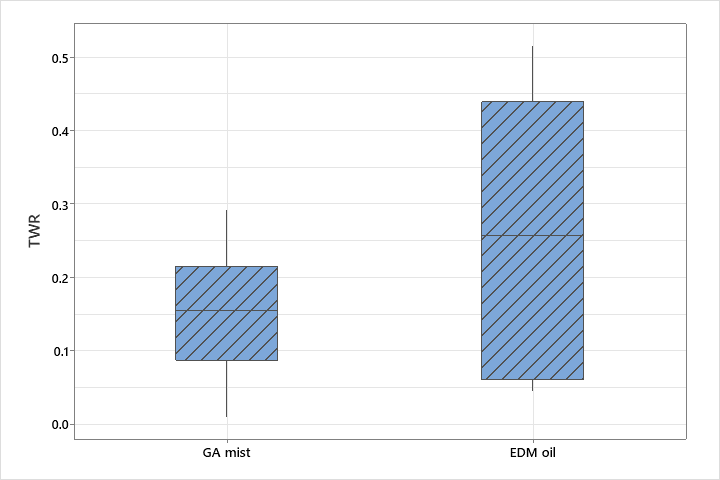
Fig. 22: Boxplot of TWR for Ti64 – GA mist vs EDM oil
The MEP’s for TWR are shown in Fig. 21(a) & (b), and the boxplot of interquartile ranges is shown in Fig. 22. The ANOVA Tables 12(a) & (b) show the Current contributions at 72.77 % and 94.22 % respectively, and the TON contributions at 26.11 % and 3.77 %. TOFF data was statistically insignificant (p-value 0.696 and 0.123 respectively). The TWR of GA mist is 1.7 times less than EDM oil. TWR increases with increase in current, and decreases with increase in TON, due to similar above discussed reasons. Fig. 17 reveals the optimum process parameters for minimizing TWR (10 A, 320 μs).
Effect of process parameters on SR
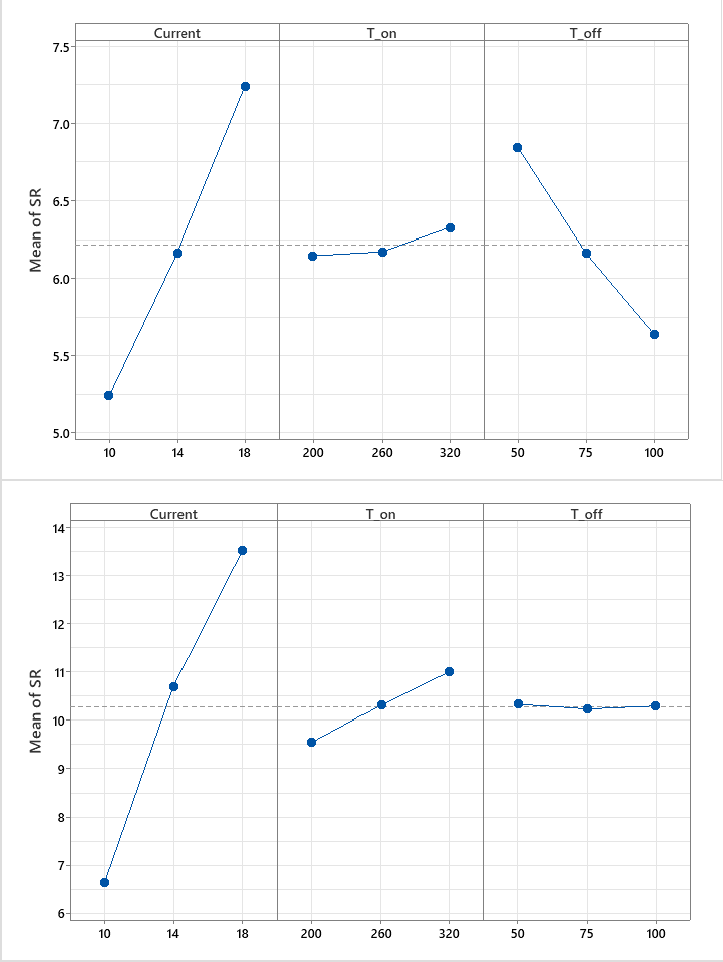
Figure 23. Main effects plot of SR for Ti64 – (a) GA mist and (b) EDM oil.
GA mist & (b) EDM oil
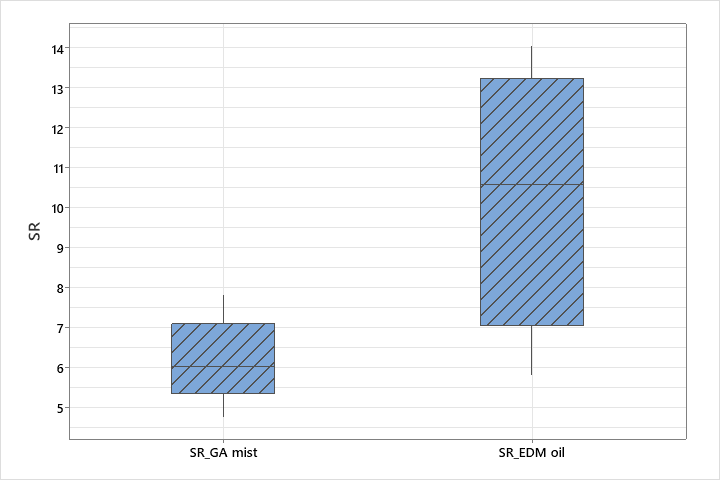
Figure 24. Boxplot of SR for Ti64 – GA mist versus EDM oil.
| Term | DF | Ad SS | Ad MS | F-Stat | P-Value | % P | |
|---|---|---|---|---|---|---|---|
| Regression | 6 | 8.2548 | 1.3758 | 49.02 | 0.020 | 99.32 % | |
| Current | 2 | 6.0114 | 3.0057 | 107.10 | 0.009 | 72.33 % | |
| TON | 2 | 0.0584 | 0.0292 | 1.04 | 0.490 | 0.70 % | |
| TOFF | 2 | 2.1850 | 1.0925 | 38.93 | 0.025 | 26.29 % | |
| Error | 2 | 0.0561 | 0.0281 | 0.68 % | |||
| Total | 8 | 8.3109 | 100.00 % | ||||
| S | R-sq | R-sq(adj) | R-sq(pred) | ||||
| 0.167524 | 99.32% | 97.30% | 86.32% | ||||
| Term | DF | Adj SS | Adj MS | F-Value | P-Value | % P |
|---|---|---|---|---|---|---|
| Regression | 6 | 75.1254 | 12.5209 | 77.18 | 0.013 | 99.57 % |
| Current | 2 | 71.9108 | 35.9554 | 221.63 | 0.004 | 95.31 % |
| TON | 2 | 3.2003 | 1.6001 | 9.86 | 0.092 | 4.24 % |
| TOFF | 2 | 0.0143 | 0.0072 | 0.04 | 0.958 | 0.02 % |
| Error | 2 | 0.3245 | 0.1622 | 0.43 % | ||
| Total | 8 | 75.4499 | 100.00 % | |||
| S | R-sq | R-sq(adj) | R-sq(pred) | |||
| 0.402779 | 99.57% | 98.28% | 91.29% | |||
The mean SR of Ti64 for the GA mist and EDM oil combinations are shown in Fig. 23(a) & (b). The ANOVA
Relative Material Removal Ratio
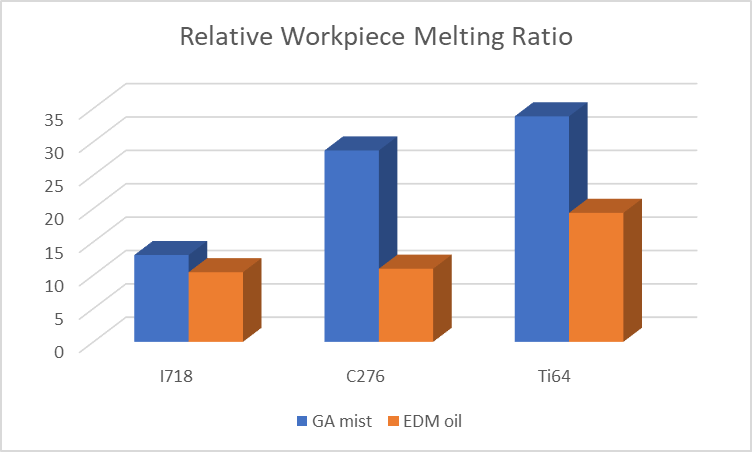
Figure 25. Relative workpiece melting ratio for the three alloys.
Here, we discuss the performance of the 3 superalloys through a parameter termed as the Relative Workpiece Melting Ratio. It is defined as the ratio of the mean MRR to the mean TWR. It can be used to infer how thermal energy is, on average, distributed amongst the workpiece and the tool side.
As is evident from previous discussion, the absolute MRR for EDM oil was recorded to be significantly more than for GA mist, and so was the TWR. Hence, it is of interest to compare the distributions of the thermal energy amongst the workpiece and tool sides in each case. It is seen from Figure 25 that the Relative Workpiece Melting Ratio is more for GA mist than EDM oil for all 3 superalloy cases. It can be inferred that for the same packet of thermal energy supplied to the IEG, a greater fraction of the energy is available for more material melting compared to EDM oil. This can be directly attributed to the glycerin droplet assisted material removal in ND- EDM, which leads to more concentration of energy on the workpiece side; compared to the bulk EDM oil, which transmits a greater fraction of the energy to the tool side. In contrast, the liquid continuum of the bulk EDM oil carries more waste heat away from the spark site, for the same packet of energy.
Thermal and Electrical Conductivities
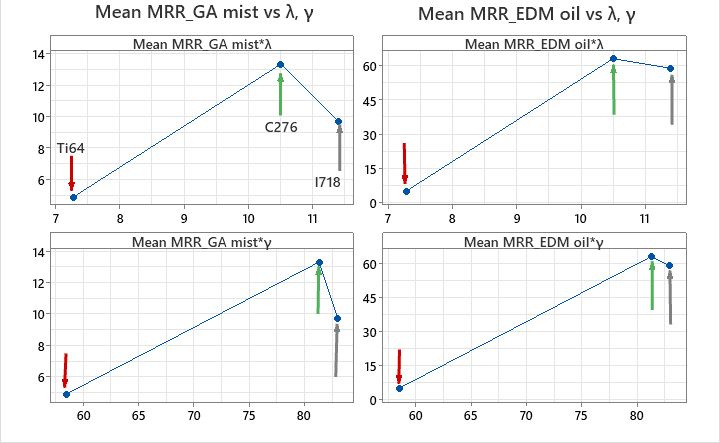
Figure 26. Mean MRR versus thermal and electrical conductivity – GA mist (left) and EDM oil (right).
In general, electrical conductivity should promote material removal, as the sparks can travel the gap easily when workpieces have higher electrical conductivity. A lower discharge voltage (different from gap voltage, see [8]) is required for the generation of a spark, increasing the overall ‘ease’ of EDMing the material. On the other hand, a good thermal conductivity and low melting point should also promote material removal, since the thermal energy is more easily absorbed by such materials.
However, a very high thermal conductivity would decrease MRR, since the thermal energy would be quickly lost to its bulk, decreasing the MRR.
A plot of Mean MRR vs the superalloys’ thermal (λ) and electrical conductivities (γ) is shown in Fig. 15 for both the dielectrics. The red arrow represents Ti64, the green arrow represents C276 and the grey arrow represents I718. Ti64, reported the lowest mean MRR in case of both GA mist and EDM oil, the reasons for which are already discussed above. Hastelloy C276, reports the highest mean MRR in case of both GA mist and EDM oil. Its much superior electrical conductivity decreased the discharge voltage, increasing the discharge current and improving the MRR. Its hardness is also the lowest among the 3 superalloys, 86 – 88 HRB, which increases the overall ease in EDMing. I718 has the next highest Mean MRR. The thermal and electrical conductivities of I718 are only marginally better than C276. The decrease in MRR is not much in case of EDM oil, however, for GA mist, it plummets by around 27 %. One of the factors would be its superior hardness of 43 – 46 HRC. Also, it was observed that the quality of machined surface for C276 – GA mist was considerably better than its I718 counterpart. Hence, we conclude that flushing conditions at the micro level are less optimum for I718 than C276, resulting in a lower MRR.
Limitations
The droplet size in the GA mist for ND-EDM plays a crucial role in how the thermal energy is transferred at the micro level. This has an impact on the final machining performance. Hence, though the mist flow setting was kept at a constant of 3 revolutions, the impact of droplet size is not examined in this study.
Since the objective of this study was EDM drilling, the SR of the EDMed workpieces in this study needs to be improved by EDM finishing processes to meet machining quality standards. More research needs to be done in this avenue.
Conclusion
In this comparative experimental investigation, the authors sought to determine whether the Near-dry EDM of Inconel 718, Hastelloy C276 and Titanium Grade 5 was possible with a high viscosity dielectric like glycerin. The authors sought to compare its machining performance with conventional wet EDM oil, to see whether it can be used as an alternative to the environmentally hazardous EDM oil. Hence, it is important to drive towards more sustainable methods. The machining performance was compared on the basis of the MRR, TWR and SR. Key findings reported are as follows:
Near-dry EDM with GA mist was successful for all 3 superalloys. It is worth noting that no fumes are recorded in case of ND-EDM and hence, it can be regarded as a green machining process. Also, the GA mist showed no evidence of fire hazards, unlike its EDM oil counterpart.
In case of I718 and C276, the range of MRR for GA mist was less than that of EDM oil. This can be regarded to dielectric breakdown at a lower temperature. MRR was 6.1 times less for I718 – GA mist, and 4.7 times less for C276 – GA mist, and nearly identical in case of Ti64.
It is seen that MRR varies significantly with all 3 process parameters; Current, TON, TOFF. Current is the most significant contributor in both GA mist and EDM oil cases, across the 3 superalloys. C276 gave the highest MRR due to its superior thermal and electrical conductivity.
TWR varies significantly with 2 process parameters; Current and TON. Current is the most significant factor. It was observed that TWR increases with Current but decreases with TON. TWR obtained for GA mist is 7.5 times, 12.7 times and 1.7 times less than that of EDM oil for I718, C276 and Ti64 respectively.
The surface morphology of the cylindrical surfaces of all 3 superalloys were examined for the ND-EDM and wet EDM drills. It was found that out of all, 6 combinations, the C276 – EDM oil combination gave the most impressive surface morphology of all. On the other hand, Ti64 – EDM oil gave the worst surface morphology. Comparing the GA mists machined surfaces of the 3 superalloys among themselves, the mean SR for 3.49 μm for I718, 5.2 μm for C276 and 6.21 μm for Ti64.
Although the absolute MRR range was lower than that of EDM oil, it is observed that the Relative Workpiece Melting Ratio was more for GA mist.
References
K. Dhakar and A. Dvivedi, “Parametric Evaluation on Near-Dry Electric Discharge Machining,” Materials and Manufacturing Processes, vol. 31, no. 4, 2016, doi: 10.1080/10426914.2015.1037905.
V. K. Yadav, P. Kumar, and A. Dvivedi, “Effect of tool rotation in near-dry EDM process on machining characteristics of HSS,” Materials and Manufacturing Processes, vol. 34, no. 7, 2019, doi: 10.1080/10426914.2019.1605171.
K. Dhakar, K. Chaudhary, A. Dvivedi, and O. Bembalge, “An environment-friendly and sustainable machining method: near- dry EDM,” Materials and Manufacturing Processes, vol. 34, no. 12, 2019, doi: 10.1080/10426914.2019.1643471.
B. K. Sahu, S. Datta, and S. S. Mahapatra, “On Electro-Discharge Machining of Inconel 718 Super Alloys: An Experimental Investigation,” in Materials Today: Proceedings, 2018, vol. 5, no. 2. doi: 10.1016/j.matpr.2017.12.062.
P. Fonda, Z. Wang, K. Yamazaki, and Y. Akutsu, “A fundamental study on Ti-6Al-4V’s thermal and electrical properties and their relation to EDM productivity,” J Mater Process Technol, vol. 202, no. 1–3, 2008, doi: 10.1016/j.jmatprotec.2007.09.060.
S. K. Sahu, T. Jadam, S. Datta, and G. Nandi, “Effect of using SiC powder-added dielectric media during electro-discharge machining of Inconel 718 superalloys,” Journal of the Brazilian Society of Mechanical Sciences and Engineering, vol. 40, no. 7, 2018, doi: 10.1007/s40430-018-1257-7.
B. Xin, M. Gao, S. Li, and B. Feng, “Modeling of Interelectrode Gap in Electric Discharge Machining and Minimum Variance Self-Tuning Control of Interelectrode Gap,” Math Probl Eng, vol. 2020, 2020, doi: 10.1155/2020/5652197.
E. Uhlmann, M. Röhner, and M. Langmack, “Chapter 3 – Micro-EDM,” in Micromanufacturing Engineering and Technology, William Andrew Publishing, 2010. doi: https://doi.org/10.1016/B978-0-8155-1545-6.00003-X.
H. A. G. El-Hofy, “Chapter 12 – Machining by Thermal Erosion,” in Fundamentals of Machining Processes: Conventional and Nonconventional Processes, Second., CRC Press, 2013, pp. 221–270. doi: 10.1201/b15339.
K. Dhakar and A. Dvivedi, “Experimental Investigation on Near-dry EDM using Glycerin-Air Mixture as Dielectric Medium,” in Materials Today: Proceedings, 2017, vol. 4, no. 4. doi: 10.1016/j.matpr.2017.05.045.
V. K. Yadav, P. Kumar, and A. Dvivedi, “Investigations on rotary tool near-dry electric discharge machining,” in Minerals, Metals and Materials Series, no. 9783319510903, 2017. doi: 10.1007/978-3-319-51091-0_31.
H. K. Tönshoff, R. Egger, and F. Klocke, “Environmental and Safety Aspects of Electrophysical and Electrochemical Processes,” CIRP Annals, vol. 45, no. 2, pp. 553–568, 1996, doi: https://doi.org/10.1016/S0007-8506(07)60510-1.
N. K. Singh, P. M. Pandey, K. K. Singh, and M. K. Sharma, “Steps towards green manufacturing through EDM process: A review,” Cogent Engineering, vol. 3, no. 1. 2016. doi: 10.1080/23311916.2016.1272662.
Tanimura T, Isuzugawa K, and Fujita I, “Development of EDM in the Mist,” in Proceedings of Ninth International Symposium of Electro Machining (ISEM IX), 1989, pp. 313–316.
C. C. Kao, J. Tao, and A. J. Shih, “Near dry electrical discharge machining,” Int J Mach Tools Manuf, vol. 47, no. 15, 2007, doi: 10.1016/j.ijmachtools.2007.06.001.
A. Gholipoor, H. Baseri, and M. R. Shabgard, “Investigation of near dry EDM compared with wet and dry EDM processes,”
Journal of Mechanical Science and Technology, vol. 29, no. 5, 2015, doi: 10.1007/s12206-015-0441-2.
M. Rahman, W. K. H. Seah, and T. T. Teo, “The machinability of Inconel 718,” J Mater Process Technol, vol. 63, no. 1–3, 1997, doi: 10.1016/S0924-0136(96)02624-6.
P. Karmiris-Obratański, E. L. Papazoglou, B. Leszczyńska-Madej, K. Zagórski, and A. P. Markopoulos, “A Comprehensive Study on Processing Ti–6Al–4V ELI with High Power EDM,” Materials, vol. 14, no. 2, 2021, doi: 10.3390/ma14020303.
L. Li, Z. Y. Li, X. T. Wei, and X. Cheng, “Machining characteristics of inconel 718 by sinking-EDM and wire-EDM,”
Materials and Manufacturing Processes, vol. 30, no. 8, 2015, doi: 10.1080/10426914.2014.973579.
Special Metals Corporation, “Inconel Alloy 718,” 2007.
S. Rajesha, A. K. Sharma, and P. Kumar, “On electro discharge machining of inconel 718 with hollow tool,” J Mater Eng Perform, vol. 21, no. 6, 2012, doi: 10.1007/s11665-011-9962-8.
C. P. Mohanty, S. S. Mahapatra, and M. R. Singh, “An Experimental Investigation of Machinability of Inconel 718 in Electrical Discharge Machining,” Procedia Materials Science, vol. 6, 2014, doi: 10.1016/j.mspro.2014.07.075.
T. Jadam, S. K. Sahu, S. Datta, and M. Masanta, “EDM performance of Inconel 718 superalloy: application of multi-walled carbon nanotube (MWCNT) added dielectric media,” Journal of the Brazilian Society of Mechanical Sciences and Engineering, vol. 41, no. 8, 2019, doi: 10.1007/s40430-019-1813-9.
R. Maurya and R. K. Porwal, “EDM of Hastelloy – An overview,” in Materials Today: Proceedings, 2019, vol. 26. doi: 10.1016/j.matpr.2019.11.298.
J. Lu, E. S. Choi, and H. D. Zhou, “Physical properties of Hastelloy® C-276TM at cryogenic temperatures,” J Appl Phys, vol. 103, no. 6, 2008, doi: 10.1063/1.2899058.
Haynes International, “HASTELLOY ® C-276 alloy,” Haynes International, 2017.
S. K. Basha, M. Kolli, and M. v. Jagannadha Raju, “Parametric optimization of Edm on Hastelloy C-276 Using Taguchi L18 Technique,” International Journal of Engineering and Technology(UAE), vol. 7, no. 2.7 Special Issue 7, 2018, doi: 10.14419/ijet.v7i2.7.10929.
R. Choudhary, H. Garg, M. Prasad, and D. Kumar, “Effect of Cryogenic Treatment of Tool Electrode on the Machining Performance and Surface Finish during Electrical Discharge Machining of Hastelloy C-4,” in Materials Today: Proceedings, 2017, vol. 4, no. 2. doi: 10.1016/j.matpr.2017.01.132.
B. Işik and A. Kentli, “The prediction of surface temperature in drilling of Ti6Al4V,” Archives of Metallurgy and Materials, vol. 59, no. 2, 2014, doi: 10.2478/amm-2014-0077.
Carpenter Technology Corporation, “CARPENTER Ti-6Al-4V,” Alloy Digest, vol. 51, no. 8, 2002, doi: 10.31399/asm.ad.ti0060.
A. Hasçalik and U. Çaydaş, “Electrical discharge machining of titanium alloy (Ti-6Al-4V),” Appl Surf Sci, vol. 253, no. 22, 2007, doi: 10.1016/j.apsusc.2007.05.031.
H. W. Deem, W. D. Wood, and C. F. Lucks, “The Relationship Between Electrical and Thermal Conductivities of Titanium Alloys,” Transactions of the Metallurgical Society of AIME, vol. 212, 1958.
N. Singh Khundrakpam, G. Singh Brar, and D. Deepak, “Grey-Taguchi Optimization of Near Dry EDM Process Parameters on the Surface Roughness,” in Materials Today: Proceedings, 2018, vol. 5, no. 2. doi: 10.1016/j.matpr.2017.12.013.
Lubeco Green Fluids, “DEF-92 EDM Fluid Datasheet,” Pune, India, 2019.
N. F. Dzulkifli, A. Mamat, and I. A. Choudhury, “The potential of water-in-oil emulsion of canola oil as dielectric fluid for EDM process,” Journal of Advanced Research in Fluid Mechanics and Thermal Sciences, vol. 72, no. 72, 2020, doi: 10.37934/ARFMTS.72.2.129141.
B. E. Rapp, “Chapter 9 – Fluids,” in Microfluidics: Modelling, Mechanics and Mathematics, B. E. Rapp, Ed. Oxford: Elsevier, 2017, pp. 243–263. doi: https://doi.org/10.1016/B978-1-4557-3141-1.50009-5.
S. Nair, A. Dutta, R. Narayanan, and A. Giridharan, “Investigation on EDM machining of Ti6Al4V with negative polarity brass electrode,” Materials and Manufacturing Processes, vol. 34, no. 16, 2019, doi: 10.1080/10426914.2019.1675891.
Cite This Work
To export a reference to this article please select a referencing stye below:

Academic Master Education Team is a group of academic editors and subject specialists responsible for producing structured, research-backed essays across multiple disciplines. Each article is developed following Academic Master’s Editorial Policy and supported by credible academic references. The team ensures clarity, citation accuracy, and adherence to ethical academic writing standards
Content reviewed under Academic Master Editorial Policy.



