
Abstract
The integration of Machine Learning (ML) into healthcare systems has been prompted by the rising need for efficient healthcare solutions as well as the complexity of medical data and patient care. This survey study offers a comprehensive examination of the many uses of ML in healthcare, providing a 2018–2023 timeframe for the topic. The study includes a detailed examination and evaluation of 70 research articles that demonstrate the developments and methods used in healthcare using ML approaches. This survey explores how ML algorithms are altering healthcare, from illness detection and treatment optimization to patient monitoring and healthcare resource management, by using the potential of artificial intelligence. To improve the accuracy and effectiveness of medical procedures, the suggested ML-based healthcare systems make use of a wide range of algorithms, including deep learning, ensemble techniques, and predictive modelling. These technologies give individualized and flexible healthcare solutions by adapting in real-time to changing patient data. Additionally, this research explores crucial topics including data preparation, feature selection, and model assessment in addition to offering a thorough description of the most recent advancements. It provides useful suggestions for enhancing the precision and potency of ML algorithms used in healthcare applications. The use of ML promises to revolutionize diagnosis, treatment planning, and patient care, eventually improving the quality of healthcare services as healthcare continues to develop and create enormous volumes of data. Healthcare professionals, academics, and policymakers can use this poll as a useful tool to navigate the fast-changing world of ML in healthcare.
Keywords: Machine Learning, Healthcare systems, artificial intelligence, illness detection, and ensemble techniques.
Introduction
By using ML technology, computers may learn on their own without having to be explicitly programmed. The main use of ML is to swap out rule-based systems with complex algorithms and statistical methods that can access the data and accurately predict outcomes. A key element in predicting ML accuracy is the dataset. As a result, the facts are more pertinent and the forecast is more precise [1]. Many industries, including banking, retail, and the healthcare sector, have adopted ML. More prospects for illness detection and therapy are being created by the growing use of ML in healthcare [2]. An important feature of ML is its capacity to improve prediction and disease-classification performance through training. The capacity of the prediction model to make better judgements for precise prediction will increase with the amount of data collected [3]. The extraction of relevant data using ML approaches is possible utilizing patient datasets stored in electronic medical records [4]. Utilizing information from electronic health records on the variables that cause diseases, data analysis, and identification of a disease’s fundamental causes, ML algorithms can aid in disease diagnosis [5]. As a method for analyzing and integrating massive volumes of complex healthcare data, ML has become more and more popular in the detection, classification, and clustering models [6]. classification of interstitial lung diseases, recognition of human parts from medical images, and image reconstruction, and the segmentation of brain tumours are just a few of the recent challenges for which ML has produced exceptional results.
Mobile health (mHealth) applications nowadays incorporate artificial intelligence, deep learning, cloud computing, big data, and ML. Wearable sensor devices with cellular network capabilities can send health information to eventually leading to cloud storage systems from hospital databases [7]. A medical analysis of the data gathered from these sources is then possible. For the diagnosis of diseases and pattern recognition, a lot of researchers have employed ML. Numerous studies have looked into the possibility of using multi-layer inference algorithms to improve the trade-off between speed and accuracy in data processing [8]. The accuracy of medical data and the efficiency of networks may be improved by ML algorithms, according to a small number of studies [9,10]. Thus, the purpose of this survey was to investigate and assess the applicability of ML approaches for improving healthcare data metrics like accuracy and efficiency. The main objective of this study was to close the knowledge gap in ML’s application to healthcare. Contributions made by this essay include the following:
Supervised ML: This category of studies examines the efficacy and limits of various ML models in the healthcare sector. Both classification and regression type approaches for supervised learning are covered.
Unsupervised ML in the medical sector: this section discusses the benefits and drawbacks of using unsupervised models in situations when labelled data are not available.
Overview of ML techniques
Modern technology (such as smartphones, computers, and robots) and health care (such as illness detection and safety) both employ ML extensively. ML is being adopted by several industries, particularly healthcare and disease diagnosis. Several academics and professionals have shown the possibility of low-cost and speedy Machine-Learning-Based Disease Diagnostics (MLBDD). Traditional diagnostic procedures take a long time, are costly, and usually involve people [11,12]. Traditional techniques of diagnosis are limited by the patient’s ability, whereas ML-based algorithms are unconstrained and do not suffer human tiredness. As a result, it could be possible to develop a method to spot illnesses in which patient counts are surprisingly high. MLBDD systems are developed using patient conditions, age, and gender data as well as tabular and image-based health data (such as X-ray and MRI images) [12,13]. A part of AI called ML uses data as an input resource. A classification or regression outcome that is typically challenging for people to achieve is produced by the application of specified mathematical functions. For instance, it is often difficult to locate cancerous cells in a microscopic picture only by looking at the image. However, using ML, this task is frequently made easy. A kind of machine learning called deep learning has advanced, and as a result, the most current study shows MLBDD accuracy of above 90%. Pneumonia, heart failure, breast cancer, and Alzheimer‘s disease are some of the conditions that ML could be utilized to identify. The development of ML algorithms for disease diagnosis is an example of how valuable the technology is for the health sector [14,15]. In summary, there are a lot of challenging industries to handle, but recent breakthroughs in ML issues, such imbalanced data, ML interpretation, and ML ethics in medical domains, are only a few. We offer a survey that focuses on the distinctive uses of ML and DL in disease diagnosis and provides an overview of progress in this field in order to shed some insight on the current trend, methodologies, and problems related with ML in sickness diagnosis. We begin by talking about various methods of machine learning (ML), deep learning, and particular architecture for recognizing and categorizing different forms of sickness diagnosis.
As indicated in Figure 1, there are two types of ML: supervised learning and unsupervised learning. With the use of known input and output data, supervised ML trains its algorithms to anticipate future results. Unsupervised ML unearths inherent patterns or hidden relationships in the input data. In contrast to unsupervised ML, which focuses on clustering tasks, supervised ML may carry out classification and regression tasks. Figure 1 shows the topology of the ML types.
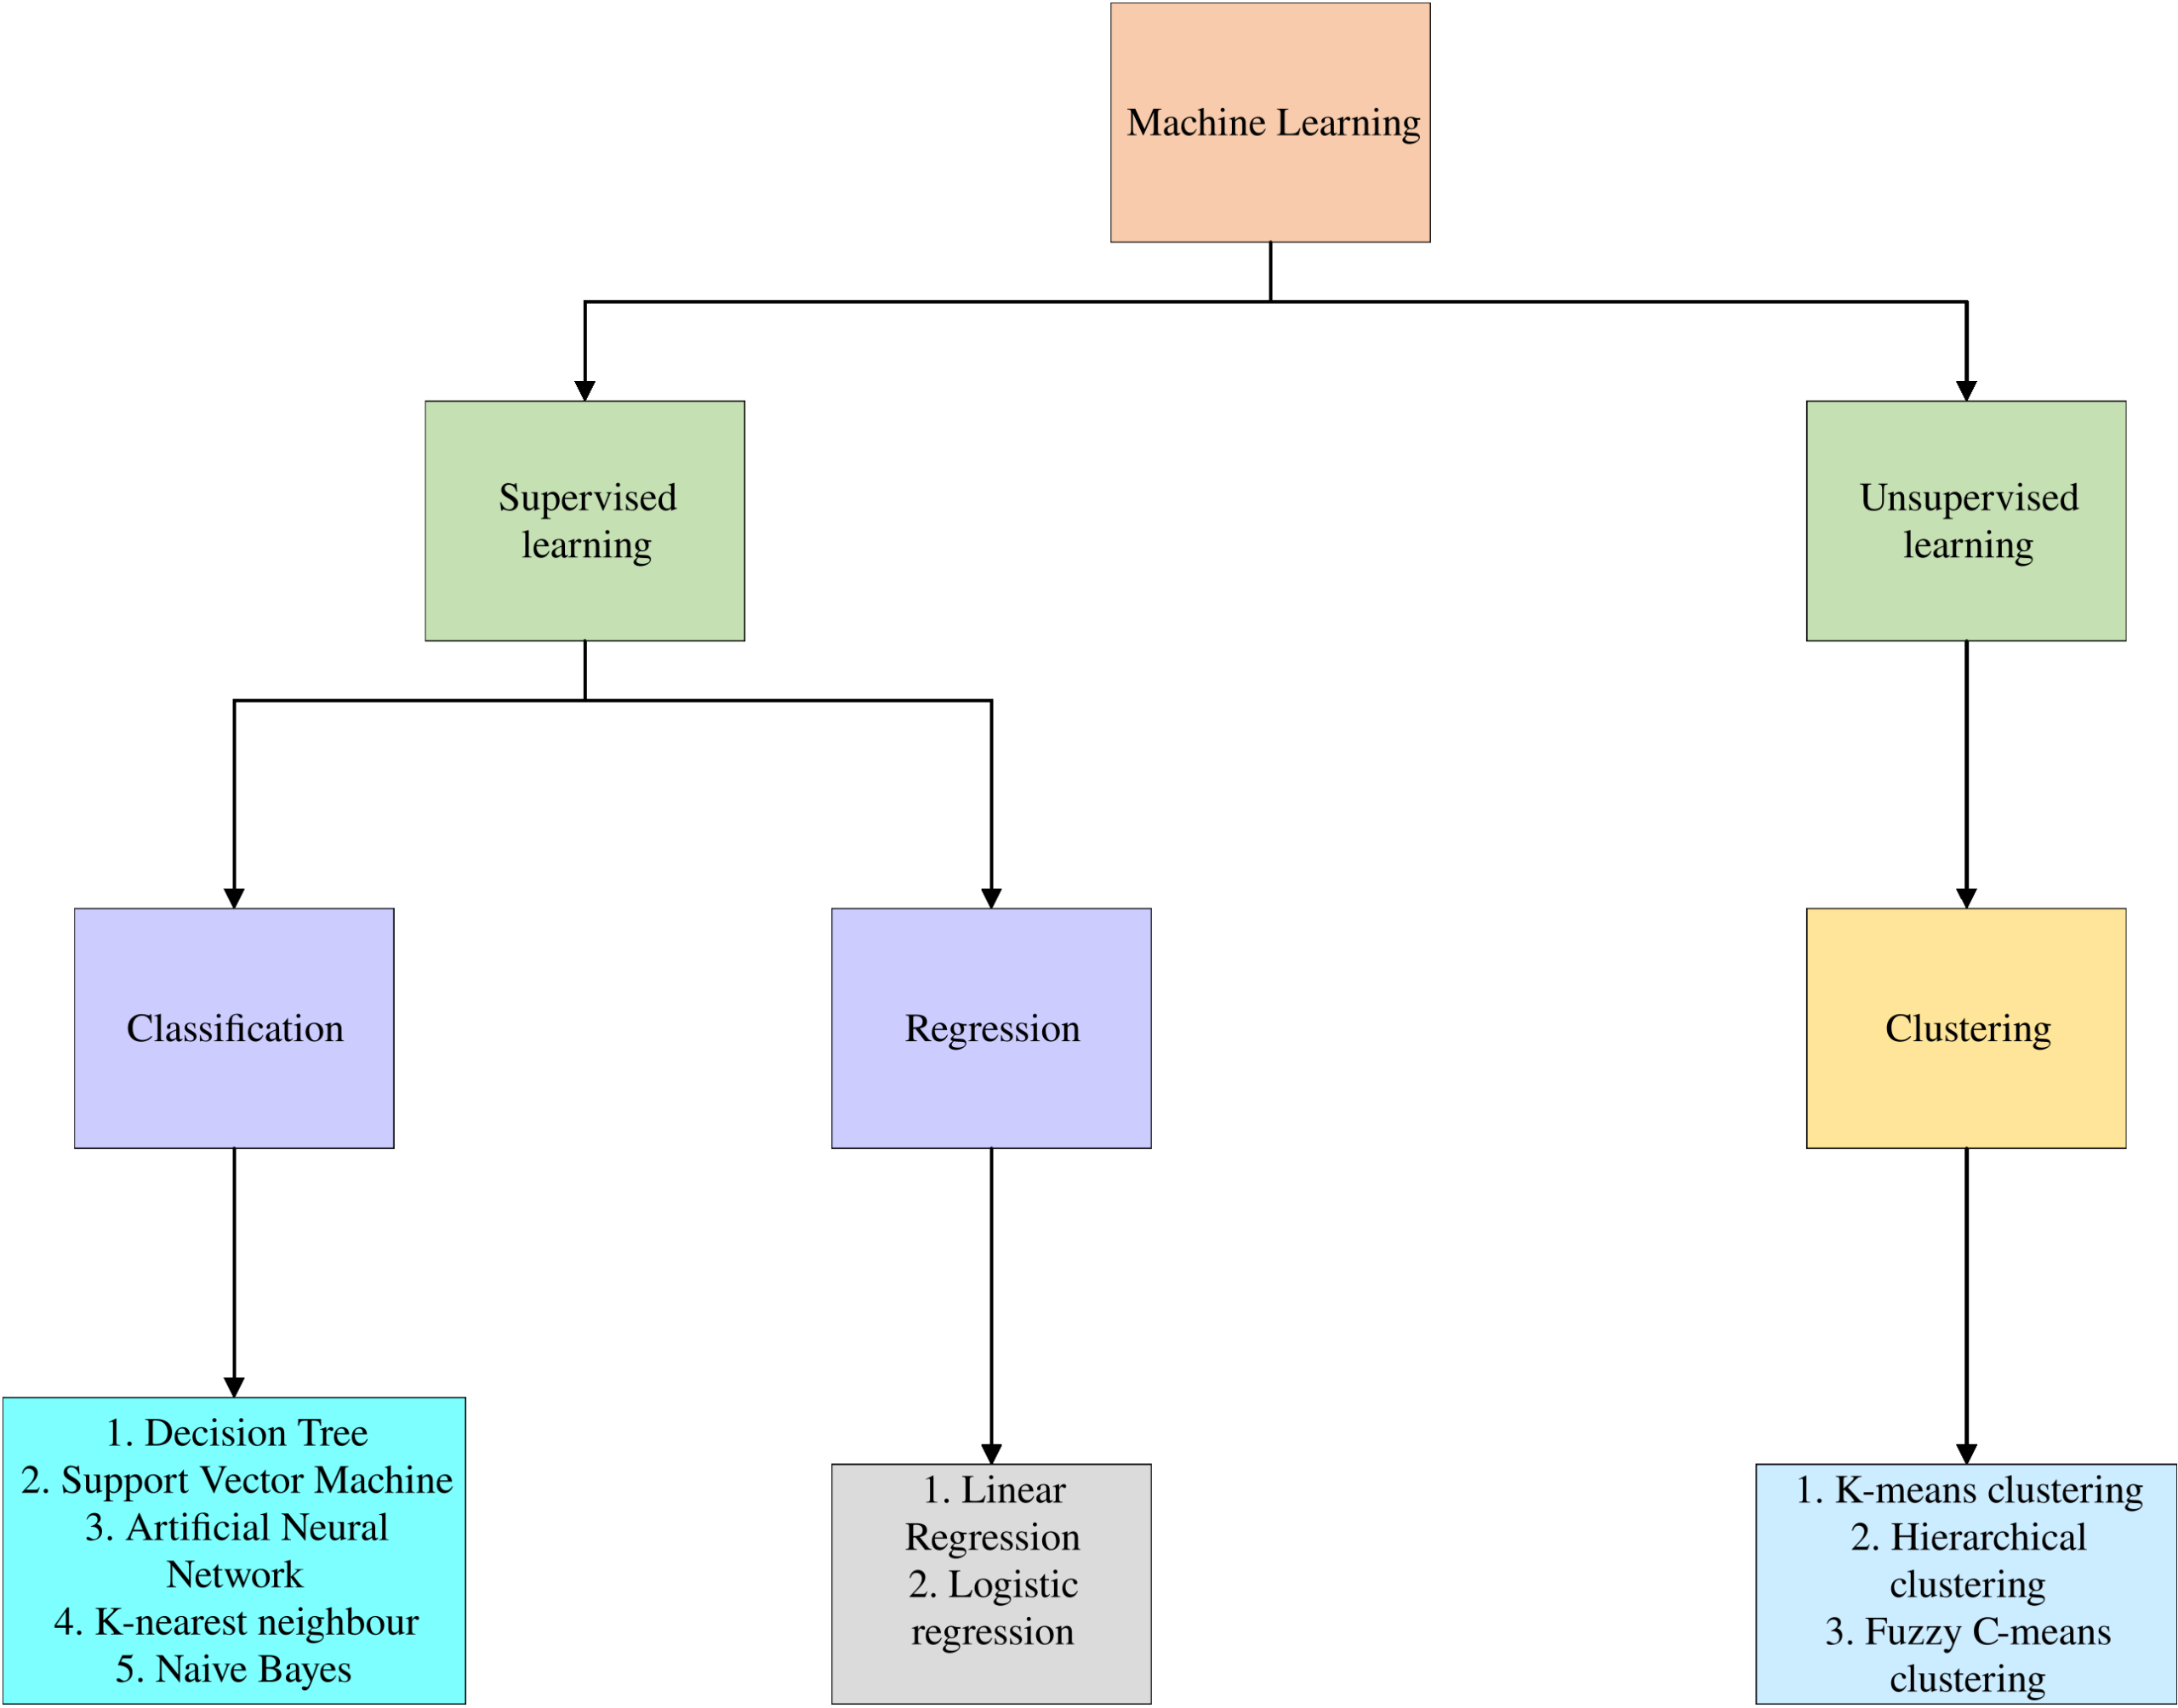
Figure 1: ML Topology
Supervised Learning (SL)
In supervised learning, the input data and the proper output or goal are coupled since the algorithm is trained on a labelled dataset. By seeing trends and connections between the inputs and the related outputs, the algorithm gains the ability to generate predictions or classifications based on this training data. Supervised learning algorithms include decision trees, support vector machines, neural networks, and many others. It’s a key component of ML and is widely used in solving real-world problems where there is a need to make predictions or decisions based on data.
SL for classification
Algorithms created using supervised ML are known as classification approaches since they are used to predict categorical outcomes, which are also known as classifications. This method differs from unsupervised learning, which uses data that isn’t labelled or categorized, in that the input data is known and labelled. Usually, training and testing sets are created from the labelled data. By grouping the input data into predetermined groups or classes, these classification algorithms are skilled at forecasting discrete responses. In a variety of disciplines, including speech recognition, medical image processing, and heart attack prediction, supervised ML has been employed in the healthcare sector and beyond.
The basic procedure is training models using labelled data, in which there is an output variable that has to be categorized in the training dataset. Fundamentally, these models identify patterns in the training data and can be used to future unlabeled data to categorize it. Decision trees (DT), Support Vector Machines (SVM), Naive Bayes (NB), and K-nearest neighbours (K-NN) are a few of the well-known supervised classification ML methods. By using the data and patterns already present to provide precise predictions and classifications, these algorithms are essential for tackling complicated issues.
Decision Tree
Decision trees are a popular ML technique for applications in classification and regression. It is a visual depiction of a decision-making process that resembles a tree, with each internal node standing for a choice, each branch for an outcome, and each leaf node for a class label or value.
In 2021, Chen, et. al., [16] have suggested a neuro-fuzzy approach with DT initialization for clinical decision support. The article suggests a method for developing precise and understandable fuzzy rule bases for clinical decision assistance using data-driven learning. The process starts with building a precise foundation of rules utilizing a DT training process that can identify fundamental rule structures. The Adaptive Network-Based Fuzzy Inference System (ANFIS) uses the crisp rule base as its input, which is then converted into a fuzzy rule base to further optimize the variables of the rule antecedents and consequents.
In 2020, Manikandan, et. al., [17] have utilized the IoT and a Hash Polynomial Two Factor DT, smart healthcare scheduling. The Hash Polynomial Two-factor DT (HP-TDT), an IoT-based scheduling algorithm, was suggested in that study to improve scheduling effectiveness and decrease reaction time by quickly categorizing patients as normal or in a critical state. The HP-TDT scheduling approach consists of three stages: enrollment, data collection, and planning. To speed up key creation during the registration step, the Open Address Hashing (OAH) approach was used. The Polynomial Data collecting (PDC) algorithm was then used to complete the data collecting step.
In 2019, Chern, et. al., [18] have suggested a DT -based classifier for telehealth services. That study attempts to solve the issue of selecting the patients who are the greatest candidates for telehealth services supported by health insurance payments. Noninvasive monitoring tools that measure blood pressure, blood glucose, and heart activity are particularly helpful for individuals with certain chronic conditions. That implies the use of the HDTTCA, a rigorous way to determining who qualified for telehealth services.
In 2022, Alex, et. al., [19] have utilized a DT for Disease Detection for Private and Energy Efficient Medical Users in a Mobile Healthcare Network. In that study, DT parameters were viewed as being private to the health cloud, resulting in the presentation of a method for confidential DT categorization with low resource utilization on edge devices for healthcare users. A symmetric key-based, additively homomorphic, energy-efficient Rivest scheme (FCRS) was developed in order to implement PDTC-LRC. To enable additive and multiplicative homomorphism, FCRS may be homomorphically decrypted at the health cloud.
In 2021, Azad, et. al., [20] have recommended a Diabetes mellitus categorization prediction model (PMSGD) combining SMOTE, genetic algorithms, and DT. The study uses data from the Pima Indians Diabetes Database (PIDD) to introduce new PMSGD and DT for the classification of diabetes mellitus. The suggested PMSGD prediction model’s structure was made up of four separate levels. Pre-processing, the initial layer, handles missing values, looks for outliers, and oversamples the minority class. The most important characteristics were chosen using correlation and genetic algorithms in the second layer. The existing papers related to the DT technique are compared in table 1.
Table 1: Comparison of DT in various medical field applications
Authors | Focus of Study | Methodology and Techniques | Key Findings/Results | Application/Impact |
Chen, et. al., [16] | Clinical Decision Support | Neuro-fuzzy approach with DT initialization for fuzzy rule base development. Initial rule foundation from DT learning mechanism. Parameters optimized for ANFIS. | Development of precise and understandable fuzzy rule bases for clinical decision support. | Enhanced clinical decision-making using data-driven learning. |
Manikandan, et. al., [17] | Smart Healthcare Scheduling | Utilized IoT and Hash Polynomial Two-factor DT (HP-TDT) for patient categorization and scheduling. Open Address Hashing (OAH) and Polynomial Data collecting (PDC) used. | Improved scheduling effectiveness and reduced reaction time. | Efficient patient categorization and scheduling in smart healthcare systems. |
Chern, et. al., [18] | Telehealth Services | DT-based classifier for identifying candidates for telehealth services. Employed HDTTCA approach. | Selection of eligible patients for telehealth services. | Enhanced healthcare service delivery and cost-effectiveness. |
Alex, et. al., [19] | Disease Detection in Mobile Healthcare | Created a private DT classification that uses less resources on edge devices. Utilized energy-efficient Rivest scheme (FCRS) for privacy. | Private disease detection with low resource consumption. | Improved data security and energy efficiency in mobile healthcare networks. |
Azad, et. al., [20] | Diabetes Mellitus Categorization | Created PMSGD model with SMOTE, genetic algorithms, and DT. Pre-processed data, oversampled minority class, and selected important features using correlation and genetic algorithms. | Successful classification of Diabetes Mellitus using PMSGD model. | Improved accuracy and efficiency in diabetes diagnosis and categorization. |
Support Vector Machine
A supervised ML approach called an SVM is employed for classification and regression problems. It is very useful for classification situations when you need to identify a decision boundary that effectively distinguishes between several classes. SVMs are renowned for their proficiency with high-dimensional data and success in situations involving distinct class separations.
In 2020, Singh, et. al., [21] have utilized the SVM to predict the COVID-19 corona virus pandemic using time series data. The objective of this study was to employ the SVM model to deliver forecasts in real time. The purpose of the article was to analyze and forecast the registered, died, deaths, and death numbers per reported case (Mortality Rate) based on the world health statistics for the worldwide population provided by Corona-19. According to the author’s research, the number of verified cases was strongly connected with the regular death rate of COVID-19. Additionally, it could be influenced by the population’s eating habits and immunological system. According to the study, an emergency scenario may arise before the right vaccination was developed.
In 2019, Battineni, et. al., [22] have used the SVM to forecast dementia, ML in medicine calculates performance. The current study’s objectives were to examine how SVMs are used in dementia prediction and to confirm their effectiveness using statistical analysis. The data came from a longitudinal collection of 373 MRI scans from 150 patients in the Open Access Series of Imaging Studies (OASIS-2) study; the sequence between sets of various participants was the best hyperplane, which fails to account for the issue about accurate different determination within a few neurological disorders.
In 2019, Haq, et. al., [23] have presented a Parkinson’s disease prediction method based on ML and voice recordings. The SVM was utilized as an analytical framework for the prediction of PD in the creation of the suggested system. In order to accurately classify the target population into PD and healthy individuals, the L1-norm SVM of feature selection was applied. Based on a feature weight value, the L1-norm SVM generated a fresh subset of traits from the PD dataset. The K-fold cross-validation technique was used to validate the proposed system.
In 2018, Yang, et. al., [24] have suggested that Arrhythmia may be automatically recognized using a linear SVM and a Principal Component Analysis (PCA) network. The study classified 107,164 heartbeats from the MIT-BIH database using the convolutional deep learning network PCANet and the linear SVM. In order to evaluate the effectiveness of our approach, we ran an experiment using two skewed data sets containing noisy and noise-free ECGs. an other strategy, such as the dimension reduction method, data augmentation that makes use of the synthetic minority over-sampling technique (SMOT), or other methods, may be able to increase the recognition accuracy.
In 2020, Ismail, et. al., [25] have performed the creation of a smart healthcare system based on dynamic time warping and SVM. The suggested method employed a Raspberry Pi device to provide wireless smartphone management of household appliances. That system’s major objective was to make it easier for users to connect with household appliances using IoT communications that were based on voice commands. The proposed framework contribution improves voice recognition by using a hybrid SVM and Dynamic Time Warping (DTW) method.
In 2018, Venkatesan, et. al., [26] have suggested an abnormality detection in remote healthcare applications using ECG signal preprocessing and SVM classifiers. In that study, ECG signal preprocessing and SVM-based arrhythmic beat classification were applied to discriminate between normal and abnormal subjects. In order to decrease the amount of computer components while maintaining high speed and low latency design, a delayed error normalized LMS adaptive filter was used in the preprocessing of ECG data. Since the signal processing method was developed for remote healthcare systems, white noise reduction was the main focus. On the preprocessed data, discrete wavelet transform was used to extract the HRV features, and machine learning methods were used to classify arrhythmic beats. Table 2 contrasts the reported SVM technique-related research.
Table 2: Comparison of SVM in various healthcare system
Authors | Disease Focused | Methodology and Techniques Used | Key Findings | Drawbacks |
Singh, et. al., [21] | COVID-19 Pandemic Prediction | SVM for real-time forecasting, analysis of global health statistics. | Strong connection between verified cases and COVID-19 death rates, insights into population factors. | Lack of consideration for socio-economic factors that can impact the pandemic. |
Battineni, et. al., [22] | Dementia Prediction | SVM for dementia prediction using MRI data, statistical analysis of SVM effectiveness. | Examination of SVM in dementia prediction, evaluation of SVM performance using MRI data. | Limited discussion on potential biases in the MRI data or generalizability of results. |
Haq, et. al., [23] | Parkinson’s Disease Prediction | SVM and L1-norm feature selection for PD prediction, K-fold cross-validation. | Effective PD prediction using voice recordings and SVM. | Lack of information on the size and diversity of the dataset used. |
Yang, et. al., [24] | Arrhythmia Detection | Linear SVM and PCA network for arrhythmia detection using ECG data. | Automatic recognition of arrhythmia using SVM and PCA network. | Limited discussion on the scalability of the approach to larger datasets. |
Ismail, et. al., [25] | Smart Healthcare System | Dynamic Time Warping and SVM for voice-based IoT communications. Raspberry Pi device usage. | Creation of a smart healthcare system for voice-based IoT appliance control. | Limited information on the security measures employed in the voice-based IoT system. |
Artificial Neural Network
An ANN, a type of computer model, is based on how the human brain functions and is structured, notably the network of linked neurons. Pattern recognition, classification, regression, and other processes are among the many tasks that are carried out by ANNs, a subset of ML algorithms.
In 2022, Jader and Aminifar [27] have developed a diabetic mellitus prediction model utilising an ANN. The dataset was obtained from the Kurdistan region, where information on expecting mothers with and without diabetes was collected. The goal of that article was to develop a neural network model that minimized the error function during neural network training. Based on the development of the ANN model, the accuracy of the prediction increased and the error rate of the neural network during training decreased.
In 2021, Thanga Selvi and Muthulakshmi [28] (a subsequently retracted article) have introduced an ideal ANN-based big data model for classifying and diagnosing heart disease. The teaching and learning based optimization (TLBO) algorithm for ANN, also known as (TLBO-ANN), and distance-based misclassified instance removal (DBMIR) were the two primary processes included in the proposed OANN. An Apache Spark-like Big Data framework was used to create the suggested model. The online prediction and off-line prediction phases of the described OANN model are how it functions. The benchmark dataset for heart disease was used to train and evaluate a model during the stage of machine prediction. Similar to that, real-time data from the online prediction stage will be sent into an Apache Spark model, where the filtered data was diagnosed using a trained model to provide the prediction results.
In 2020, Kim and Huh [29] have addressed the current weaknesses in the secure and correct verification of medical data and PHR data stored in medical institutions, the article introduced the employment of artificial intelligence blockchain algorithms. In order to match the actual various health information, the study additionally creates images for health information in the Electronic Medical Record (EMR), Pictorial Archiving and Communications Network, Ordering Communication Software, and the Individual Health Record. The study revealed how to confirm it utilizing exact image data retrieval and a blockchain-based on PHR data from medical facilities by utilizing a wide range of contemporary artificial intelligence and blockchain technology. Additionally, it provided several blockchain frameworks for artificial intelligence.
In 2022, EP, et. al., [30] have used the ANN in conjunction with high-quality healthcare systems to predict diabetes. The study developed an ensemble voting classifier based on neural networks to effectively forecast patients’ diabetes using real-time monitoring. IoT (Internet of Things) devices were used in the study to track the patients’ situations. For monitoring, data were delivered from IoT devices to smartphones. After that, from smartphones to the cloud, classification was performed. IoT devices were used in the study to monitor the patients’ behaviours and results. When data from smartphones and IoT gadgets is submitted to the system, categorization takes place on the cloud.
In 2021, Mousavi, et. al., [31] have suggested a randomized facility localization challenge in healthcare using an ANN-based mathematical framework. The suggested method had three separate goals: to cut back on total costs, transferring times, and waiting periods inside trauma centres. The intricacy of a trauma center prevents the third aim from being articulated analytically. To calculate the third target function’s approximation, an ANN was first trained using a simulation model. To explore the solution space, it was possible to develop a hybrid multiple-purpose algorithm using a nondominated sorted water flow algorithm.
In 2023, Alshanbari, et. al., [32] have tested an ANN model and evaluate it against several univariate time series models using a coronavirus dataset that contains the diseased cases, many fatalities, and recovered cases. For predicting confirmed cases, deaths count, and recovered cases, take five univariate time series models into consideration as opposed to the ANN model. To further verify the correctness of the mean errors, a statistical technique called the Diebold and Mariano test was used.
In 2021, Kuvvetli, et. al., [33] have suggested a COVID-19 pandemic forecasting model employing ANN. The objective of the research was to create an ANN-based forecasting system that could anticipate the number of daily cases and deaths caused by COVID-19 in the future in a way that was generalized to fit the distributions of different nations. In order to help the government, adopt preventative measures for hospitals and medical institutions, that study offers an ANN model. The healthcare systems can react more quickly to an outbreak or pandemic if this study was expanded to include additional diseases. The study’s drawback was that the suggested adaptive prediction. In table 3, the papers used for medical field with the ANN models are discussed.
Table 3: Comparison of ANN in various healthcare applications
Research Paper | Research Focus | Methodology and Techniques | Key Findings and Results | Limitations and Drawbacks |
Jader and Aminifar [27] | Diabetes Mellitus Prediction | Artificial Neural Network (ANN) model with error minimization during training. | Improved prediction accuracy with ANN model over time. | Lack of information on dataset details. |
Thanga Selvi and Muthulakshmi [28] (a subsequently retracted article) | Heart Disease Classification and Diagnosis | ANN-based big data model with TLBO-ANN and DBMIR. Usage of Apache Spark-like Big Data framework. | Online and offline prediction phases, real-time diagnosis with Apache Spark model. | Limited discussion on model scalability. |
Kim and Huh [29] | Secure Medical Data Verification | Utilization of artificial intelligence blockchain algorithms for medical data security. Image data extraction and blockchain-based validation. | Enhanced security for medical data verification, introduction of blockchain frameworks. | Lack of computational resource details. |
EP, et. al., [30] | Diabetes Prediction with IoT Monitoring | Ensemble voting classifier based on neural networks. Real-time monitoring using IoT devices. | Effective diabetes prediction with real-time IoT monitoring. | Limited information on system scalability and robustness. |
Mousavi, et. al., [31] | Stochastic Facility Localization in Healthcare | Mathematical model based on ANN for cost and time optimization. Use of hybrid multi-objective algorithm. | Reduction in overall cost and improved time metrics in facility localization. | Lack of computational complexity details. |
Alshanbari, et. al., [32] | Coronavirus Dataset Analysis | Comparison of ANN model with univariate time series models for predicting COVID-19 data. Application of Diebold and Mariano test for error verification. | Evaluation of ANN model’s performance against time series models. | The study does not explore the reasons for differences in model performance. |
Kuvvetli, et. al., [33] | COVID-19 Pandemic Forecasting | Development of an ANN-based prediction model for forecasting daily cases and fatalities. | Introduction of a generalized ANN model for predicting COVID-19 data. | The study’s adaptive prediction approach is not specified. |
K-nearest neighbor
The K-NN algorithm is an easy-to-use and effective machine learning technique applied to both classification and regression issues. This instance-based, non-parametric technique provides predictions by taking into account the “k” data points (neighbours) that are closest to the input data point.
In 2023, Abirami and Karthikeyan [34] have utilized an improved fuzzy-based K-NN Classifier Model, the Digital Twin-Based Healthcare System (DTHS) enables earlier detection and diagnosis of Parkinson disease. The DS1 and DS2 datasets were the focus of the experiments in that paper. They were acquired via Kaggle and the UCI ML repository, respectively. The Optimized Fuzzy based K-NN(OF-K-NN) classifier algorithm was used to create the suggested DTHS via a cloud platform for the prediction of Parkinson illness. That kind of non-clinical prediction was making it easier to track and diagnose distant patients using speech data that were gathered from those individuals.
In 2021, Wazery, et. al., [35] have utilized a potent slime mould algorithm for K-NN problems in the field of medicine. The study suggests ISMA, an enhanced slime mould algorithm (SMA) that combines the opposition-based learning (OBL) technique with the K-NN classifier as a classification method. While preventing premature convergence, opposition-based learning enhances one’s capacity for global exploration. The suggested ISMA-k-NN technique beat the well-known, cutting-edge restricted optimization algorithms and the original SMA algorithm built on the k-NN classifier in most cases.
In 2020, Haque, et. al., [36] have recommended a K-NN Training with Encrypted Health Data on Blockchain for Privacy Preservation. In the course of that effort, secure K-NN, a novel privacy-preserving K-NN training method, was created. Secure K-NN may be used to solve issues with data privacy and integrity. In a multi-party setting where the IoT data was acquired from several data sources, it employs Blockchain technology to train the algorithm. An efficient and trustworthy technique was put together using the Paillier partial homomorphic cryptosystem. That study demonstrates the effectiveness and security of secure K-NN. The suggested technique exceeds the previous state of the art and achieves accuracy that was practically comparable to generic K-NN.
In 2022, Alotaibi [37] have presented a hybrid method for predicting erythemato-squamous illnesses using clinical data. The suggested model may be effectively employed for the diagnosis of the condition under research, according to the experimental results. By removing fewer contributing features from the dataset, that model has enhanced the performance of standard K-NN and increased the efficiency of the trained model. The model’s key drawback was that since it was trained on clinical data, it cannot be applied with imaging data or biological signals.
In 2019, Ye, et. al., [38] have suggested a prediction model known as HHO-FK-NN, which uses the Harris Hawks Optimization (HHO) to improve the fuzzy K-NN (FK-NN). The suggested model was used to differentiate between COVID-19 severity levels. The goal of incorporating HHO in HHO-FK-NN was to simultaneously optimize the FK-NN’s optimal parameters and feature subsets. Additionally, the research produced secure K-NN, a novel privacy-preserving K-NN training method that might solve issues with data privacy and integrity. The algorithm is trained using Blockchain technology in a multi-party setting where the IoT data was gathered from several data providers. The outcomes show that the suggested HHO-FK-NN may produce better classification accuracy and greater reliability on the four indices in addition to filtering out the crucial traits that distinguish severe COVID-19 from moderate COVID-19.
In 2021, Kumar and Thakur [39] have utilized a fuzzy K closest neighbour algorithm with changing neighbours, identify liver disorders. The variable-neighbor weighted fuzzy K-NN approach (Variable-NWFK-NN), an upgraded version of fuzzy-NWK-NN, is suggested in this study. Three real-world imbalance liver function test datasets—BUPA, ILPD from UCI, and MPRLPD—are used to apply the suggested Variable-NWFK-NN approach. Future research will focus more on examining how the Variable-NWFK-NN behaves when used with additional illness datasets and can be customized to work with datasets from more than two classes.
In 2021, Kumar, et. al., [40] have performed MRI brain tumour identification utilizing an adaptive k-NN classifier and the best possibilistic fuzzy C means clustering technique. The noise in the input picture was first eliminated using the Median Filter since it will affect the classification process’ accuracy if it was there. The photos were immediately transformed into 33 blocks. Following that, the pre-processed picture was used to extract the texture characteristics. The adaptive K-NN classifier uses the features after the feature extraction procedure to determine whether a picture was normal or abnormal. Following that, the tumour patches were divided using the best possibilistic Fuzzy C-Means (FCM) Clustering technique.
In 2020, Garcia-Carretero, et. al., [41] have utilized a K-NN model, a population with high levels of obesity and blood pressure may be predicted to acquire type 2 diabetes within two years. It used a time series analysis using the features of each patient to calculate one linear regression line and one slope for each feature. A K-NN classification model was then updated using the features. The random forest method was used to determine feature significance. The random forest technique was used to identify the most important factors from the homeostatic model evaluation, including anticipated insulin resistance, insulin levels, and body mass index. That created a predictive model that correctly recognized obese, hypertension individuals who were at risk of developing T2DM within a two-year window.
In 2020, Saeedi, et. al., [42] have suggested a unique technique for distinguishing between depressed patients and healthy controls were presented. It makes use of short-term EEG data. Two entropy measures—sample and approximation—were applied to the wavelet packet coefficients as nonlinear features, and a genetic algorithm (GA) was used to choose the most important features. Three machine learning techniques were used for classification: SVM, multilayer perceptron (MLP), and a special enhanced K-NN (E-K-NN), which uses GA to optimize the feature-space relations and generates a feature importance index. The papers related to the K_NN models in the medical applications are compared in table 4.
Table 4: Comparison of K-NN in various healthcare applications
Authors | Research Focus | Methodology and Techniques Used | Main Discoveries and Outcomes | Study Limitations |
Abirami and Karthikeyan [34] | Parkinson Disease Detection | Enhanced K-NN Classifier Model with Fuzzy Logic (OF-K-NN) using voice data. | Improved early detection of Parkinson’s disease, facilitating remote monitoring. | Lack of information on model scalability and generalizability. |
Wazery, et. al., [35] | Medical Classification | Slime Mould Algorithm (ISMA) combined with K-NN and opposition-based learning. | Outperformed traditional optimization algorithms for medical classification. | The study does not explore scenarios where ISMA may not be advantageous. |
Haque, et. al., [36] | Privacy-Preserving K-NN Training | Blockchain-based K-NN training with encrypted multi-party IoT data. | Enhanced data privacy and integrity in K-NN training using blockchain. | Insufficient details on computational overhead introduced by blockchain. |
Alotaibi [37] | Skin Disease Prediction | Hybrid approach for skin disease prediction, enhancing K-NN with feature reduction. | Improved prediction accuracy with less relevant feature removal. | Limitation in handling imaging data or biological signals. |
Ye, et. al., [38] | COVID-19 Severity Prediction | HHO-FK-NN model combining Harris Hawks Optimization with fuzzy K-NN. Comparison with other ML algorithms. | Better classification performance and feature selection for COVID-19 severity levels. | Lack of insight into settings where HHO-FK-NN may not be suitable. |
Kumar and Thakur [39] | Liver Disorder Identification | Variable-neighbor weighted fuzzy K-NN approach (Variable-NWFK-NN) applied to liver function test datasets. | Enhanced performance in liver disorder identification, but need for broader dataset evaluation. | Future research needed to explore Variable-NWFK-NN with datasets from more than two classes. |
Kumar, et. al., [40] | MRI Brain Tumour Identification | Best-possibilistic K-NN classifier in combination with adaptive Identification of MRI brain tumours using fuzzy C-Means Clustering. | Accurate identification of normal and abnormal brain MRI scans. | Limited discussion on the scalability and applicability of the approach to different datasets. |
Garcia-Carretero, et. al., [41] | Type 2 Diabetes Prediction | K-NN model for predicting type 2 diabetes in a population with obesity and high blood pressure. | Development of a predictive model for identifying individuals at risk of diabetes. | Limited information on the model’s performance in diverse populations. |
Saeedi, et. al., [42] | Depression Detection with EEG Data | Enhanced K-NN variant (E-K-NN) using wavelet packet coefficients, sample entropy, and genetic algorithm for EEG-based depression detection. | Accurate differentiation between depressed patients and healthy controls using short-term EEG data. | The study does not discuss the model’s performance in various EEG data acquisition scenarios. |
Naive Bayes
A classification technique called Naive Bayes is based on the Bayes theorem, which is a cornerstone of probability theory. It is especially helpful for applications involving text categorization and other categorical data. The word “naive” in the term “naive bayes” refers to the idea that the characteristics used for categorization are conditionally independent, i.e., the presence or absence of one feature does not impact the presence or absence of another feature.
In 2021, Alwateer, et. al., [43] have introduced an ambient healthcare approach using NB classifier and Hybrid Whale Optimization Algorithm (HWOA). Accepting a variety of data kinds, increasing accuracy, and speeding up processing were the major goals. The strategy that was being suggested makes use of a hybrid algorithm that comprises two stages. By utilized the HWOA as a feature selection method, the first stage aims to decrease the number of characteristics for massive data. The second step follows by doing real-time data classification using the Nave Bayes Classifier.
In 2021, Jackins, et. al., [44] have utilized random forest classifier and NB, it was possible to anticipate clinical disease intelligently using AI. The objective of the effort was to identify a model for the identification of diabetes, coronary heart disease, and cancer using the information provided. From internet resources, the dataset was selected. Filling in missing data and eliminating associated columns were two pre-processing strategies used. The preprocessed dataset was then subjected to the classifier, and Bayesian and random forest models were created after that. Due to the vast quantity of data collected to estimate the performance of train data, the suggested model’s processing time was its main drawback.
In 2022, Deepa, et. al., [45] have applied a ML and the IoT to forecast COVID-19 risk in a pandemic condition using the NB classifier which increase accuracy. IoT devices and ML were both current technologies that may be used together. A unique ML-based strategy was suggested for predicting the risk associated with COVID-19. For the purpose of making predictions based on data gathered by sensors, Random Forest and NB classifier were employed. Groups of people were identified, and for those groups with larger populations, the impact of the disease can be diminished.
In 2022, Mansour, et. al., [46] have suggested a Feature Correlated NB (FCNB) classification approach for accurately detecting Covid 19 patients. FCNB, a brand-new COVID-19 diagnostic method, has been introduced in that work. The FCNB was composed of four phases: The Feature Selection Phase (FSP), the Master Feature Weighting Phase (MFWP), the Feature Clustering Phase (FCP), and the Feature Correlated NB Phase (FCNBP). The Genetic Algorithm is used as a wrapper technique by the FSP to select just the most useful qualities from the details collected from laboratory testing for COVID-19 patients and non-COVID-19 individuals. A unique clustering approach was employed by the FCP to create several feature clusters based on the selected characteristics from the FSP.
In 2021, Shaban, et. al., [47] have performed a classification technique using distance biased Nave Bayes (DBNB) allows for the accurate identification of COVID-19 patients. Which provided a precise and clever classification approach that may be used to deliver smart medical diagnostics in that study. The two key components of our classification strategy—feature selection and a novel classification model—make up DBNB. From the characteristics that were derived from the patient’s laboratory results, APSO selects the most useful and informative aspects. The chosen characteristics were then given a weighted average to feed the suggested classification model, which consists of the WNBM and DRM modules, to help the user make an informed selection.
Supervised Regression models
ML methods called supervised regression models are employed to address regression issues. Regression attempts to forecast a continuous, numerical output or target variable using attributes from the input data. To understand the relationship between the attributes and the objective variable, these models use marked training data.
Linear Regression
Linear regression is one of the most often used and simple regression models. It assumes that there is a linear connection between the intended output and the input attributes. The model determines that the best fit is a linear equation that minimizes the sum of squared differences between the predicted and actual values.
In 2020, Huang, et. al., [48] have utilized several locally weighted linear regression models with K-MC to predict the morbidity of chronic obstructive pulmonary disease. Inflammation caused by dangerous gases and airborne particulate matter was a prominent cause of chronic obstructive pulmonary disease (COPD), a respiratory condition that affects many people. In order to identify COPD early, develop customized therapies to limit the disease’s course, and save medical costs, mathematical prediction models connecting COPD and air contaminants are important. A regression prediction model for the likelihood of COPD acute exacerbations was to be developed.
In 2020, Mallik, et. al., [49] have used data on DNA methylation and gene expression, a linear regression and deep learning method is developed to detect reliable genetic alterations in cancer. The research presented a methodology that combines deep learning, differential expression, and uterine cervical carcinoma may be integrated with DNA methylation and related TCGA gene expression data using linear regression to provide the necessary biological interface. The anticipated gene expression information from the preprocessed DNA methylation data were estimated using TCGA gene expression data after outliers had been removed and linear regression had been applied.
In 2022, Lin, et. al., [50] have compared the predictive power of assessing aberrant Th-201 scans using four ML techniques to the more conventional multiple linear regression (MLR). The analysis of aberrant Th-201 scans also included the use of categorization and regression tree (CART), stochastic gradient boosting (SGB), RF, and eXtreme gradient boosting (XGBoost) in addition to conventional MLR. The endpoint (dependent variable) was the stress total score. The findings show that ML was superior to MLR in detecting abnormal Th-201 scans using clinical variables, since all four RMSE of ML are lower than those of MLR.
In 2020, Rath, et. al., [51] have made use of a multivariate linear regression model to make predictions the occurrence of fresh instances of the coronavirus disease (COVID-19) pandemic. The study made the analysis of daily data on disease-affected individuals was used to predict the trend of diseased cases in Odisha and across India over the coming days. The correlations between the total number of confirmed, active, deceased, and positive cases were presented using a reliable worldwide data set that was obtained from the WHO daily statistics. To see the trend of the impacted instances, the data set was subjected to regression modelling using linear and multiple linear regression approaches.
In 2023, Lashgari, et. al., [52] have determined the risk variables impacting the mortality rate of COVID-19 illness, adaptive elastic-net sliced inverse regression was used. The research suggested a method based on Adaptive Elasticnet Sliced Inverse Regression to find coronavirus disease (Covid-19) risk factors when there was collinearity between explanatory variables. By using that method, the dimensions are sufficiently reduced, and a more exact and reliable model for variable selection is presented when the drawbacks of elastic net and sliced inverse regression are taken into account. The suggested technique on simulated data as well as the new Covid-19 illness dataset.
Logistic regression
Logistic regression is a supervised ML method utilized for binary classification applications. Logistic regression, as opposed to regression models that forecast continuous values, is intended to forecast the likelihood that an input data item belongs to one of two classes.
In 2021, Xiao, et. al., [53] have introduced Alzheimer’s disease early diagnostic model using Sparse Logistic Regression (SLR). In that study, the early detection of AD was performed. A sparsity restriction on logistic regression was imposed by SLR, which employs L1/2 regularization. The L1/2 regularization was seen as an example of the Lq regularization, which uses fewer but more insightful critical brain areas to classify AD/MCI. In our SLR analysis, 197 participants from the Alzheimer’s Disease Neuroimaging Initiative dataset were used.
In 2022, Abdullah, et. al., [54] have utilized Firth’s Logistic Regression, identify blood-based multi-omics biomarkers for Alzheimer’s disease. That study validated earlier findings that established important AD-associated biomarkers using an integrated multi-omics approach. The development of the AD diagnosis and therapy may greatly benefit from multi-omics research. For the discovery of biomarkers, future study might investigate ML techniques. When both scenarios were present in the dataset, the ensemble approach of Principal Component and Firth Logistic Regression would finally add to theory and practice.
In 2021, Zhang, et. al., [55] have used Bioinformatics and Logistic Regression, A combination diagnostic biomarker for non-small-cell lung cancer using GNGT1 and NMU has been found. The results highlighted two hub genes’ potential roles in NSCLC and identified GNGT1 and NMU as predictive target genes. However, there were a few limitations to that study that needed to be taken into consideration. Due to the fact that all the information utilized in the current study was gathered from open sources, additional, independent research was required to verify our findings and examine the molecular processes of the hub genes in the development and progression of NSCLC.
In 2020, Ding, et. al., [56] have utilized to forecast fresh CircRNA-disease associations, a logistic regression model and a random walk were used. In that study, a Random Walk and Logistic Regression (RWLR) computer model was developed to predict the relationships between circRNA and diseases. A circRNA-circRNA similarity network was first built by determining how functionally comparable two circRNAs were based on the ontology of genes associated to circRNAs. The features of every pair of circRNA-disease were retrieved based on the results of the random walk and the circRNA-disease correlation matrix. On the circRNA resemblance network, an unscheduled walk with restart was then used. In order to forecast new circRNA-disease connections, a logistic regression model was applied.
In 2021, Xiao, et. al., [57] have performed a generalized elastic net-based SLR early diagnostic model for Alzheimer’s disease. The study presents a generalized elastic net-based SLR model for the early detection of AD. Lp and L2 regularizations were the components of the generalized elastic net. Sparse solutions were possible using the Lp regularization. The connected brain areas were in solution thanks to L2 regularization. For the assessment of our technique, 197 participants from the baseline MRI data of the ADNI database served as the participants.
Unsupervised learning
One of the key subcategories of ML is unsupervised learning, which varies from supervised learning. Unsupervised learning is the process by which an algorithm learns from unlabeled data, finding structures or patterns without being provided any specific knowledge about what those structures or patterns could be. Instead than trying to predict the future or categorize data, unsupervised learning seeks to uncover its underlying structure and relationships.
k-means Clustering
An effective unsupervised ML approach for clustering related data points according to their similarity or distance is called K-means clustering. It is frequently used in many different industries, including anomaly detection, consumer segmentation, and picture segmentation.
In 2021, Khan, et. al., [58] have utilized KMC, deep learning, and artificial data augmentation for classification, segment brain tumours. The VGG19 CNN model using MRI data has been used to provide a thorough segmentation and classification method for brain tumours in that study. The augmentation notion was used to increase the classifier synthetic data’s accuracy. Each input MR modality was first converted to slices using the suggested procedure, and then intensities were preprocessed using a statistical normalization method. To segregate brain tumours and focus ROI for exact feature extraction, KMC was used. Finally, a flawless VGG-19 CNN model was trained utilizing synthetic data augmentation approaches to categorize brain tumours into their two main groups (benign/malignant).
In 2023, Kavitha and Kaulgud [59] have performed heart disease detection utilizing quantum KMC and a quantum circuit methodology. In specifically, the quantum paradigm is used in that study to speed up the KMC methodology and unsupervised ML algorithms. The main approach was building a quantum circuit that manages the distance computation required for the clustering process. The proposed strategy combines quantum computing with data mining techniques. First, the retrieved heart disease dataset was preprocessed, and the effectiveness of traditional KMC was assessed. Later, the conventional clustering technique was approached using the quantum idea.
In 2020, Nithya, et. al., [60] have utilized an ANN and multi-kernel KMC for ultrasound pictures, kidney disease may be detected and segmented. Basically, speckle noise was what has the biggest impact on the ultrasound picture. In that paper median filter, noise reduction was achieved. Each image’s GLCM characteristics were retrieved once the noise has been removed. Using the crow search optimization algorithm (CSOA), that choose the critical characteristics from extracted data to improve classification accuracy while reducing the complexity of the classification process. The specified qualities were then sent to the ANN to classify the submitted image as normal or abnormal. Anomaly photographs are selected for segmentation using the multi-kernel k-means approach after classification; the efficacy was assessed in the result section.
In 2021, Ripan, et. al., [61] have introduced a data-driven approach for coronary artery disease prediction utilizing k-means clustering-based detection of anomalies. The related risk factors for heart disease were taken into account while developing the data-driven prediction model in that article, which can be very important in the healthcare industry. The anomaly recognition model effectively finds anomalies for various cluster values and achieves higher accuracy for various cluster values, highlighting the importance of our ideal K-means-based intrusion detection model for creating the prediction model. The paper fails to concentrate on acquiring recent datasets from a medical facility in the future to do further research and analysis to benefit the medical industry.
In 2021, Islam, et. al., [62] have utilized super pixels, PCA, and the KMC method with a template-based approach, brain tumours may be detected in MR images. The study offered a faster and more effective method for detecting human brain tumours. It was based on the template-based K-means (TK) algorithm with super pixels and PCA, and it effectively detects these tumours in less time. First, in order to reliably diagnose brain tumours, extract the key characteristics using both PCA and super pixels. Then, a filter that enhances accuracy was used to do picture augmentation. The KMC technique was used to do picture segmentation and detect brain tumours.
Hierarchical clustering
Unsupervised ML methods such as hierarchical clustering is used to organize data into clusters with a hierarchy. Using this method, a tree-like structure known as a dendrogram is created to show the connections between data points and the creation of clusters at various levels. Data analysis, biology, and image segmentation frequently use hierarchical clustering to examine the natural groups within data.
In 2021, Pfeifer and Schimek [63] have recommended a method for discovering illness subtypes using hierarchical clustering and data fusion. They introduce HC-fused, a simple approach for combining data from hierarchical clustering with fusion, for the identification of illness subgroups. The suggested method naturally reports on each single-omic’s unique contribution to the data fusion process, in contrast to prior approaches. In order to demonstrate how several state-of-the-art approaches for data integration behave fundamentally differently, then run multi-view simulations with discontinuous and disjunct cluster pieces across the views. On real-world cancer data from the Cancer Genome Atlas (TCGA) database, HCfused outperforms certain recently released techniques by combining their best qualities.
In 2020, Chen and Maharatna [64] have introduced an automated method for finding R and T peaks that combines discrete wavelet transforms with hierarchical clustering. That research presented a unique method for the identification of the R-peak and the T-peak using hierarchical clustering and Discrete Wavelet Transform (DWT) from the ECG data. Identifying a template of the single ECG beat was the initial step. Furthermore, hierarchical clustering was used to identify all R-peaks. Then, depending on the template morphology, each matching T-wave boundary was established. The T wave peaks might be identified by utilizing the Modulus-Maxima Analysis (MMA) of the DWT coefficients, which isn’t the last but certainly not least.
In 2020, Lee, et. al., [65] have introduced a deep learning-based similarity-based hierarchical clustering technique for estimating the pathogenic stage of papillary renal cell carcinoma. In that study, a method to identify the pathological phase of pRCC was established for the goal of early identification and efficient prevention of pRCC. Using a deep learning prediction algorithm and similarity-based hierarchical clustering, the TCGA transcriptome dataset was created. A deep learning prediction model module to distinguish between early and later stage pRCC, and a correlation calculation unit to classify pathological sub-stage data, were also constructed as part of an automated pathological cancer stage prediction R function.
Fuzzy-C-Means clustering
The conventional K-Means clustering algorithm is extended by the soft clustering method known as FCM. When using FCM, data points can belong to numerous clusters with various degrees of membership, unlike K-Means, which allocates each data point to exactly one cluster. This qualifies FCM for situations where data points could display uncertainty and simultaneously belong to many clusters.
In 2020, Chui, et. al., [66] have utilized FCM clustering and combined generative adversarial network for identification of many vocal disorders in an imbalanced dataset. An enhanced FCM clustering (IFCM) method and conditional generative adversarial network (CGAN) were combined to create the CGAN-IFCM technique, it was proposed in that study for the detection of three common voice problems across many classes. The Voice ICar fEDerico II Database (VOICED), the Saarbruecken Voice Database (SVD), two benchmark datasets for voice disorders, employ unbalanced classes. In order to lessen bias in the detection model, generative adversarial networks provide generated data. The fuzzy membership function in improved FCM clustering takes into account the connection between nearby data points.
In 2020, Sheela and Suganthi [67] have modified FCM method, Magnetic Resonance (MR) images were processed for morphological edge recognition and brain tumour classification. That study proposes a method that integrates the three morphological operations (dilation and erosion), region growing, and region of interest (ROI). The discussed technique first determines the roughly growing region (RG). Pixels were grouped into bigger areas via a process called “region growing” that begins at the seed locations. In noisy pictures where edges were hard to identify, region growth based approaches perform better than edge based techniques. The input picture undergoes morphological edge detection, and the image was then enhanced by reconstructing it via erosion and dilation.
In 2020, Anter and Ali [68] have created a hybrid feature selection CFCSA approach that combines the FCM algorithm, chaos theory, and the crow search optimization algorithm. The proposed CFCSA methods address the CSA algorithm’s lack of convergence, which shifted the random variables’ chaotic behaviour from a Gaussian distribution, and make use of the global optimization methodology to avoid the trapping of local minima and the chaos theory to remedy this issue. The suggested CFCSA method made use of several forms of distinctive chaotic maps to improve performance, speed up convergence, and balance the rates of exploration and exploitation.
In 2022, Kim, et. al., [69] have used the double-layered outlier rejection FCM clustering, robustly automatic segmentation of an inflamed appendix from ultrasound images. In order to address the aforementioned issues, provide a reliable automated segmentation approach for the detection of inflamed appendices in that work. Use a double-layered learning architecture and the FCM clustering approach to extract the desired area of the inflamed appendix. In terms of correct extraction rate, the recommended method outperforms double-layered learning with FCM, conventional FCM, and standard outlier FCM, effectively extracting the target appendix in 98 out of 100 test photographs.
In 2020, Alruwaili, et. al., [70] a strong grouping method for brain MR images utilizing spatial fuzzy C-means. The study proposes a weighted spatial FCM (wsFCM) segmentation algorithm that takes the spatial information of the picture into account. Additionally, a spatial function that incorporates a membership function was devised. A neighbourhood window was created around a pixel in order to evaluate the function, and pixels having a stronger link to the core pixel in the neighbourhood have been given additional weights. By include that spatial function in the membership function, the updated membership function improves the original membership function’s capacity to handle noise and intensity inhomogeneity, allowing it to keep and preserve structural information like edges.
Evaluation Metrics for ML
The performance metrics cited in the supporting literature are described in this section. The metrics like accuracy, precision, recall, sensitivity, specificity, F-Measure, NPV, MCC, FPR and FNR are considered for supervised classification. Then the error metrics like MAE, MAPE, MSE, , and RMSE are used for supervised regression techniques. The performance metrics and their calculation formulas for classification techniques are given in this section.
Performance metrics for supervised classification
Sensitivity
Sensitivity is the proportion of actual positive cases correctly identified by the model.
(1)
Specificity
Specificity is determined by dividing the number of accurately anticipated negative outcomes by the total number of negatives.
(2)
Accuracy
Accuracy is defined as the ratio of properly recognized data to all of the record’s data. The accuracy is defined as,
(3)
Precision
The total number of authentic samples that are properly taken into account throughout the classification process is represented by precision by using all of the samples utilised in the classification procedure.
(4)
Recall
Recall rate is a measure of how many genuine samples overall are considered when categorizing data using all samples from the same categories from the training data.
(5)
F- Measure
The F-measure is the harmonic mean of precision and recall.
(6)
Negative Prediction Value (NPV)
The NPV is defined as the ratio of TN and the sum of TN and FN.
(7)
Matthews correlation coefficient (MCC)
The two-by-two binary variable association measure, sometimes referred to as MCC, is shown in the equation below,
(8)
False Positive Ratio (FPR)
By dividing the total number of negative events by the total number of negative events that were wrongly categorized as positive, the FPR is calculated.
(9)
False Negative Ratio (FNR)
The probability that a real positive might go undetected by the test, sometimes referred to as the miss rate.
(10)
Performance metrics for supervised regression
A regression model’s ability to predict numerical or continuous outcomes is assessed using performance measures for supervised regression models. The choice of metrics depends on the specific problem and the characteristics of the data. Here are some commonly used performance metrics for supervised regression:
MAE
The MAE is described as the average of the absolute difference between the values that were anticipated and the actual values. The letter designates all of the values in the test set.
(11)
The MAE illustrates the normal degree of forecast inaccuracy that might anticipate.
MAPE
The MAPE formula (each period independently) is used to divide the demand by the total number of different absolute mistakes. The typical percentage of error is shown as,
(12)
MSE
The average squared difference between the actual values and the projected values is measured by the Mean Square Error (MSE), an extensively used metric in statistics and ML. It is a measure of the quality of an estimator or a model’s performance. MSE is particularly popular in regression analysis and other predictive modeling tasks. The formula for calculating MSE is:
(13)
R-squared
In time series forecasting, the stationary component of the model’s performance is measured using a statistic called the stationary R-squared to compare it to a simple mean model. It’s characterized as,
(14)
Where stands for sum of squared deviations from expectations and denotes the total squared deviations from the dependent variable’s sample mean.
RMSE
The efficiency of the methods utilized at various illness severity levels is assessed in this study using RMSE to assess the impact of various disease symptoms. It was written as,
(15)
Here are samples that were anticipated and those that were observed accordingly.
Performance metrics for unsupervised clustering
Performance metrics for unsupervised clustering serve as quantitative tools to assess the quality and effectiveness of clustering algorithms in various data-driven applications. Clustering is a fundamental unsupervised learning technique that involves grouping data points into clusters or segments based on their inherent similarities, and these metrics help to evaluate the outcomes of this process. The type of data used and the clustering task’s goals are going to decide which measure is selected.
To evaluate the model’s quality, certain metrics can be employed. The Euclidean distance may be calculated using SSE (sum of squared errors). Better cluster performance is indicated by a lower SSE value. The variance ratio criterion, commonly known as the Calinski-Harabaz index, is a measure of dispersion both inside and across clusters. The silhouette coefficient ranges from −1 to 1. The Rand index and Fowkes-Mallows scores (FMI) are used to validate external criteria.
Journal-wise and year-wise graph
The Elsevier and springer journals are chosen for most of the discussion. The selection of papers from standard journals, particularly those published by reputable publishers like Elsevier and Springer, adds a strong foundation of credibility and reliability to the survey. These publishers are well-known for their rigorous peer-survey processes and the high quality of the research they publish. The papers discussed in the survey are shown in figure 2.
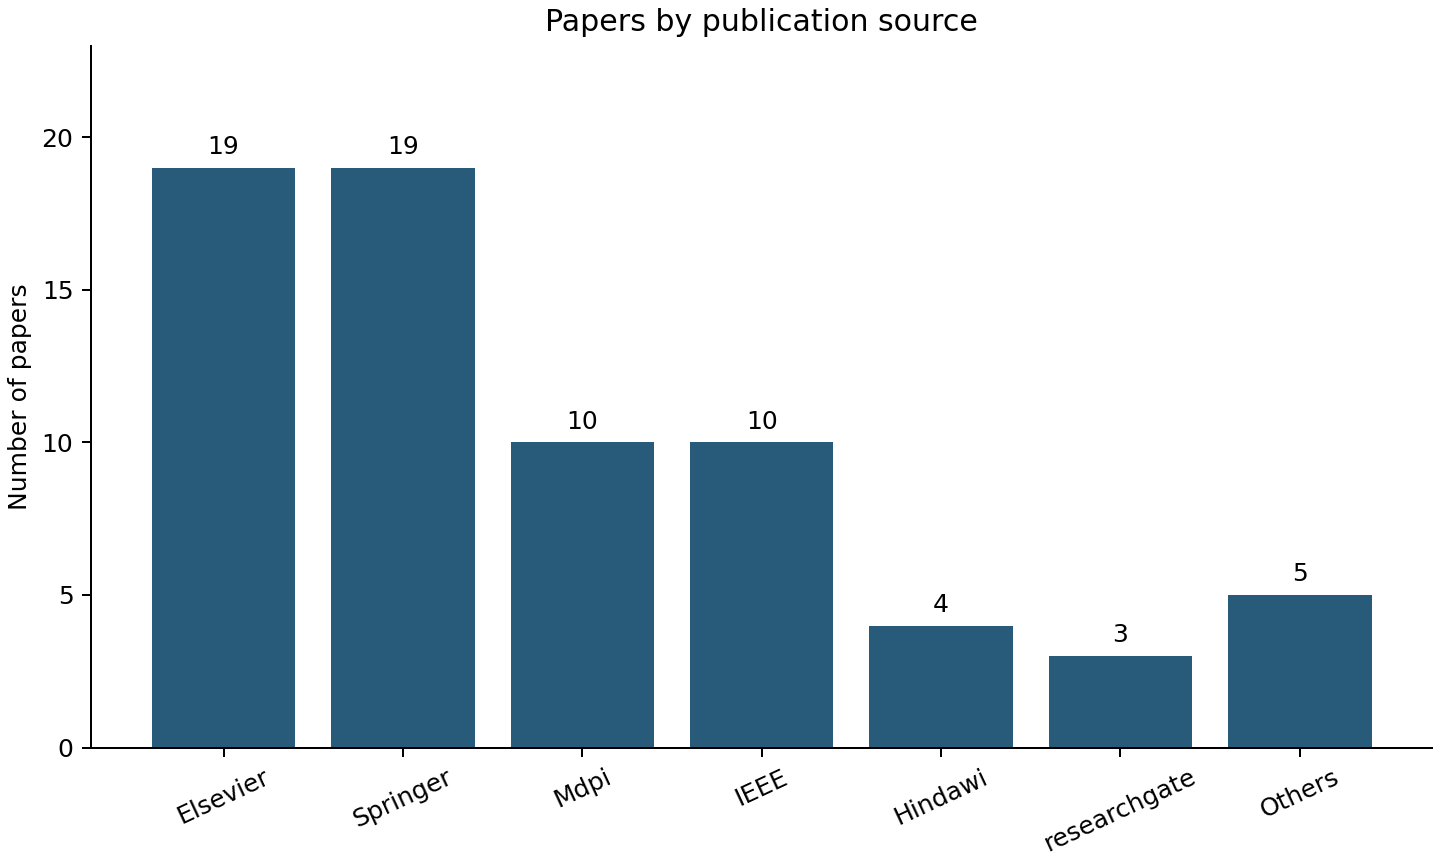
Figure 2: Journal-wise graph
The use of journals from the period between 2018 and 2023 in the survey provides a clear indication that the discussion is heavily reliant on recent and up-to-date research. This approach is particularly important in the context of rapidly evolving fields like healthcare and ML. Figure 3 depicts the year-wise graph in a similar manner.
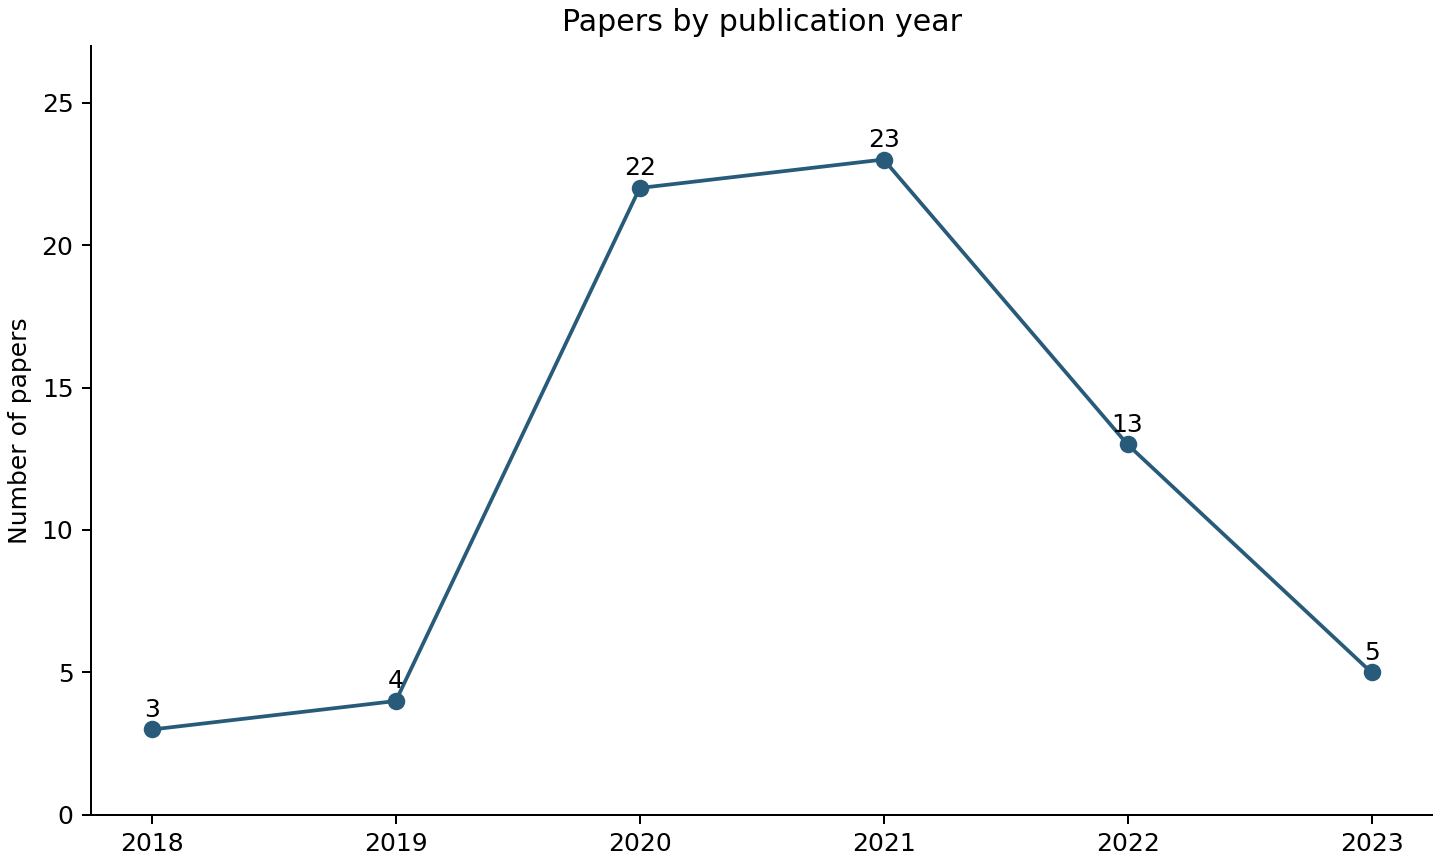
Figure 3: Year-wise graph
Conclusion
In conclusion, the adoption of ML in healthcare systems has brought about a fundamental change in the sector. This extensive survey research, which covers the years 2018 through 2023, reveals the enormous potential of ML to handle the rising need for cost-effective healthcare solutions as well as the complexity of medical data and patient care. The analysis of 70 research publications for the study illustrates how ML algorithms are changing healthcare in a variety of ways, from real-time patient monitoring and resource management to early illness identification and treatment optimization. Medical procedure accuracy and efficacy are being increased by ML-based healthcare systems by utilizing the potential of artificial intelligence. Deep learning, ensemble methods, and predictive modelling are just a few of the many algorithms that are used to do this. One of the main advantages of ML in the healthcare industry is its capacity to offer customized and flexible solutions that change in reaction to shifting patient data. More efficient and patient-centered care results from this customization. The paper also explores vital subjects including feature selection, data preparation, and model evaluation, offering suggestions and pointers for improving the accuracy and effectiveness of ML algorithms in healthcare applications.
The aim of ML in healthcare is to revolutionise patient care, treatment planning, and diagnostics, thereby raising the standard of care provided to patients. ML has potential to enhance patient outcomes and streamline healthcare operations as healthcare continues to develop and create enormous amounts of data. This survey research contains insightful information that will help healthcare practitioners, academics, and policymakers navigate the fast evolving ML world. One may predict even more major advancements in the sector as ML develops and becomes more fully integrated into the healthcare ecosystem, eventually helping patients and healthcare practitioners. The era of data-driven, ML-powered healthcare is here, promising a better and more effective future for the healthcare sector. Security and privacy of sensitive patient data are crucial since ML applications in healthcare manage this data. Future research should focus on the creation of sophisticated encryption methods, safe data access mechanisms, and adherence to changing data protection laws.
References
Yuvaraj, N. and SriPreethaa, K.R., 2019. Diabetes prediction in healthcare systems using machine learning algorithms on Hadoop cluster. Cluster Computing, 22(Suppl 1), pp.1-9.
Suresh, A., Udendhran, R. and Balamurgan, M., 2020. Hybridized neural network and decision tree based classifier for prognostic decision making in breast cancers. Soft Computing, 24(11), pp.7947-7953.
Verde, L., De Pietro, G. and Sannino, G., 2018. Voice disorder identification by using machine learning techniques. IEEE access, 6, pp.16246-16255.
Muhammad, L.J., Algehyne, E.A., Usman, S.S., Ahmad, A., Chakraborty, C. and Mohammed, I.A., 2021. Supervised machine learning models for prediction of COVID-19 infection using epidemiology dataset. SN computer science, 2, pp.1-13.
Ali, F., El-Sappagh, S., Islam, S.R., Ali, A., Attique, M., Imran, M. and Kwak, K.S., 2021. An intelligent healthcare monitoring framework using wearable sensors and social networking data. Future Generation Computer Systems, 114, pp.23-43.
Li, J.P., Haq, A.U., Din, S.U., Khan, J., Khan, A. and Saboor, A., 2020. Heart disease identification method using machine learning classification in e-healthcare. IEEE access, 8, pp.107562-107582.
Qureshi, K.N., Din, S., Jeon, G. and Piccialli, F., 2020. An accurate and dynamic predictive model for a smart M-Health system using machine learning. Information Sciences, 538, pp.486-502.
An, A. and Kang, J.J., 2022. Enhancement of Healthcare Data Transmission using the Levenberg-Marquardt Algorithm. arXiv preprint arXiv:2206.04240.
Phasinam, K., Mondal, T., Novaliendry, D., Yang, C.H., Dutta, C. and Shabaz, M., 2022. Analyzing the performance of machine learning techniques in disease prediction. Journal of Food Quality, 2022.
Saheed, Y.K. and Arowolo, M.O., 2021. Efficient cyber attack detection on the internet of medical things-smart environment based on deep recurrent neural network and machine learning algorithms. IEEE Access, 9, pp.161546-161554.
Sun, H., Xiong, L., Huang, Y., Chen, X., Yu, Y., Ye, S., Dong, H., Jia, Y. and Zhang, W., 2022. AI-aided on-chip nucleic acid assay for smart diagnosis of infectious disease. Fundamental Research, 2(3), pp.476-486.
Saladi, S., Karuna, Y., Koppu, S., Reddy, G.R., Mohan, S., Mallik, S. and Qin, H., 2023. Segmentation and analysis emphasizing neonatal MRI brain images using machine learning techniques. Mathematics, 11(2), p.285.
Masadeh, M., Masadeh, A., Alshorman, O., Khasawneh, F.H. and Masadeh, M.A., 2022. An efficient machine learning-based COVID-19 identification utilizing chest X-ray images. IAES International Journal of Artificial Intelligence, 11(1), p.356.
Kumar, Y., Koul, A., Sisodia, P.S., Shafi, J., Kavita, V., Gheisari, M. and Davoodi, M.B., 2021. Heart failure detection using quantum-enhanced machine learning and traditional machine learning techniques for internet of artificially intelligent medical things. Wireless Communications and Mobile Computing, 2021, pp.1-16.
Park, D.J., Park, M.W., Lee, H., Kim, Y.J., Kim, Y. and Park, Y.H., 2021. Development of machine learning model for diagnostic disease prediction based on laboratory tests. Scientific reports, 11(1), p.7567.
Chen, T., Shang, C., Su, P., Keravnou-Papailiou, E., Zhao, Y., Antoniou, G. and Shen, Q., 2021. A decision tree-initialised neuro-fuzzy approach for clinical decision support. Artificial Intelligence in Medicine, 111, p.101986.
Manikandan, R., Patan, R., Gandomi, A.H., Sivanesan, P. and Kalyanaraman, H., 2020. Hash polynomial two factor decision tree using IoT for smart health care scheduling. Expert Systems with Applications, 141, p.112924.
Chern, C.C., Chen, Y.J. and Hsiao, B., 2019. Decision tree–based classifier in providing telehealth service. BMC medical informatics and decision making, 19, pp.1-15.
Alex, S., Dhanaraj, K.J. and Deepthi, P.P., 2022. Private and energy-efficient decision tree-based disease detection for resource-constrained medical users in mobile healthcare network. IEEE Access, 10, pp.17098-17112.
Azad, C., Bhushan, B., Sharma, R., Shankar, A., Singh, K.K. and Khamparia, A., 2021. Prediction model using SMOTE, genetic algorithm and decision tree (PMSGD) for classification of diabetes mellitus. Multimedia Systems, pp.1-19.
Singh, V., Poonia, R.C., Kumar, S., Dass, P., Agarwal, P., Bhatnagar, V. and Raja, L., 2020. Prediction of COVID-19 corona virus pandemic based on time series data using Support Vector Machine. Journal of Discrete Mathematical Sciences and Cryptography, 23(8), pp.1583-1597.
Battineni, G., Chintalapudi, N. and Amenta, F., 2019. Machine learning in medicine: Performance calculation of dementia prediction by support vector machines (SVM). Informatics in Medicine Unlocked, 16, p.100200.
Haq, A.U., Li, J.P., Memon, M.H., Malik, A., Ahmad, T., Ali, A., Nazir, S., Ahad, I. and Shahid, M., 2019. Feature selection based on L1-norm support vector machine and effective recognition system for Parkinson’s disease using voice recordings. IEEE access, 7, pp.37718-37734.
Yang, W., Si, Y., Wang, D. and Guo, B., 2018. Automatic recognition of arrhythmia based on principal component analysis network and linear support vector machine. Computers in biology and medicine, 101, pp.22-32.
Ismail, A., Abdlerazek, S. and El-Henawy, I.M., 2020. Development of smart healthcare system based on speech recognition using support vector machine and dynamic time warping. Sustainability, 12(6), p.2403.
Venkatesan, C., Karthigaikumar, P., Paul, A., Satheeskumaran, S. and Kumar, R., 2018. ECG signal preprocessing and SVM classifier-based abnormality detection in remote healthcare applications. IEEE Access, 6, pp.9767-9773.
Jader, R. and Aminifar, S., 2022. Fast and Accurate Artificial Neural Network Model for Diabetes Recogni-tion. NeuroQuantology, 20(10), pp.2187-2196.
Thanga Selvi, R. and Muthulakshmi, I., 2021. RETRACTED ARTICLE: An optimal artificial neural network based big data application for heart disease diagnosis and classification model. Journal of Ambient Intelligence and Humanized Computing, 12(6), pp.6129-6139.
Kim, S.K. and Huh, J.H., 2020. Artificial neural network blockchain techniques for healthcare system: Focusing on the personal health records. Electronics, 9(5), p.763.
EP, P., Karthik, S., MV, K., Reddy S, B., MA, M. and Sahile, K., 2022. Implementation of Artificial Neural Network to Predict Diabetes with High-Quality Health System. Computational intelligence and neuroscience, 2022.
Mousavi, H., Darestani, S.A. and Azimi, P., 2021. An artificial neural network based mathematical model for a stochastic health care facility location problem. Health Care Management Science, pp.1-16.
Alshanbari, H.M., Iftikhar, H., Khan, F., Rind, M., Ahmad, Z. and El-Bagoury, A.A.A.H., 2023. On the Implementation of the Artificial Neural Network Approach for Forecasting Different Healthcare Events. Diagnostics, 13(7), p.1310.
Kuvvetli, Y., Deveci, M., Paksoy, T. and Garg, H., 2021. A predictive analytics model for COVID-19 pandemic using artificial neural networks. Decision Analytics Journal, 1, p.100007.
Abirami, L. and Karthikeyan, J., 2023. Digital twin based Healthcare System (DTHS) for Earlier Parkinson Disease Identification and Diagnosis using Optimized Fuzzy based k-Nearest Neighbor Classifier Model. IEEE Access.
Wazery, Y.M., Saber, E., Houssein, E.H., Ali, A.A. and Amer, E., 2021. An efficient slime mould algorithm combined with k-nearest neighbor for medical classification tasks. IEEE Access, 9, pp.113666-113682.
Haque, R.U., Hasan, A.T., Jiang, Q. and Qu, Q., 2020. Privacy-preserving K-nearest neighbors training over blockchain-based encrypted health data. Electronics, 9(12), p.2096.
Alotaibi, A.S., 2022. Hybrid model based on ReliefF algorithm and K-nearest neighbor for erythemato-squamous diseases forecasting. Arabian Journal for Science and Engineering, 47(2), pp.1299-1307.
Ye, H., Wu, P., Zhu, T., Xiao, Z., Zhang, X., Zheng, L., Zheng, R., Sun, Y., Zhou, W., Fu, Q. and Ye, X., 2021. Diagnosing coronavirus disease 2019 (COVID-19): Efficient Harris Hawks-inspired fuzzy K-nearest neighbor prediction methods. Ieee Access, 9, pp.17787-17802.
Kumar, P. and Thakur, R.S., 2021. Liver disorder detection using variable-neighbor weighted fuzzy K nearest neighbor approach. Multimedia Tools and Applications, 80, pp.16515-16535.
Kumar, D.M., Satyanarayana, D. and Prasad, M.G., 2021. MRI brain tumor detection using optimal possibilistic fuzzy C-means clustering algorithm and adaptive k-nearest neighbor classifier. Journal of Ambient Intelligence and Humanized Computing, 12(2), pp.2867-2880.
Garcia-Carretero, R., Vigil-Medina, L., Mora-Jimenez, I., Soguero-Ruiz, C., Barquero-Perez, O. and Ramos-Lopez, J., 2020. Use of a K-nearest neighbors model to predict the development of type 2 diabetes within 2 years in an obese, hypertensive population. Medical & biological engineering & computing, 58, pp.991-1002.
Saeedi, M., Saeedi, A. and Maghsoudi, A., 2020. Major depressive disorder assessment via enhanced k-nearest neighbor method and EEG signals. Physical and Engineering Sciences in Medicine, 43, pp.1007-1018.
Alwateer, M., Almars, A.M., Areed, K.N., Elhosseini, M.A., Haikal, A.Y. and Badawy, M., 2021. Ambient healthcare approach with hybrid whale optimization algorithm and Naïve Bayes classifier. Sensors, 21(13), p.4579.
Jackins, V., Vimal, S., Kaliappan, M. and Lee, M.Y., 2021. AI-based smart prediction of clinical disease using random forest classifier and Naive Bayes. The Journal of Supercomputing, 77, pp.5198-5219.
Deepa, N., Priya, J.S. and Devi, T., 2022. Towards applying internet of things and machine learning for the risk prediction of COVID-19 in pandemic situation using Naive Bayes classifier for improving accuracy. Materials Today: Proceedings, 62, pp.4795-4799.
Mansour, N.A., Saleh, A.I., Badawy, M. and Ali, H.A., 2022. Accurate detection of Covid-19 patients based on Feature Correlated Naïve Bayes (FCNB) classification strategy. Journal of ambient intelligence and humanized computing, pp.1-33.
Shaban, W.M., Rabie, A.H., Saleh, A.I. and Abo-Elsoud, M.A., 2021. Accurate detection of COVID-19 patients based on distance biased Naïve Bayes (DBNB) classification strategy. Pattern Recognition, 119, p.108110.
Huang, Z.Y., Lin, S., Long, L.L., Cao, J.Y., Luo, F., Qin, W.C., Sun, D.M. and Gregersen, H., 2020. Predicting the morbidity of chronic obstructive pulmonary disease based on multiple locally weighted linear regression model with K-means clustering. International Journal of Medical Informatics, 139, p.104141.
Mallik, S., Seth, S., Bhadra, T. and Zhao, Z., 2020. A linear regression and deep learning approach for detecting reliable genetic alterations in cancer using dna methylation and gene expression data. Genes, 11(8), p.931.
Lin, J.D., Pei, D., Chen, F.Y., Wu, C.Z., Lu, C.H., Huang, L.Y., Kuo, C.H., Kuo, S.W. and Chen, Y.L., 2022. Comparison between Machine Learning and Multiple Linear Regression to Identify Abnormal Thallium Myocardial Perfusion Scan in Chinese Type 2 Diabetes. Diagnostics, 12(7), p.1619.
Rath, S., Tripathy, A. and Tripathy, A.R., 2020. Prediction of new active cases of coronavirus disease (COVID-19) pandemic using multiple linear regression model. Diabetes & metabolic syndrome: clinical research & reviews, 14(5), pp.1467-1474.
Lashgari, S., Mohammadzadeh, M. and Ghaderi, F., 2023. Adaptive elastic‐net sliced inverse regression to identify risk factors affecting COVID‐19 disease fatality rate. IET Signal Processing, 17(4), p.e12200.
Xiao, R., Cui, X., Qiao, H., Zheng, X. and Zhang, Y., 2021. Early diagnosis model of Alzheimer’s disease based on sparse logistic regression. Multimedia tools and applications, 80, pp.3969-3980.
Abdullah, M.N., Wah, Y.B., Majeed, A.B.A., Zakaria, Y. and Shaadan, N., 2022. Identification of Blood-Based Multi-Omics Biomarkers for Alzheimer’s Disease Using Firth’s Logistic Regression. Pertanika Journal of Science & Technology, 30(2).
Zhang, J.J., Hong, J., Ma, Y.S., Shi, Y., Zhang, D.D., Yang, X.L., Jia, C.Y., Yin, Y.Z., Jiang, G.X., Fu, D. and Yu, F., 2021. Identified GNGT1 and NMU as combined diagnosis biomarker of non-small-cell lung cancer utilizing bioinformatics and logistic regression. Disease Markers, 2021.
Ding, Y., Chen, B., Lei, X., Liao, B. and Wu, F.X., 2020. Predicting novel CircRNA-disease associations based on random walk and logistic regression model. Computational Biology and Chemistry, 87, p.107287.
Xiao, R., Cui, X., Qiao, H., Zheng, X., Zhang, Y., Zhang, C. and Liu, X., 2021. Early diagnosis model of Alzheimer’s disease based on sparse logistic regression with the generalized elastic net. Biomedical Signal Processing and Control, 66, p.102362.
Khan, A.R., Khan, S., Harouni, M., Abbasi, R., Iqbal, S. and Mehmood, Z., 2021. Brain tumor segmentation using K‐means clustering and deep learning with synthetic data augmentation for classification. Microscopy Research and Technique, 84(7), pp.1389-1399.
Kavitha, S.S. and Kaulgud, N., 2023. Quantum K-means clustering method for detecting heart disease using quantum circuit approach. Soft Computing, 27(18), pp.13255-13268.
Nithya, A., Appathurai, A., Venkatadri, N., Ramji, D.R. and Palagan, C.A., 2020. Kidney disease detection and segmentation using artificial neural network and multi-kernel k-means clustering for ultrasound images. Measurement, 149, p.106952.
Ripan, R.C., Sarker, I.H., Hossain, S.M.M., Anwar, M.M., Nowrozy, R., Hoque, M.M. and Furhad, M.H., 2021. A data-driven heart disease prediction model through K-means clustering-based anomaly detection. SN Computer Science, 2, pp.1-12.
Islam, M.K., Ali, M.S., Miah, M.S., Rahman, M.M., Alam, M.S. and Hossain, M.A., 2021. Brain tumor detection in MR image using superpixels, principal component analysis and template based K-means clustering algorithm. Machine Learning with Applications, 5, p.100044.
Pfeifer, B. and Schimek, M.G., 2021. A hierarchical clustering and data fusion approach for disease subtype discovery. Journal of Biomedical Informatics, 113, p.103636.
Chen, H. and Maharatna, K., 2020. An automatic R and T peak detection method based on the combination of hierarchical clustering and discrete wavelet transform. IEEE Journal of Biomedical and Health Informatics, 24(10), pp.2825-2832.
Lee, S., Jung, J., Park, I., Park, K. and Kim, D.S., 2020. A deep learning and similarity-based hierarchical clustering approach for pathological stage prediction of papillary renal cell carcinoma. Computational and structural biotechnology journal, 18, pp.2639-2646.
Chui, K.T., Lytras, M.D. and Vasant, P., 2020. Combined generative adversarial network and fuzzy C-means clustering for multi-class voice disorder detection with an imbalanced dataset. Applied Sciences, 10(13), p.4571.
Sheela, C.J.J. and Suganthi, G.J.M.T., 2020. Morphological edge detection and brain tumor segmentation in Magnetic Resonance (MR) images based on region growing and performance evaluation of modified Fuzzy C-Means (FCM) algorithm. Multimedia Tools and Applications, 79, pp.17483-17496.
Anter, A.M. and Ali, M., 2020. Feature selection strategy based on hybrid crow search optimization algorithm integrated with chaos theory and fuzzy c-means algorithm for medical diagnosis problems. Soft Computing, 24(3), pp.1565-1584.
Kim, K.B., Song, D.H. and Park, H.J., 2022. Robust Automatic Segmentation of Inflamed Appendix from Ultrasonography with Double-Layered Outlier Rejection Fuzzy C-Means Clustering. Applied Sciences, 12(11), p.5753.
Alruwaili, M., Siddiqi, M.H. and Javed, M.A., 2020. A robust clustering algorithm using spatial fuzzy C-means for brain MR images. Egyptian Informatics Journal, 21(1), pp.51-66.
Cite This Work
To export a reference to this article please select a referencing stye below:

Academic Master Education Team is a group of academic editors and subject specialists responsible for producing structured, research-backed essays across multiple disciplines. Each article is developed following Academic Master’s Editorial Policy and supported by credible academic references. The team ensures clarity, citation accuracy, and adherence to ethical academic writing standards
Content reviewed under Academic Master Editorial Policy.



