
Introduction
This narrative background review covers Alzheimer’s disease, differential diagnosis, biomarkers, research datasets and deep learning methods for medical images. It does not report a new experiment or a validated diagnostic system. Historical dataset descriptions and study-specific performance estimates are retained with their cited context.
Early diagnosis and classification of Alzheimer
Alzheimer’s disease (AD) is a progressive neurodegenerative disorder and a major cause of dementia. Risk increases with age, although dementia is not an inevitable consequence of ageing. Late-onset and inherited early-onset forms differ in their typical timing and genetic contributions. AD can affect memory, language, judgement, visuospatial ability, behaviour and independent daily functioning. Common cognitive features include amnesia, aphasia, apraxia and agnosia; symptoms and progression vary between individuals. In advanced disease, people may need extensive help with daily activities. Amyloid-beta accumulation, abnormal tau and loss of synapses and neurons are central pathological features. Vascular and Lewy-body pathology can coexist, particularly in older adults. [1,33]
AD contributes substantially to the global dementia burden. WHO estimates that 57 million people lived with dementia in 2021 and that Alzheimer’s disease accounts for approximately 60–70% of dementia cases. These are dementia figures, rather than counts of people with AD alone. Pathological changes can precede clinical symptoms, but an individual’s time course and progression cannot be inferred from a fixed population-wide interval. [1,33]
Dementia
Dementia is a syndrome involving deterioration in cognitive functioning that interferes with daily life. Memory is often affected, but language, reasoning, orientation and behaviour may also change. Assessment considers the person’s previous abilities and functional changes rather than defining dementia through a single IQ threshold. [33]
Dementia is a progressive neurological disorder, is characterized by a decline in cognitive abilities that impairs daily functioning and independence. Common symptoms include memory loss, confusion, difficulty with language and communication, changes in mood and personality, and a decline in problem-solving skills. Dementia can be caused by various conditions, such as Alzheimer’s disease, vascular dementia, Lewy body dementia, or frontotemporal dementia. While there is no cure for dementia, management strategies, including medication, therapy, and support services, aim to alleviate symptoms, enhance quality of life, and provide support to individuals living with dementia and their caregivers.
Clinical descriptions distinguish mild cognitive impairment (MCI) from mild, moderate and severe dementia. MCI is not itself dementia: cognitive difficulties are greater than expected for age while everyday independence is largely preserved. Some people with MCI develop dementia, while others remain stable or improve. [36]
Mild cognitive impairment involves measurable difficulties with memory or other thinking abilities beyond expected ageing, with everyday independence largely preserved. It may arise from several causes and does not invariably progress to Alzheimer’s dementia. [36]
Mild dementia can involve increasing difficulty with recent memory, word finding, planning and complex daily tasks. The person may still retain considerable independence, but the clinical impact extends beyond the largely preserved functioning used to distinguish MCI.
Moderate Dementia: The patient’s regular activities become noticeably more difficult, requiring more care and support. The signs are similar to those of mild to moderate dementia. Even combing one’s hair could need further help. Patients may also have significant personality changes, such as being irrationally paranoid or angry. There is also a chance of sleep problems.
Severe dementia is associated with extensive dependence for personal care and communication. Problems with continence, mobility, swallowing and recognising familiar people can occur as the disease advances. Their timing and severity vary; bladder dysfunction does not explain all physical impairments.
The development of a model that can discriminate between people with dementia and healthy people uses a deep learning approach. The results show that the suggested method can recognise people who could have dementia. [2].
Forms of dementia
Degraded recent memory: Characteristics of classic AD are the primary sign of impaired recent memory. The patient is unable to recall recent events, such as those that occurred a day or a week ago, while older memories, such as those from their infancy, are largely unaffected at the onset of the condition. Damage to the posterior cingulate cortex and medial temporal lobe is the primary cause of recent memory impairment. [3,4].
Behavioural Changes: The main hallmarks of the behavioural form of frontotemporal dementia include behaviour changes along with relatively preserved recent memory. Patients exhibit other socially improper behaviours as well, such as touching strangers and altering eating preferences. [3].
Impairment of language and speech: A rare kind of Alzheimer’s disease (amyloid beta)-related neurodegenerative clinical condition known as logopenic progressive aphasia (LPA) is characterised by a sharp decline in spontaneous speech, phonological mistakes, difficulty finding words, and difficulty repeating sentences. These language abnormalities are a result of the temporoparietal brain areas’ gradual deterioration, which impairs phonological working memory and lexical retrieval abilities. also frequently referred to as a language disorder [3].
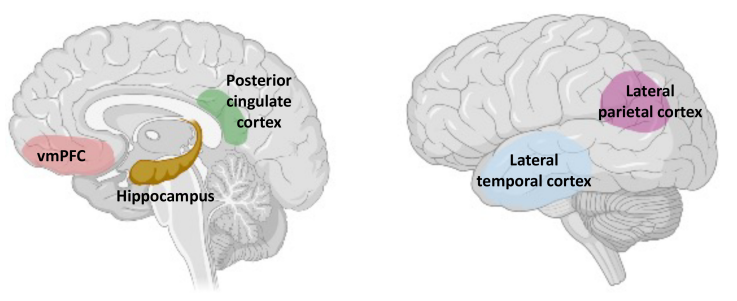
Fig 1.1 Anatomy of the core recollection network.
Impairment of attention: Between 14% and 56% of all hospitalised elderly patients have cognitive impairment due to impaired attention brought on by confusional or delirious situations. Between 29% and 76% of demented individuals in primary care settings are thought to go untreated [4].
Visuospatial impairment: A sort of impairment called visuospatial impairment makes it difficult to understand what you see and react properly. This is not the same thing as having vision issues. Although the eyes may be perfectly capable of seeing, the brain is unable to interpret the information from the sights one is taking in [4].
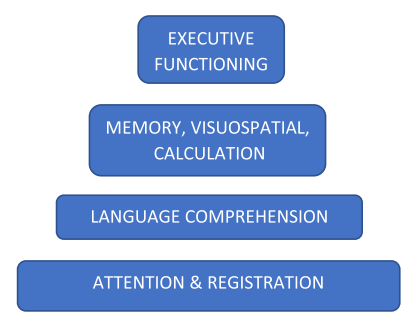
Fig 1.2 Hierarchy of cognitive domains [4].
Dementia can result from several neurodegenerative and vascular diseases, sometimes in combination. Other conditions can cause cognitive symptoms and require differential assessment. These causes should not all be described as infections or as an identical progressive collapse of neurons. [33]
Alzheimer Disease (AD)
The most prevalent form of dementia is Alzheimer’s disease (AD), which is a slowly progressing neurodegenerative condition characterised by neuritic plaques and neurofibrillary tangles. AD was named after the German psychiatrist Alois Alzheimer [7].
Neuritic plaques: Also known as senile plaques, are abnormal deposits of protein fragments called beta-amyloid that accumulate between nerve cells in the brain. These plaques are a hallmark feature of Alzheimer’s disease and are often found in regions associated with memory and cognition. Neuritic plaques can disrupt the normal communication between brain cells, leading to the progressive deterioration of cognitive function. The presence of these plaques is believed to contribute to the development and progression of Alzheimer’s disease. Research efforts focus on understanding the role of neuritic plaques in the disease process and developing interventions to target and reduce their accumulation to potentially slow down the progression of Alzheimer’s disease.
Neurofibrillary tangles: They are twisted and abnormal protein filaments that form inside nerve cells in the brain, primarily composed of a protein called tau. These tangles are a characteristic feature of Alzheimer’s disease and other neurodegenerative disorders. In healthy brain cells, tau helps stabilize structures called microtubules, which are responsible for transporting nutrients and other substances within the cell. However, in neurofibrillary tangles, tau proteins become altered and clump together, disrupting the normal functioning of the cell. This can lead to impaired communication between neurons and ultimately contribute to the cognitive decline seen in diseases like Alzheimer’s. Understanding neurofibrillary tangles is important for developing interventions that target and prevent their formation, potentially slowing down the progression of these devastating neurological conditions.
Alzheimer’s is a prevalent neurological disease characterised by a gradual decline in mental capacity and memory. Alzheimer’s disease (AD), which accounts for 60–80% of dementia cases in older persons, is the most prevalent type of dementia. It is an irreversible deterioration of the brain. The disease mainly affects older people, and beyond the age of 65, the risk drastically increases. In Alzheimer’s disease, the brain develops neurofibrillary tangles and amyloid plaques, which cause synapses to misfire and neurons to die. The quality of life and career prospects of those affected by these pathological alterations are severely negatively impacted by cognitive deficits, behavioural problems, and functional disability brought on by these changes [5].
Early recognition can support care planning, assessment of contributing conditions, symptom management and treatment decisions. It does not prevent an illness from spreading between people. Selected patients with early symptomatic AD may be considered for approved anti-amyloid treatments; these can slow decline in studied populations but do not cure AD. [34]
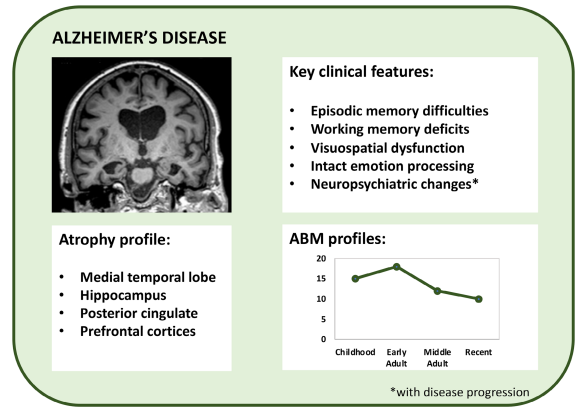
Fig 1.3 Overview of Alzheimer’s disease [3].
Different phases of AD
The advancement of AD can be grouped into three phases.
To begin with, in the asymptomatic period, alterations in the brain, blood, or cerebrospinal fluid (CSF) may begin to occur without the patient experiencing symptoms that are unique to their presentation.
Mild cognitive impairment is a clinical stage with cognitive difficulties beyond expected ageing and largely preserved independence. MCI may precede AD dementia, but progression is not inevitable and its cause requires assessment. [36]
In AD dementia, cognitive impairment increasingly affects daily functioning and may eventually create extensive care needs. Hippocampal atrophy is a relevant research measure, but reported annual rates depend on the cohort, imaging protocol and disease stage. A single fixed atrophy rate should not be used to predict an individual’s course. [4]
General Cause for AD
Alzheimer’s disease has interacting biological, genetic and environmental risk factors. Symptomatic care remains important. In the United States, anti-amyloid medicines including lecanemab and donanemab have received approval for treatment initiated in selected patients with MCI or mild dementia due to AD. Eligibility, confirmation of pathology and safety monitoring matter; these treatments slow decline rather than cure the disease. [34]
The burden of dementia is substantial and increases as populations age. Population estimates for all dementia must be distinguished from estimates for AD. Lifestyle, vascular health and other environmental factors can influence risk, but individual outcomes cannot be predicted from one exposure or risk factor alone. [33]
The MTHFR gene has been investigated in candidate genetic-association studies related to cognitive disease. Such an association is not a diagnostic test and should not be presented as proof that a person has or will develop AD. Established familial AD genes and susceptibility variants require separate interpretation. [37]
Other variables that can contribute to the progressive loss of cognitive abilities include intoxications, infections, abnormalities in the pulmonary and circulatory systems that reduce the amount of oxygen that gets to the brain, nutritional deficiencies, vitamin B12 deficiencies, tumours, and others. [7].
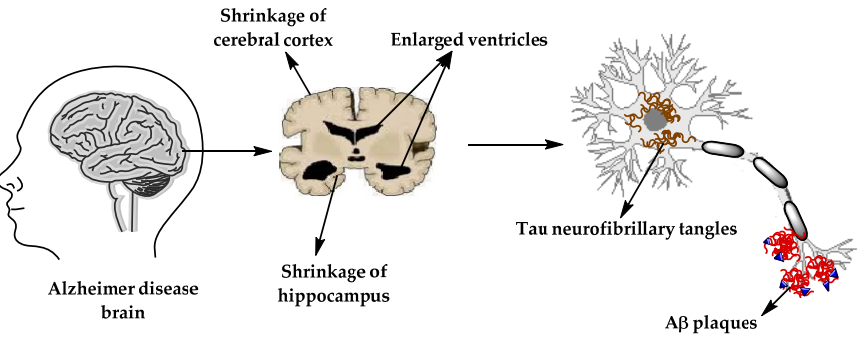
Fig 1.4 The physiological structure of the brain and neurons in Alzheimer’s disease (AD) brain [7]
Strategies to assess genetic risk for AD
Genetic assessment distinguishes susceptibility from rare inherited disease. APOE variants influence risk but do not establish an AD diagnosis. Rare pathogenic variants in APP, PSEN1 and PSEN2 can cause inherited early-onset AD. Genetic testing and its interpretation require appropriate clinical context and counselling. [37]
Multiple genetic and environmental factors contribute to the likelihood of developing AD, with the APOE genotype having the biggest genetic influence. A significant rise in the prevalence of age-related illnesses, none of which are more feared than AD, is projected given the demographics of the population. Epidemiological and genetic linkage studies have shown significant risk factors for AD in the elderly over 65. The most prevalent types of AD that develop with advancing age are linked to genetic risk factors that are dispersed across the genome in the form of common population polymorphisms (CPPs) [9].
Brain Tumour Versus Alzheimer Disease (AD)
A brain tumour is an abnormal growth of cells in or around the brain; tumours may be benign or malignant. Symptoms depend on location and effects on surrounding tissue and can include headaches, seizures, changes in vision or neurological deficits. Severe myopia and poor blood flow should not be presented as established general causes. Evaluation may include neurological examination, MRI or CT, with biopsy or other tests in selected cases. [38]
Medical professionals have employed magnetic resonance imaging (MRI), a type of brain imaging that enables the representation of the anatomy and functionality of the brain, to diagnose disorders affecting the brain. Assessing AD and brain tumour symptoms and indicators is done by medical professionals. Three various kinds of brain tumours are gliomas, meningiomas, and pituitary tumours. [10].
Among the major causes of death in the globe are cancer and Alzheimer’s disease (AD). While neurodegeneration is the primary characteristic of AD, cell proliferation is the primary trait of malignant tumours, placing these two diseases on opposite ends of the cell division continuum. Interestingly, there is a striking similarity between the pathologies of AD and cancer, namely the existence of an active cell cycle in both diseases [11].
Some observational studies discuss an inverse association between cancer and AD. Such findings do not establish that either disease protects against the other, and confounding, survival effects and differences in ascertainment require consideration. The mechanisms and causal interpretation remain uncertain. [11]
Deep Neural Networks (DNN) are becoming increasingly important for extracting accurate and highly relevant information and making accurate predictions of AD and brain tumours from brain-imaging data as a result of technological advancements and the expansion of data gathered by brain-imaging techniques [10].
Brain tumour diagnostic techniques
There are several diagnostic techniques used to detect and diagnose brain tumours. Some common ones include:
Imaging tests: Magnetic Resonance Imaging (MRI) and Computed Tomography (CT) scans provide detailed images of the brain, allowing doctors to identify and locate tumours.
Biopsy: A sample of the tumour tissue is extracted and examined under a microscope to determine the type and grade of the tumour.
Lumbar puncture may be used for selected diagnostic questions involving cerebrospinal fluid. It is not a routine test for every brain tumour, and clinicians must first assess whether an intracranial mass or raised pressure makes it inappropriate. [38]
PET imaging may provide additional information in selected brain-tumour evaluations. Its role depends on the clinical question and tracer; it does not replace structural imaging or tissue diagnosis where those are required. [38]
Angiography can be considered when vascular anatomy or blood supply is relevant to a selected tumour or procedure. It is not required for every suspected brain tumour. [38]
Functional MRI can help map important brain functions during selected treatment-planning assessments. It complements rather than replaces the diagnostic work-up. [38]
EEG records electrical brain activity and can assist seizure assessment. It is not a direct test that independently confirms a brain tumour. [38]
Molecular testing of tumour tissue can contribute to classification and treatment planning after appropriate sampling. The tests used depend on tumour type and the clinical question. [38]
It’s important to note that the choice of diagnostic techniques depends on various factors, including the symptoms, location, and suspected type of brain tumor.
Parkinson’s disease (PD) Versus Alzheimer Disease (AD)
Parkinson’s disease is assessed mainly through the clinical history and neurological examination. Bradykinesia, tremor, rigidity and other motor and non-motor features are considered together; alternative causes and supportive findings matter. It should not be diagnosed merely by counting two symptoms from a short list. [40]
Patients with Parkinson’s disease (PD) may also develop non-motor symptoms such sleep problems, psychotic symptoms, sensory issues, mood swings, and cognitive impairment. There are numerous additional PD-related symptoms, including as an expressionless face, muted voice, constricted handwriting, shuffled steps, trouble rising from a chair, and trouble eating. Numerous symptoms of idiopathic Parkinson’s disease are brought on by malfunctioning and dying dopamine-producing brain cells.
AD and Parkinson’s disease require different diagnostic and treatment approaches despite some overlapping symptoms. Approved anti-amyloid medicines can slow decline in selected early AD populations; they are not cures. Parkinson’s treatment focuses on symptoms and function, and its diagnosis and treatment should not be equated with AD. [34,40]
Alzheimer’s disease (AD) and Parkinson’s disease (PD) are two neurodegenerative illnesses with complex pathogenesis. The development and spread of the disease are influenced by numerous causes and processes. Neurodegenerative disorders involve a number of pathological processes, such as oxidative stress, neuroinflammatory response, disturbed neurotrophic function and neurogenesis, synaptic and neurotransmission dysfunction, ion disbalance, that tightly interact and overlap in addition to the neurotoxicity of protein aggregates. Therefore, a current trend seen as a potential approach to treating AD and PD is multifunctional or multi-target therapy directed at many significant pathogenetic hubs [13].
Diagnostic techniques for PD
The following approaches can support selected Parkinson’s assessments. DaTscan is a form of dopamine-transporter SPECT, so these labels do not represent two independent tests. Such imaging may help clarify a diagnosis but cannot distinguish PD from every other parkinsonian disorder. [40]
Clinical evaluation: A thorough examination by a neurologist or movement disorder specialist to assess various symptoms and signs associated with Parkinson’s disease, including tremors, rigidity, bradykinesia (slowed movement), and postural instability.
Medical history assessment: Gathering information about the patient’s medical history, including family history, previous illnesses, medications, and exposure to toxins, to help determine the likelihood of Parkinson’s disease.
DaTscan: This imaging technique involves injecting a radioactive substance that binds to dopamine transporters in the brain. By analyzing the scan, doctors can evaluate the loss of dopamine-producing cells, which is a key characteristic of Parkinson’s disease.
Blood tests: While there is no specific blood test to diagnose Parkinson’s disease, blood tests can be conducted to rule out other conditions that may present similar symptoms and to assess overall health.
DAT-SPECT: Dopamine Transporter Single-Photon Emission Computed Tomography (DAT-SPECT) is another imaging technique that utilizes a radioactive tracer to examine the dopamine transporter system in the brain, aiding in diagnosing Parkinson’s disease and distinguishing it from other movement disorders.
It’s important to remember that these diagnostic techniques assist in the evaluation of Parkinson’s disease, but a definitive diagnosis often relies on clinical judgment and the presence of specific symptoms. A comprehensive evaluation by a healthcare professional experienced in movement disorders is crucial for accurate diagnosis and appropriate management of Parkinson’s disease.
Diagnosing Alzheimer disease
Early assessment of cognitive symptoms can support care planning, evaluation of other causes and appropriate treatment selection. Neither imaging nor a machine-learning classification guarantees prevention of neuronal damage or predicts an individual’s outcome. [34]
Understanding the causes and processes of progression of neurodegenerative illnesses is the first step in creating a dementia treatment that works. The identification of neurodegenerative illnesses that can lead to dementia has substantially benefited from recent developments in structural brain imaging and molecular imaging techniques, despite challenges in recognising pathological changes in human brains. Numerous innovative diagnostic methods have recently been put forth to assess various clinical phenotypes, neuropathologies, and pathophysiological mechanisms. The 1984 NINCDS-ADRDA diagnostic criteria stated that post-mortem pathology should be used to confirm an AD diagnosis. This recommendation served as the de facto standard for clinical diagnosis. However, the 2007 International Working Group (IWG) and 2011 NIA-AA guidelines tackled AD with a combination of clinical diagnosis and biomarkers due to the development of numerous biomarkers. In the 2018 NIA-AA research criteria, AD was first defined exclusively through biomarkers. The 2021 IWG standards have lately, however, returned to using a combination of clinical diagnosis and biomarkers [15].
These tests, however, cannot fully diagnose or assess the course of neurodegenerative disorders. In order to improve diagnosis, it is crucial to take into account neuroanatomical testing together with clinical neurological examinations, cognitive tests, and CSF beta amyloid, tau, and P-tau assays [15].
Table 1.1 provides a summary of all combinations of (A) amyloidopathy, (T) tauopathy, and (N) neuronal damage in biomarker categorization [15]
Table 1.1 Classification based on combination of clinical diagnosis and biomarkers [15]
Table 1.1 is reproduced from the original manuscript. Its FDG-PET row should read reduced glucose metabolism or hypometabolism, rather than increased metabolism, for the neurodegeneration marker described in the NIA-AA framework. The image preserves the supplied table, with this correction governing its interpretation. [42]
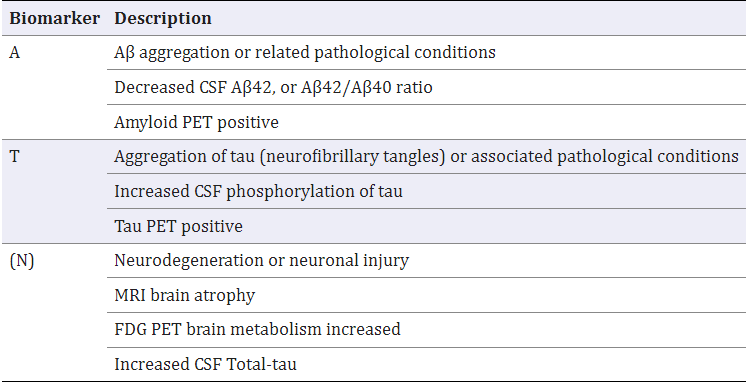
Parentheses are used to separate biomarkers of neurodegeneration from amyloidosis or pathological tau, which are particular signs of Alzheimer’s disease because they can exhibit abnormalities due to causes other than Alzheimer’s disease [15].
Aβ: β-amyloid, PET: positron emission tomography, MRI: magnetic resonance imaging, CSF: cerebrospinal fluid, MRI: magnetic resonance imaging, FDG: fluorodeoxyglucose.
Use of biomarkers for diagnosing AD
The use of imaging and fluid biomarkers to assist the diagnosis of AD still varies greatly between nations, despite their potential to diagnose AD and their ability to be reimbursed.
Structural MRI can show atrophy and other anatomical changes, while PET with an appropriate molecular tracer can assess amyloid or tau-related pathology. These modalities measure different features. CSF biomarkers provide additional information about amyloid-beta and tau biology and must be interpreted with the patient’s clinical findings. [16]
Biomarkers for AD typically fall into three categories: imaging biomarkers, fluid biomarkers, and genetic markers. Imaging biomarkers, such as positron emission tomography (PET) scans and magnetic resonance imaging (MRI), can visualize brain abnormalities associated with AD, including the accumulation of beta-amyloid plaques and neurofibrillary tangles. These imaging techniques can provide valuable information about the presence and extent of these hallmark AD pathologies.
Fluid biomarkers involve the analysis of cerebrospinal fluid (CSF) or blood samples. One commonly studied fluid biomarker for AD is the measurement of beta-amyloid and tau proteins in CSF. Abnormal levels of these proteins can indicate the presence of AD pathology. Other potential fluid biomarkers being investigated include neurofilament light chain (NfL) and inflammatory markers. These biomarkers show promise in differentiating AD from other neurodegenerative disorders and monitoring disease progression.
APOE genotype is a susceptibility marker rather than a stand-alone diagnostic test for AD. Biomarker assessment, clinical history and examination provide information that genetic risk alone cannot establish. [37]
Combining multiple biomarkers, such as imaging, fluid, and genetic markers, can improve the accuracy of diagnosing AD and differentiating it from other forms of dementia. Biomarker-based approaches provide an opportunity for early diagnosis, facilitating intervention and potentially improving outcomes by enabling timely treatment and monitoring disease progression.
While the use of biomarkers for AD diagnosis is promising, further research is needed to validate and standardize these markers, establish their predictive value, and refine diagnostic criteria. Ethical considerations, cost-effectiveness, and accessibility also need to be addressed for widespread implementation. Nonetheless, biomarkers hold significant potential in enhancing the accuracy and early detection of AD, ultimately aiding in the development of effective therapeutic interventions.
Imaging biomarkers
Amyloid PET is one imaging approach discussed in the cited review. Tau PET and structural MRI provide different information, so amyloid imaging should not be described as the sole available diagnostic imaging biomarker. Selection depends on the clinical question and interpretation requires specialist context. [16]
Fluid biomarkers
CSF measures of amyloid-beta and tau can support selected AD evaluations. Testing is considered in context rather than automatically recommended for every person with a memory complaint. Emerging blood-based approaches have expanded the range of available assessments. [16,35]
Non-Invasive Biomarkers
Neurons communicate and perform all functions using electrical impulses, and EEG captures this electrical activity through small electrodes placed on the scalp, displaying electrical impulses as waves. Individuals with AD typically experience a general slowing of EEG, including a reduction in higher frequency waves, such as gamma. The power spectrum, complexity, and synchronization characteristics of EEG waveforms in AD patients have a distinct deviation from normal elderly individuals, indicating these EEG features can be promising candidate biomarkers of AD. Another promising biomarker is the study of microvascular changes in the eye retina by OCT and OCTA techniques. It is based on the fact that the eyes are directly connected to the brain. A recent study of damage to the microvascular network and neural microstructure of the retina has been reported in AD, MCI, and even preclinical AD. Studies of human and animal models of AD have also revealed biochemical pathways that are altered in the retina during diseases, such as Aβ and tau deposition [17].
Thus, since it is a non-invasive technique and different from most other biomarkers used by other clinical-stage biotech companies, EEG techniques with bodily fluid biomarkers may offer a more accurate prediction of AD status [17].
Minimally Invasive Biomarkers
Studies have examined proteins and metabolites in blood, saliva and urine as candidate AD biomarkers. Research associations and reported classification results do not automatically establish clinical validity. Rare pathogenic APP, PSEN1 and PSEN2 variants relate to inherited early-onset AD; APOE influences susceptibility and is not a diagnostic gene panel. Measurement consistency between institutions remains an important limitation. [17,37]
The biomarker landscape has changed since the cited review. In May 2025, the FDA cleared the Lumipulse G pTau217/β-Amyloid 1-42 Plasma Ratio for use in symptomatic adults aged 55 and older. It assists evaluation, is not a stand-alone diagnostic test and is not intended for general screening of people without symptoms. [35]
Emerging diagnostic tools
Blood-based biomarker research includes amyloid-beta and phosphorylated tau measures. The 2025 FDA clearance of a plasma-ratio test illustrates clinical progress, while eligibility, other diagnostic information and test limitations remain central to interpretation. Candidate saliva, urine and other research markers should not be treated as interchangeable validated tests. [17,35]
Benefits of new diagnostic tools
New diagnostic tools may improve assessment and facilitate timely care, research recruitment and treatment selection. Early detection does not itself halt AD. Computational tools require independent validation, representative data and assessment of their performance in the intended clinical setting. [18]
Improved Accuracy and Objectivity: The new diagnostic tools use cutting-edge technology and quantitative techniques, improving the objectivity and accuracy of Alzheimer’s disease diagnosis. Combining machine learning algorithms with biomarkers like beta-amyloid and tau in blood or CSF enhances the accuracy of diagnosis. This lessens the dependence on arbitrary clinical judgements, reducing the variation in diagnosis across various healthcare experts [5].
Blood sampling is minimally invasive rather than non-invasive because venipuncture is required. Accessibility, cost, measurement quality and diagnostic value depend on the specific test and setting; none should be assumed to be universal. [35]
Facilitating Early Intervention and Treatment: With the rising idea of precision medicine, the availability of new diagnostic technologies allows early intervention and treatment techniques. Early detection enables medical professionals to customise therapies to specific patients depending on each patient’s illness stage and features [3]. This personalised strategy improves the efficacy of disease-modifying treatments and raises the chance of successful treatment results [5].
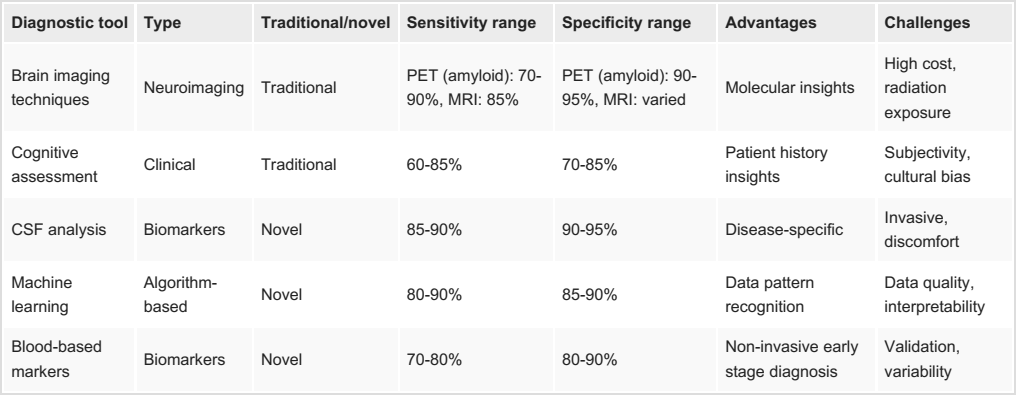
Table 1.2 New Diagnostic Tools – A Comparison [5].
Table 1.2 presents ranges reported in the cited source, rather than universal diagnostic accuracy. Blood collection is minimally invasive despite the original table’s “non-invasive” wording. Test performance depends on the assay, clinical population and reference standard. [5,35]
Machine learning (ML) for AD Identification
Using its prior knowledge, training, and provided datasets, ML trains a machine to solve problems faster than a human. Because it is currently available, has less expensive computing power, and has less expensive memory, it is more important to process and analyse very huge amounts of data in order to find insights and correlations that are not immediately apparent to the human eye. Its intelligent behaviour is built on many algorithms that allow the machine to create salient judgements by abstracting from experience. [18].
Electronic health records (EHR) have grown significantly as a result of the expanding use and accessibility of medical technology throughout time. These EHR could be used to detect dementia utilising emerging technologies like ML and DL. One of the most extensively used and accessible clinical datasets are these EHRs. They are an essential part of modern healthcare delivery because they enable quick access to precise, current, comprehensive patient information and support correct diagnosis and coordinated, effective therapy. The data from the EHRs can be utilised to identify the individuals who are at risk for dementia by taking into account comorbidities, laboratory tests, vital signs, medications, and other therapy. Patients may occasionally additionally be subjected to pricy and invasive procedures including cerebrospinal fluid (CSF) collection for biomarker testing and neuroimaging studies like magnetic resonance imaging (MRI) and position emission tomography (PET). The EHR may also contain the results of these testing. Researchers claim that by using longitudinal clinical EHR data, it is possible to monitor the development of AD dementia over time. Recently, a number of automated diagnostic systems have been developed using ML and DL algorithms for a variety of disorders, including Parkinson’s disease, hepatitis, cancer, and heart failure prediction. [20]. The foundation of today’s artificial intelligence (AI) revolution, machine learning, offers clinical practise using medical pictures new opportunities [19]. A subset of AI known as machine learning (ML) is able to find hidden patterns in massive amounts of data, model the relationship between input quantities and clinical outcomes, and generate inferences or judgements that aid in more precise clinical decision-making. To attain sufficient precision for clinical decision-making, subject matter experts must still validate the computational hypotheses produced by ML models [20].
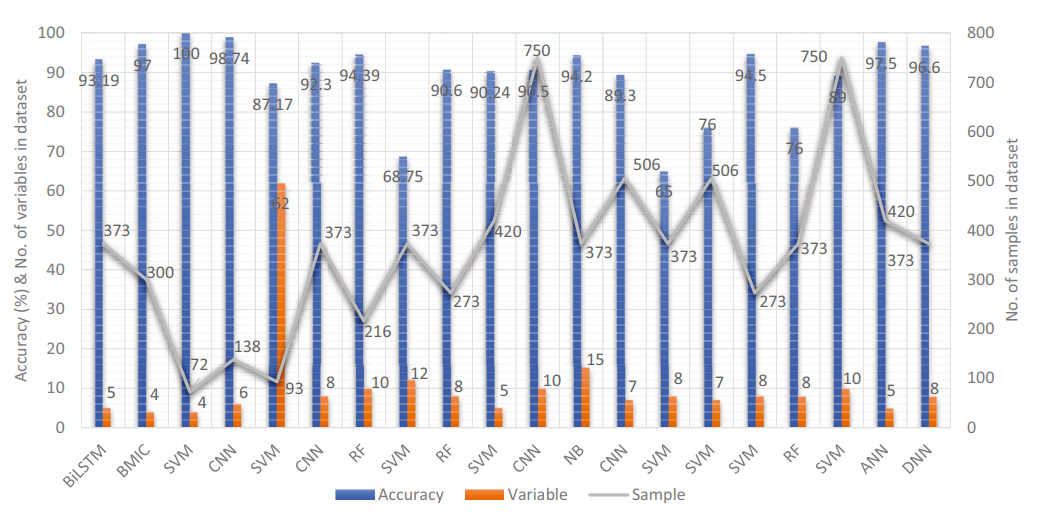
Fig 1.5 Comparison of ML models for accuracy based on image modalities
Deep Learning Approach for AD Identification
Deep learning uses multilayer neural networks to learn hierarchical representations from data. In medical imaging, these representations can support tasks such as classification, segmentation and prediction. Deep learning is a type of neural-network modelling, rather than an alternative unrelated to ANNs. Its performance depends on the training data and design, and automatic feature learning does not guarantee better accuracy, fewer parameters or freedom from overfitting. Regularisation and independent evaluation remain necessary. [18,21]
Automatic representation learning can reduce reliance on hand-designed features. However, models can learn dataset biases and shortcuts as well as clinically meaningful information. Reported performance must therefore be assessed alongside the split procedure, population, class balance and external validation. [18,21]
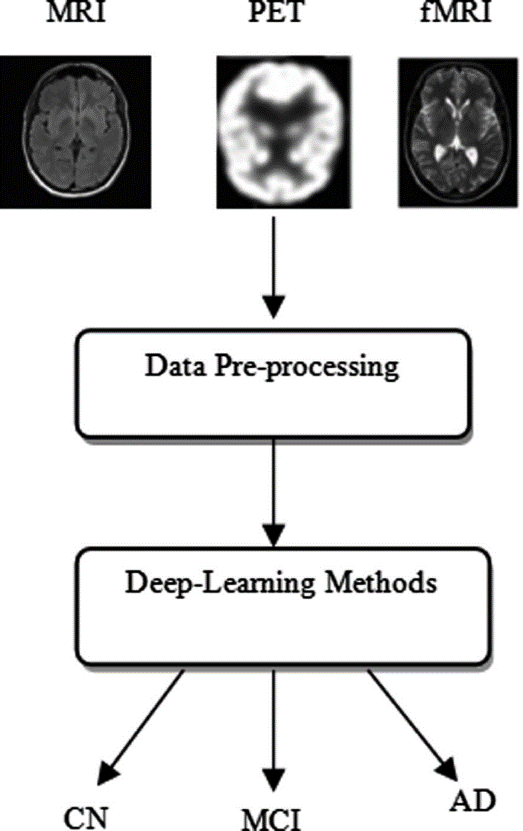
Fig 1.6 Deep Learning Approach for AD Identification
The classification of Alzheimer’s disease using deep learning approaches has yielded interesting results, but its application in clinical settings calls for a combination of high accuracy, quick processing, and generalizability to various populations [22].
Deep learning models use computer algorithms based on human learning to solve complex problems. To handle complicated issues, deep learning models employ computer algorithms based on human learning. Massive volumes of data are necessary for deep learning algorithms to reach the needed levels of performance accuracy. The hybrid methods, which combine conventional machine learning techniques for diagnostic classification with deep learning approaches for feature extraction, performed better in the limited imaging data available at the time and can be a viable option. Despite the fact that hybrid approaches have largely produced positive outcomes, they do not fully utilise deep learning, which automatically pulls features from vast amounts of imaging data. The CNN, which specialises in extracting attributes from images, is the most widely used deep learning technique in computer vision studies. For the classification of AD, deep learning techniques have produced accuracy levels of up to 96.0% [19].
Deep Learning in Medical Image Analysis
Learning algorithms
Machine learning methods are generally divided into supervised and unsupervised learning algorithms, although there are many nuances. In supervised learning, a model is presented with a dataset D = {x,y}Nn=1 of input features x and label y pairs, where y typically represents an instance of a fixed set of classes. In the case of regression tasks y can also be a vector with continuous values. Supervised training typically amounts to finding model parameters Θ that best predict the data based on a loss function L(y,ŷ), Here ŷ denotes the output of the model obtained by feeding a data point x to the function f(x; Θ) that represents the model.
Unsupervised learning algorithms process data without labels and are trained to find patterns, such as latent subspaces. Examples of traditional unsupervised learning algorithms are principal component analysis and clustering methods. Unsupervised training can be performed under many different loss functions. One example is reconstruction loss L(x,x̂) where the model has to learn to reconstruct its input, often through a lower dimensional or noisy representation [29].
Neural Networks
Neural networks are a class of machine learning models inspired by the structure and functioning of biological neural networks. They consist of interconnected nodes, called artificial neurons or units, organized in layers. Each neuron processes input data using an activation function and passes the result to neurons in the next layer. Through a process known as training, neural networks learn from labeled data to adapt their weights and biases, enabling them to make predictions or decisions. With their ability to model complex relationships and extract meaningful patterns, neural networks have been widely used in various domains, including image recognition, natural language processing, and predictive analytics.
Neural networks are a type of learning algorithm which forms the basis of most deep learning methods. A neural network comprises of neurons or units with some activation a and parameters Θ = {W, B}, where W is a set of weights and B a set of biases. The activation represents a linear combination of the input x to the neuron and the parameters, followed by an element-wise nonlinearity σ(·), referred to as a transfer function [29]:
a=σ(WTx+b).
Convolutional Neural Networks (CNNs)
Convolutional Neural Networks (CNNs) are a specialized type of artificial neural network designed to process and analyze visual data, such as images or videos. They are widely used in computer vision tasks, including image classification, object detection, and image segmentation.
CNNs are structured with layers that perform convolutions, pooling, and nonlinear activation functions. The convolutional layers apply filters or kernels to the input data, extracting local features and detecting patterns. These layers are designed to automatically learn and identify features at different levels of abstraction. [29].
Recurrent Neural Network (RNN)
A recurrent neural network (RNN) is a type of artificial neural network (ANN) that excels in handling sequential data by incorporating feedback connections. Unlike traditional feedforward neural networks, which process input data in a sequential manner and do not retain memory, RNNs introduce a temporal aspect by allowing information to persist and be shared across different time steps within the network.
The key feature of RNNs is the presence of recurrent connections, which enable the network to capture the dependencies and patterns within sequential data. These connections create a loop-like structure that allows the network to maintain a memory of past inputs and use it to influence future predictions or outputs. This memory property makes RNNs particularly suitable for tasks like language modeling, speech recognition, machine translation, and time series analysis [29].
Unsupervised models
Unsupervised models are a class of machine learning models used to analyse and uncover patterns, structures, or relationships within data without the need for explicit labels or target variables. Unlike supervised learning, where models are trained on labelled data, unsupervised models operate on unlabelled data. These models aim to discover hidden patterns, clusters, or associations within the data, providing insights and understanding of the underlying structure. Common unsupervised learning techniques include clustering algorithms, such as k-means or hierarchical clustering, and dimensionality reduction methods like principal component analysis (PCA). Unsupervised models are valuable for exploratory data analysis, anomaly detection, and generating meaningful representations of complex datasets [29].
Dataset related to AD
AD research datasets can include healthy controls, people with MCI and people with dementia. MCI is not an inevitable precursor of AD, and clinical labels, follow-up information and inclusion criteria differ between studies. [20,36]
Researchers use neuroimaging resources including ADNI and OASIS to study AD and related cognitive conditions. OASIS provides imaging data assembled by the Knight Alzheimer’s Disease Research Center and collaborators; ADNI brings together imaging, cognitive, genetic and fluid-biomarker information under its data-access procedures. The following subsections describe resources discussed in the cited review. A separate dataset-summary table is not supplied in this chapter, so the biomarker-classification table above should not be read as a dataset inventory. [20]
ADNI Dataset
The ADNI is a grouping of hospitals and academic institutions in the USA and Canada. Its primary goal is to offer research data under its access procedures that may be used to find biomarkers and correctly classify and monitor AD [18]. The Alzheimer’s Disease Neuroimaging Initiative (ADNI) study data, sometimes known as ADNI, aims to characterise the course of Alzheimer’s disease (AD). It evolved into a important resource for longitudinal, multisite MRI and PET scans of older controls and patients with AD, MCI, and other conditions. The phases discussed in the cited historical review include, including ADNI-1, ADNI-GO, ADNI-2, and ADNI-3. Although each of the four projects aims to progress AD research, changes in participant pools and modifications to data collection procedures over time due to new scientific knowledge and evolving technology [18] have been noted.
NACC dataset
One of the largest, longest-running, and multicenter databases on Alzheimer’s disease is the National Alzheimer’s Coordinating Centre (NACC), which was established in 1999. Regarding neuroimaging and biofluids, they are giving longitudinal and standardised data. The packages of MRI files at NACC may include T1-weighted, FLAIR, DTI, T2, or other MR series. NACC’s MRIs are best described as a convenience selection of pictures. The cited review reports a historical snapshot of 4924 scans and 26287 APOE genotype data [18].
OASIS dataset
OASIS-3 and OASIS-4 are releases discussed in the cited review of the Open Access Series of Imaging Studies (OASIS), which is a collection of research neuroimaging datasets. The OASIS-3 dataset for normal ageing and Alzheimer’s disease is a longitudinal multimodal neuroimaging, clinical, cognitive, and biomarker dataset. For people who complained about their memory, OASIS-4 contains MR, clinical, cognitive, and biomarker data. Three to four T1 weighted scans with a high contrast to noise ratio are used for each MRI. Here, the analysis of typical ageing and Alzheimer’s disease uses estimates of the intracranial volume and the overall volume of the brain [18].
HABS dataset
Neuropsychological, clinical, and imaging baseline data are provided by the Harvard Ageing Brain Study (HABS). The goal of HABS was to increase our knowledge of the early (preclinical) stages of Alzheimer’s disease and brain ageing. It collects imaging data to identify early Alzheimer’s disease-related brain alterations, such as amyloid plaques and tau tangles, as well as structural and functional imaging data and thorough evaluations of memory and other cognitive functions. With longitudinal observations up to 5 years from baseline, 290 subjects are included in the version 2.0 described in the cited review of the HABS public dataset. The Clinical Dementia Rating (CDR), the MMSE, the geriatric depression scale (GDS), and the Hachinski ischemia score are examples of clinical measurements. A consensus diagnosis (cognitively normal, mild cognitive impairment, or dementia) is also included [18].
Dementia-Bank dataset
The following counts describe the sample discussed in the cited review rather than the entire current repository. One of the essential datasets of spontaneous speech with and without dementia is Dementia-Bank, a shared database of multimodal interactions. The collection includes 93 healthy individuals and 117 individuals with Alzheimer’s disease who are both reading an image’s description. Data were gathered over time and recorded annually. The University of Pittsburgh School of Medicine’s Alzheimer’s and Related Dementias Study primarily supplied and managed transcripts and audio files for this study. Cookies, recall, fluency, and task data for sentence construction are all included in the database [18].
KAGGLE Repository
Kaggle hosts datasets contributed by different users. The cited source mentions a 253-image brain-tumour collection and also describes MRI images grouped into four dementia-related labels. These descriptions concern different tasks and must not be merged into one AD dataset. Without an exact dataset identifier, version and split procedure, the 253-image count cannot be assigned to the four AD classes or used to establish their sample sizes. Labels, provenance and patient-level independence require verification before research use. [18]
Image preprocessing
Preprocessing of the images significantly improved categorization accuracy. Image preprocessing methods are used in the context of medical imaging to produce a precise depiction of the anatomical structure of the human body. In the case of MRI pictures, they are used specifically to spot and pinpoint tumour cells inside the damaged human brain. Global and adaptive thresholding, the Sobel and high-pass filters, median blurring, histogram equalisation, dilations, and erosions [23] are examples of thresholding techniques.
Preprocessing includes noise removal, artefact removal, image improvement, and skull stripping. At the moment of acquisition, noise distorts MRI pictures, reducing their characteristics and limiting their analytical accuracy. There are several methods for removing noise from medical photos, which is a crucial step in the preprocessing process. Preprocessing removes issues brought on by bias fields, which are nothing more than lower frequency multiplicative fields and are overlooked if the MRI is carried out in a magnetic field with a relatively weaker magnetic field. Segmentation was done on the pre-processed image after the original image had been pre-processed. Finally, both the segmented, pre-processed image findings and the unprocessed image showed the abnormalities [24].
Additionally, image variation is added to the dataset using image augmentation techniques, which increases the robustness and generalization of the classification model.
Preprocessing using Median filter
Median filtering is a nonlinear operation that replaces a target pixel with the median of values in its selected neighbourhood. An arithmetic mean filter instead uses the neighbourhood average. These operations differ in their response to noise and edges. [25,41]
The pixel is covered by a mask in the median filter. The neighbour group, where the act’s covered elements are organised in ascending order, is taken, and the value in the middle is used as the new value for the pixel in the mask’s centre. Each value of the mask used by the average filter is multiplied by the corresponding pixel value in the image. The new pixel value in the image is created by adding these values together and dividing by nine [25].
Salt-and-pepper noise is often modelled using extreme pixel values, such as 0 and 255 in an 8-bit image. This model does not imply that every extreme-valued pixel is noisy or that all other values are noise-free. Filter choice and evaluation must consider the actual noise process. [25]
The margins of the image are kept while the “salt and pepper” noise is successfully removed with this technique. By sorting the pixel values and selecting the centre (median) value, median filtering efficiently lowers noise and improves image quality. The raw image that was obtained is first pre-processed using median filtering. The median filter is one of the most well-liked, practical, and fundamental filters. When the noise amplitude probability distribution contains wide tails and periodic patterns, median filters are especially useful for decreasing random noise. The median filtering procedure is performed by sliding a window across the image. The median filtering is defined by Eq. (1) as
𝑀𝑒𝑑𝑖𝑎𝑛 [𝐴(𝑦) + 𝑆(𝑦)] ≠ 𝑀𝑒𝑑𝑖𝑎𝑛 𝐴(𝑦) + 𝑀𝑒𝑑𝑖𝑎𝑛 𝑆(𝑦) (1)
The median is the middle value of an ordered neighbourhood, rather than its arithmetic average. The operations A(y) and S(y) in the preceding expression illustrate nonlinearity; they do not define the median as a mean. Subsequent min-max stretching is a separate contrast operation. [25,41]
Image Augmentation techniques for MRI images
The process of gathering photographs is frequently expensive and difficult. Image augmentation is a method used in image processing and computer vision to increase the size and diversity of a dataset by making a number of adjustments to the original images. It is particularly difficult to get adequate performance with a small dataset in real-world applications like medical and agricultural photos. It has been demonstrated that image enhancement is an effective and efficient tactic [26].
The image augmentation algorithm can be classified to three main categories.
A model-free approach can use a single image or a collection of photos to accomplish image augmentation without using a pre-trained model.
Model-based algorithms, on the other hand, demand that image augmentation techniques produce images using learned models. The augmentation procedure might be unrestricted, label-restricted, or image-restricted.
Finally, optimising policy-based algorithms select the best operations from a broad parameter space using the appropriate parameters. These algorithms can be further divided into techniques based on adversarial learning and reinforcement learning.
[26].
It can be used to expand the variety and size of brain tumour classification datasets, which will enhance how well deep learning algorithms perform for diagnosis and planning of treatments. Some of the popular augmentation process used for modifications are as follows,
Rotation: To accommodate for differences in the tumour’s orientation across various scans, MRI images of the brain tumour can be rotated by a specific amount.
Translation: In order to account for variations in the position of the brain tumour within the MRI scans, MRI pictures might be translated in various orientations.
Scaling: To accommodate for differences in the tumour’s size across different scans, MRI images of the brain tumour might be magnified or shrunk.
Shearing: In order to correct for picture distortions brought on by the MRI imaging process and provide an accurate portrayal of the tumour, MRI images might be sheared.
The pre-processed images go through a feature extraction phase after preprocessing.
Convolutional Neural Networks (CNN)
It has been discovered that convolutional neural networks (CNN) and other deep learning techniques outperform more conventional machine learning methods [19]. Convolutional neural networks are a type of deep learning network architecture that directly learns from data. By analysing patterns in the images, CNNs may identify items, classes, and categories in photographs. They are also very good at categorising audio, timeseries, and signal data [22]. A convolutional neural network (CNN) is made up of many convolutional layers. Removing the most crucial details from the images, detecting the various stages of AD, and, based on that knowledge, providing a helpful decision support system for clinicians to aid them in their diagnostic work are all benefits of using CNN [21].
Each layer of a convolution neural network, which may have hundreds of them, can be trained to recognise particular aspects in a picture. Each trained image is run through a series of filters with various granularities to train a neural network, and the distorted image produced is used as input for the layers that follow. The filters can start with relatively simple requirements, like how bright a picture should be and where the boundaries should be, and work their way up to more intricate guidelines that are unique to the thing being filtered. A convolutional neural network (CNN) has many hidden layers between its input and output layers. These layers can separate the data’s unique characteristics by modifying it in various ways. The most common types of layers are pooling, triggering, and ReLU layers. Convolution uses consecutive convolution layers to highlight certain details in an image [22].
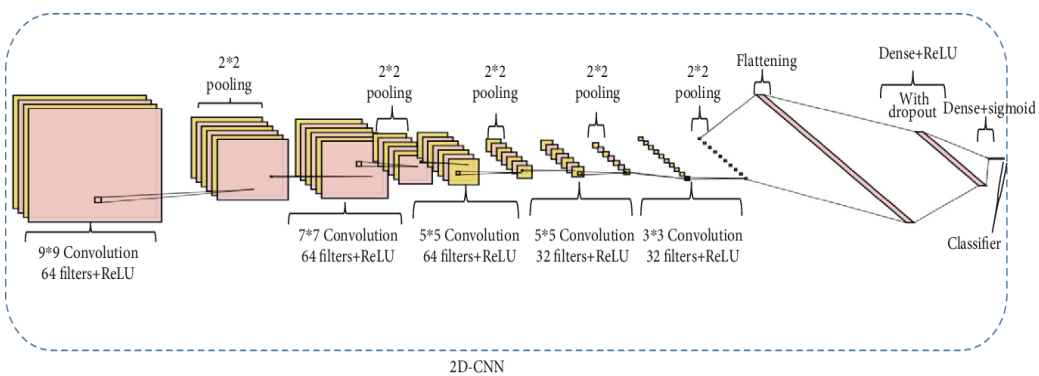
Fig 1.7 Working of CNN [22]
In deep learning, the same processes are carried out again across hundreds of layers, and each layer learns to recognise a different set of traits. In contrast to classic neural networks, CNNs move to classification once they have accumulated enough data over multiple layers. The probability for each category that a classification model can assign to a picture is contained in a K-dimensional vector created by a fully linked layer, which is the second-to-last layer, where K is the maximum number of classifications that can be predicted. In the end, a classification layer found in the CNN design’s final stage produces the classification outcome. The complete process and strategy for producing predictions are summarised below in fig 1.8.
Data Set → Preprocessing → CNN model → Training and Testing → Feature Extraction → AD Classification
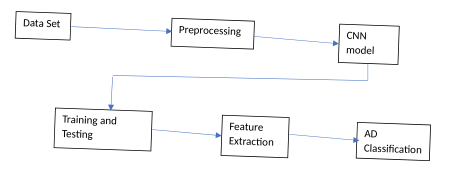
Fig 1.8 AD classification
Building blocks of Convolutional Neural Networks
Convolutional layers, activation functions, pooling and fully-connected layers are the core building blocks of CNNs, as depicted in Fig 1.9
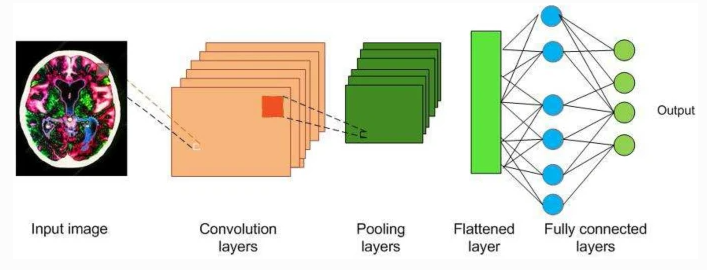
Fig 1.9 Building blocks of CNN [28]
Convolution layers (Conv layers)
Neuronal cells that extract image features make up the brain’s visual cortex. Different features are extracted by each neural cell, aiding in the comprehension of images. In order to extract properties like edges, colours, textures, and gradient direction, the conv layer models the neural cells over which it operates. Convolutional filters, often known as kernels, are learnable filters with a size of n x m x d, where d is the depth of the picture. The kernels are convolved across the width and height of the input volume during the forward pass, and the dot product between the entries of the filter and the input is calculated. CNN naturally picks up filters that are engaged when it encounters edges, colours, textures, etc. An activation function layer receives the output of the conv layer [28].
Activation functions or nonlinear functions
Since nonlinearity dominates in real-world data, activation functions are employed to transform nonlinear data. It is employed to make sure that the representation in the input space is appropriately transferred to a separate output space [28].
1.15.2.1 Sigmoid – It compresses a real-valued number, x, into the range between 0 and 1. Large negative and positive inputs in particular are positioned closely to 0 and unity, respectively. The formula is given in equation (2) [28].
f(x) = 1/(1 + exp(−x)) (2)
1.15.2.2 Hyperbolic tangent — The tanh activation in equation (3) maps a real input to a value between −1 and 1. [28,39]
f(x)=(1-e-2x)/(1+e-2x) (3)
1.15.2.3 Rectified linear unit (ReLU) – For quicker and more effective training, ReLU keeps positive values while converting negative values to zero. The following “layer” only receives the “on” attributes, which is why it is called “activation” [22]. The most popular nonlinear function for CNN, ReLU is written in equation (4) [28], requires less computing time than the other two, and is hence faster.
f(x)=max(0,x) (4)
Pooling reduces spatial dimensions by aggregating local activations, commonly with a maximum or average operation. It can provide limited tolerance to small shifts but does not guarantee invariance to rotation or all image variations. [28]
Fully connected (FC) layer
Fully connected layers combine learned features for the task-specific output. The final activation depends on the problem: sigmoid is common for a binary probability, softmax for mutually exclusive classes and a linear output for some regression tasks. A sigmoid is not mandatory for every CNN. [28]
Data preprocessing and augmentation
The raw images obtained from imaging modalities need to be pre-processed and augmented before sending to CNN. The raw image data might be skewed, altered by bias distortion, having intensity inhomogeneity during capture, and hence needs to be pre-processed. Multiple data preprocessing methods exist and the preferred methods are mean subtraction and normalization. CNN needs to be trained on a larger dataset to achieve the best performance. Data augmentation increases the existing set of images by horizontal and vertical flips, transformations, scaling, random cropping, colour jittering and intensity variations. The pre-processed, augmented image data is then fed into CNN [28].
Segmentation with convolutional neural networks
Segmentation models learn dense pixel or voxel labels, but many labels from one scan do not create many independent patients. Data augmentation, suitable losses and regularisation can help training; patient-level splitting and external evaluation are needed to assess generalisation. Class weighting does not by itself prevent overfitting. [29]
Segmentation quality must be evaluated in relation to the target anatomy, imaging resolution and intended application. Boundary errors can have different clinical significance across tasks, and unsupported universal distance thresholds should not be assumed. [29]
Optimization techniques for medical image analysis
Data mining of medical imaging approaches makes it difficult to determine their value in the disease’s insight, analysis, and diagnosis. Image classification presents a significant difficulty in image analysis and plays a vital part in computer-aided diagnosis. This task concerned the use of optimization techniques for the utilization of image processing, pattern recognition, and classification techniques, as well as the validation of image classification results in medical expert reports.
Optimization appears in many computer vision and image processing problems such as image restoration (denoising, inpainting, compressed sensing), multi-view reconstruction, shape from X, object detection, image segmentation, optical flow, matching, and network training. An optimized medical imaging procedure is on in which all of the variable factors and quantities have been adjusted to produce an image with the quality characteristics to provide visualization of the necessary anatomical structures and signs of pathology or injury to contribute to an accurate and effective diagnosis and appropriate treatment for each individual patient balanced against any associated risks [28].
Important optimization technologies in medical image analysis
Registration aligns images from different times or modalities. Iterative closest point is an alignment algorithm, while normalised mutual information is a similarity criterion that an optimisation procedure may use. They play different roles in finding an appropriate transformation. [30]
Segmentation optimization: Segmentation aims to partition medical images into meaningful regions or structures. Optimization methods, such as graph cuts, level sets, or Markov random fields, optimize energy functions that balance data fidelity and regularization terms. These techniques help refine segmentations by incorporating prior knowledge or enforcing smoothness constraints [30].
Classification optimization: Classification techniques are used to categorize medical images into different classes or label specific regions of interest. Optimization algorithms, like support vector machines (SVM), random forests, or deep learning methods, optimize model parameters to maximize classification accuracy, minimizing the error between predicted and ground truth labels [30].
Reconstruction optimization: Reconstruction techniques are used to generate high-quality images from incomplete or noisy data, such as in computed tomography (CT) or magnetic resonance imaging (MRI). Optimization methods, including compressed sensing, total variation regularization, or Bayesian approaches, optimize objective functions to recover the most accurate and artifact-free images [30].
Feature selection optimization: Feature selection aims to identify the most informative and relevant features from medical images. Optimization techniques, such as genetic algorithms, sequential forward/backward selection, or LASSO regularization, optimize objective functions to select features that maximize discriminative power, reducing dimensionality and improving classification or analysis performance [30].
These optimization techniques play a vital role in enhancing the accuracy, efficiency, and reliability of medical image analysis, ultimately contributing to improved diagnosis, treatment planning, and monitoring in healthcare.
Feature extraction
Feature extraction is an inevitable step in the area of image processing. In this process, the most discriminating features are extracted from the raw data. A good feature set contains discriminating information, which can distinguish one image from others. It must be as robust as possible such as to generate comparable feature vectors for all the images belonging to same class and discriminating feature vectors for images in different classes. After segmenting the image into different interested regions, it is required to acquire the features from optimal regions. Feature extraction is the technique employed to capture the features that will be more essential in the classification of images. Some of the features captured from segments are haralick features, texture features, and CNN features.
Haralick features
Haralick features, also known as texture features or Haralick texture descriptors, are a set of statistical measures used to characterize textures in images. They are commonly used in image analysis and pattern recognition. Haralick features capture properties related to texture, such as coarseness, contrast, and smoothness, by analyzing the spatial relationships between pixels in an image. By quantifying texture properties, Haralick features provide valuable information for various applications, including texture classification, segmentation, and object recognition.
A common texture property used for image classification depends on Gray-Level Co-Occurrence Matrix (GLCM). GLCM is the matrix defined in the image depending on the distribution of gray level intensity, and matrix is considered to make various texture measure computations. GLCM represents the distance and angular spatial Relationship of pixels of an image. Texture can be analyzed using Haralick features extracted by GLCM analysis. GLCM determines how often a pixel of a gray scale value i occurs adjacent to a pixel of the value j. Local features acquired from the co-occurrence matrix are termed haralick features.
As a result, the cooccurrence matrix shows the location of each pixel with the location of eight adjacent pixels surrounded by each pixel. Some of the haralick features uprooted from GLCM are discrepancy, diversity, homogeneity, ASM, energy, and correlation [31].
Texture features
The goal of texture feature extraction is to identify and measure the distinctive visual patterns and properties of textures present in images. It entails removing numerical descriptors that represent the characteristics of the texture, such as its regularity, smoothness, and roughness. Various techniques can be used to extract texture features, including statistical methods such as co-occurrence matrices, local binary patterns (LBPs), or Gabor filters. TA is a new method that mathematically detects changes in MRI signals that are not visible between image pixels, providing a quantitative and reproducible method for extracting image features. These methods analyze image spatial relationships and pixel intensity patterns to generate surface patterns that can be used for tasks such as texture classification, segmentation, or anomaly detection. Extracting texture features is crucial for many applications, including medical imaging, remote sensing, and computer vision [32].
Conclusion
Alzheimer’s disease assessment draws on clinical information and, where appropriate, biomarkers and imaging. Deep learning can support research on classification, segmentation and feature extraction, but reported accuracy must be interpreted in relation to the dataset, patient-level split and independent validation. Genetic risk, an imaging pattern and a computational prediction each provide different information. This review identifies relevant methods and resources without presenting them as a substitute for clinical assessment or claiming a new experimental result.
References
[1]. Israilovich, A.E. and Oybekovna, I.S., 2023. Clinical and Neurological Approach to Dementia of the Alzheimer’s Type. Central Asian Journal of Medical and Natural Science, 4(1), pp.7-11.
[2]. Hashmi, A. and Barukab, O., 2023. Dementia classification using deep reinforcement learning for early diagnosis. Applied Sciences, 13(3), p.1464.
[3]. Irish, M., 2023. Autobiographical memory in dementia syndromes—An integrative review. Wiley Interdisciplinary Reviews: Cognitive Science, 14(3), p.e1630.
[4]. Mueller, J. and Cammermeyer, G., 2023. Patient‐specific cognitive profiles in the detection of dementia subtypes: A proposal. Alzheimer’s & Dementia.
[5]. Juganavar, A., Joshi, A. and Shegekar, T., 2023. Navigating Early Alzheimer’s Diagnosis: A Comprehensive Review of Diagnostic Innovations. Cureus, 15(9).
[6]. Wojtunik-Kulesza, K., Rudkowska, M. and Orzeł-Sajdłowska, A., 2023. Aducanumab—Hope or Disappointment for Alzheimer’s Disease. International Journal of Molecular Sciences, 24(5), p.4367.
[7]. Breijyeh, Z. and Karaman, R., 2020. Comprehensive review on Alzheimer’s disease: Causes and treatment. Molecules, 25(24), p.5789.
[8]. Allada, A., Bhavani, R., Chaduvula, K. and Priya, R., 2023. Alzheimer’s disease classification using competitive swarm multi‐verse optimizer‐based deep neuro‐fuzzy network. Concurrency and Computation: Practice and Experience, p.e7696.
[9]. Leonenko, G., Shoai, M., Bellou, E., Sims, R., Williams, J., Hardy, J., Escott‐Price, V. and Alzheimer’s Disease Neuroimaging Initiative, 2019. Genetic risk for alzheimer disease is distinct from genetic risk for amyloid deposition. Annals of neurology, 86(3), pp.427-435.
[10]. Ibrahim, R., Ghnemat, R. and Abu Al-Haija, Q., 2023. Improving Alzheimer’s Disease and Brain Tumor Detection Using Deep Learning with Particle Swarm Optimization. AI, 4(3), pp.551-573.
[11]. Majd, S., Power, J., & Majd, Z. (2019). Alzheimer’s Disease and Cancer: When Two Monsters Cannot Be Together. Frontiers in neuroscience, 13, 155. https://doi.org/10.3389/fnins.2019.00155
[12]. Chopade, P., Chopade, N., Zhao, Z., Mitragotri, S., Liao, R. and Chandran Suja, V., 2023. Alzheimer’s and Parkinson’s disease therapies in the clinic. Bioengineering & Translational Medicine, 8(1), p.e10367.
[13]. Tikhonova, M.A., Chang, H.M. and Singh, S.K., 2023. Experimental and innovative approaches to multi-target treatment of Parkinson’s and Alzheimer’s diseases-Volume II. Frontiers in Neuroscience, 17, p.1171866.
[14]. Lane, H.Y. and Lin, C.H., 2023. Diagnosing Alzheimer’s disease specifically and sensitively with pLG72 and cystine/glutamate antiporter SLC7A11 as blood biomarkers. International Journal of Neuropsychopharmacology, 26(1), pp.1-8.
[15]. Park, S.H., Kwon, K.J., Kim, M.Y., Kim, J.H., Moon, W.J., Ryu, H.J., Jang, J.W. and Moon, Y., 2023. Diagnostic Tools for Alzheimer’s Disease: A Narrative Review Based on Our Own Research Experience. Dementia and neurocognitive disorders, 22(1), p.16.
[16]. Porsteinsson, A.P., Isaacson, R.S., Knox, S., Sabbagh, M.N. and Rubino, I., 2021. Diagnosis of early Alzheimer’s disease: clinical practice in 2021. The journal of prevention of Alzheimer’s disease, 8, pp.371-386.
[17]. Gunes, S., Aizawa, Y., Sugashi, T., Sugimoto, M., & Rodrigues, P. P. (2022). Biomarkers for Alzheimer’s Disease in the Current State: A Narrative Review. International journal of molecular sciences, 23(9), 4962. https://doi.org/10.3390/ijms23094962
[18]. Khan, P., Kader, M.F., Islam, S.R., Rahman, A.B., Kamal, M.S., Toha, M.U. and Kwak, K.S., 2021. Machine learning and deep learning approaches for brain disease diagnosis: principles and recent advances. IEEE Access, 9, pp.37622-37655.
[19]. Jo, T., Nho, K. and Saykin, A.J., 2019. Deep learning in Alzheimer’s disease: diagnostic classification and prognostic prediction using neuroimaging data. Frontiers in aging neuroscience, 11, p.220.
[20]. Javeed, A., Dallora, A.L., Berglund, J.S., Ali, A., Ali, L. and Anderberg, P., 2023. Machine Learning for Dementia Prediction: A Systematic Review and Future Research Directions. Journal of medical systems, 47(1), p.17.
[21]. Ullah, Z. and Jamjoom, M., 2023. A Deep Learning for Alzheimer’s Stages Detection Using Brain Images. Computers, Materials & Continua, 74(1).
[22]. Ganesh, D., Kumar, M.S., Aparna, M.C., Royal, M.C.J., Vinay, M.D. and Sri, M.D.S.H., 2023. Implementation Of Convolutional Neural Networks For Detection Of Alzheimer’s Disease. BioGecko, A Journal for New Zealand Herpetology, 12(01).
[23]. Abdusalomov, A.B., Mukhiddinov, M. and Whangbo, T.K., 2023. Brain Tumor Detection Based on Deep Learning Approaches and Magnetic Resonance Imaging. Cancers, 15(16), p.4172.
[24]. Saladi, S., Karuna, Y., Koppu, S., Reddy, G.R., Mohan, S., Mallik, S. and Qin, H., 2023. Segmentation and analysis emphasizing neonatal MRI brain images using machine learning techniques. Mathematics, 11(2), p.285.
[25]. Abu-Faraj, M., Al-Hyari, A., Al-Ahmad, B., Alqadi, Z., Ali, B.J.A. and Aldebe, K., 2023. Improving the Efficiency of Median Filters Using Special Generated Windows. Appl. Math, 17(1), pp.187-200.
[26]. Xu, M., Yoon, S., Fuentes, A. and Park, D.S., 2023. A comprehensive survey of image augmentation techniques for deep learning. Pattern Recognition, p.109347.
[27]. Ashnil Kumar, Lei Bi, Jinman Kim, David Dagan Feng,2020. Chapter Five – Machine learning in medical imaging,In Biomedical Engineering, Biomedical Information Technology (Second Edition), Academic Press, P.167-196
[28]. Sarvamangala, D.R. and Kulkarni, R.V., 2022. Convolutional neural networks in medical image understanding: a survey. Evolutionary intelligence, 15(1), pp.1-22.
[29]. Litjens, G., Kooi, T., Bejnordi, B.E., Setio, A.A.A., Ciompi, F., Ghafoorian, M., Van Der Laak, J.A., Van Ginneken, B. and Sánchez, C.I., 2017. A survey on deep learning in medical image analysis. Medical image analysis, 42, pp.60-88.
[30]. Maier, A., Syben, C., Lasser, T. and Riess, C., 2019. A gentle introduction to deep learning in medical image processing. Zeitschrift für Medizinische Physik, 29(2), pp.86-101.
[31]. Surendran, N. and Ahammed Muneer, K.V., 2017. Multistage classification of Alzheimer’s disease. International Journal of Latest Technology in Engineering, Management & Applied Science (IJLTEMAS), 6, pp.199-204.
[32]. Cai, J.H., He, Y., Zhong, X.L., Lei, H., Wang, F., Luo, G.H., Zhao, H. and Liu, J.C., 2020. Magnetic resonance texture analysis in Alzheimer’s disease. Academic radiology, 27(12), pp.1774-1783.
[33] World Health Organization. Dementia fact sheet. https://www.who.int/news-room/fact-sheets/detail/dementia
[34] U.S. Food and Drug Administration. FDA approves treatment for adults with Alzheimer’s disease. https://www.fda.gov/drugs/news-events-human-drugs/fda-approves-treatment-adults-alzheimers-disease
[35] U.S. Food and Drug Administration. FDA clears first blood test used in diagnosing Alzheimer’s disease. 16 May 2025. https://www.fda.gov/news-events/press-announcements/fda-clears-first-blood-test-used-diagnosing-alzheimers-disease
[36] National Institute on Aging. What is mild cognitive impairment? https://www.nia.nih.gov/health/memory-loss-and-forgetfulness/what-mild-cognitive-impairment
[37] GeneReviews. Alzheimer Disease Overview. https://www.ncbi.nlm.nih.gov/books/NBK1161/
[38] National Cancer Institute. Adult Central Nervous System Tumors Treatment PDQ, Patient Version. https://www.cancer.gov/types/brain/patient/adult-brain-treatment-pdq
[39] PyTorch documentation. Sigmoid and Tanh activation functions. https://docs.pytorch.org/docs/stable/generated/torch.nn.Sigmoid.html
[40] National Institute of Neurological Disorders and Stroke. Parkinson’s disease. https://www.ninds.nih.gov/health-information/disorders/parkinsons-disease
[41] SciPy documentation. scipy.ndimage.median_filter. https://docs.scipy.org/doc/scipy/reference/generated/scipy.ndimage.median_filter.html
[42] Jack CR Jr et al. NIA-AA Research Framework Toward a biological definition of Alzheimer’s disease. Alzheimer’s & Dementia. 2018;14:535–562. https://pmc.ncbi.nlm.nih.gov/articles/PMC5958625/
Cite This Work
To export a reference to this article please select a referencing stye below:

Academic Master Education Team is a group of academic editors and subject specialists responsible for producing structured, research-backed essays across multiple disciplines. Each article is developed following Academic Master’s Editorial Policy and supported by credible academic references. The team ensures clarity, citation accuracy, and adherence to ethical academic writing standards
Content reviewed under Academic Master Editorial Policy.





