
 Math
Econometrics and economic statisticsTextbook
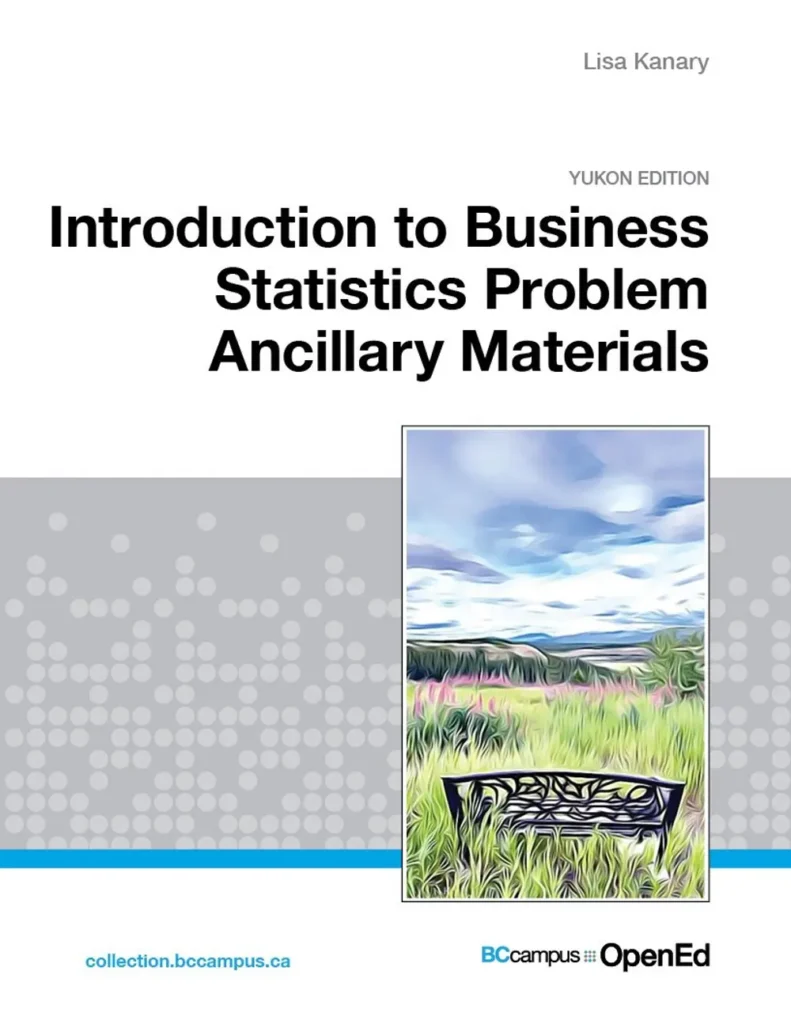
Introduction to Business Statistics Problem Ancillary Materials: Yukon Edition
Not rated yetRate this bookLisa Kanary’s Introduction to Business Statistics Problem Ancillary Materials: Yukon Edition supplies practice activities connected to OpenStax Introductory Business Statistics. Its northern Canadian business settings connect statistical reasoning with local decisions, and several sections develop spreadsheet skills. The collection includes chapters 1–8 and 13; it is a selective companion, rather than a replacement for every chapter of the main textbook. This guide follows those nine included chapters and separates interpreting a statistical question from carrying out its calculations.
Free reading is available at the official source. Opens in a new tab.
 Free
About this book
Lisa Kanary’s Introduction to Business Statistics Problem Ancillary Materials: Yukon Edition supplies practice activities connected to OpenStax Introductory Business Statistics. Its northern Canadian business settings connect statistical reasoning with local decisions, and several sections develop spreadsheet skills. The collection includes chapters 1–8 and 13; it is a selective companion, rather than a replacement for every chapter of the main textbook. This guide follows those nine included chapters and separates interpreting a statistical question from carrying out its calculations.
Chapter-wise summaries and reading tasks
Chapter 1. Sampling and Data
Sampling begins by identifying the population of interest, the sample actually observed, and the variable recorded for each observational unit. The exercises develop statistical vocabulary and distinguish different kinds of data and levels of measurement. These distinctions matter because a numerical label is not automatically a quantity that can meaningfully be averaged. Variation can arise naturally between observations or through the process used to select a sample. A large spreadsheet cannot repair a sample that systematically excludes part of the target population. The accompanying Excel activity introduces practical organization of data, but the underlying purpose remains clear: a defensible business conclusion must describe who and what the data represent.
Study task. Choose a northern business question and specify its population, sampling unit, variable, and measurement level. Explain one way the proposed sample could be biased.
Chapter 2. Descriptive Statistics
Descriptive statistics summarize the observed data before any wider inference is attempted. Tables and visual displays help reveal concentration, gaps, skewness, and unusual values; location measures, averages, and spread then describe different features of the same distribution. A mean can move substantially when an extreme value is added, while a median tracks the middle ordered observation. Variability determines whether an average describes a fairly consistent experience or conceals major differences. The Excel activities turn these ideas into repeatable calculations and displays. Their results still require interpretation: a graph should identify its units and a summary should explain why its chosen measure suits the distribution and business question.
Study task. For a small sales dataset, calculate the mean, median, and a spread measure. Add one unusually large value and explain which summary changes most and why.
Chapter 3: Probability Topics
Probability gives a numerical language for uncertainty before outcomes are observed. The collection introduces events, possible outcomes, and the relationships needed to combine probabilities. The addition rule concerns alternatives, while the multiplication rule concerns events occurring together under the appropriate dependence assumptions. Mutually exclusive events cannot happen together; independent events do not alter one another’s probabilities. These are different ideas, and confusing them leads to incorrect models of business risk. Translating a story into an event diagram or a small table makes overlap and conditional information visible. A probability calculation is useful only when the event being measured has been defined precisely.
Study task. Use a two-way table to describe two customer characteristics. Identify an intersection, a union, and a conditional probability, and explain why exclusivity differs from independence.
Chapter 4: Discrete Random Variables
Discrete random variables describe countable outcomes, such as the number of selected items with a particular characteristic. This ancillary contrasts hypergeometric and binomial settings, making the sampling process central to model selection. A binomial model uses a fixed number of suitable trials with a constant success probability and independence. A hypergeometric model fits sampling without replacement from a finite population containing a known number of successes. Similar-looking stories can therefore require different distributions. Spreadsheet functions assist with calculation, but readers must distinguish the probability of exactly a value from a cumulative probability over several values and define success consistently before entering arguments.
Study task. Create two inventory-sampling scenarios, one with replacement and one without it. Choose the distribution for each and specify what an exact and a cumulative probability would mean.
Chapter 5. Continuous Random Variables
Continuous random variables take values along a range, so probability is associated with intervals rather than a single isolated point. The included uniform-distribution section considers settings in which equal-length intervals within the allowed range have equal probability. Its density must account for the entire range, and the probability over an interval depends on that interval’s width relative to the total. A flat density is a modelling assumption, not a consequence of knowing only a minimum and maximum. Distinguishing a density height from a probability also prepares readers for the normal distribution. Timing and scheduling examples can make the geometric meaning of probability particularly clear.
Study task. Draw a uniform model for an explicitly stated waiting-time range. Calculate the probability of an interval and explain why the probability at one exact continuous value is zero.
Chapter 6. The Normal Distribution
Normal models describe continuous variation through a mean and standard deviation. Standardizing an observation expresses its location as a signed distance from the mean measured in standard deviations, allowing different scales to be compared with the standard normal distribution. The exercises distinguish finding an area from finding a cutoff that leaves a specified area. The accompanying Excel instructions provide computational tools, but a quick sketch remains valuable for deciding which tail or central region is required. A normal calculation should not be used simply because software offers it: the shape of the data, context, and plausibility of the model must first be considered.
Study task. Sketch a normal distribution and shade a lower tail, an upper tail, and a middle interval. For each, state whether the task asks for a probability or a cutoff value.
Chapter 7. The Central Limit Theorem
The central limit theorem connects sample statistics with their sampling distributions. The included activities focus on sample proportions and on the finite population correction, rather than supplying every topic in the parent textbook’s chapter. Readers should distinguish variation among individual observations from variation among repeated sample estimates. Larger samples generally produce more stable estimates under a suitable sampling design, but they do not erase systematic bias. Sampling a substantial fraction of a finite population without replacement can change the appropriate uncertainty calculation. These ideas are especially relevant when studying a relatively small northern business community, where a sample may represent a meaningful share of the entire population.
Study task. Compare sampling 50 customers from populations of 200 and 20,000. Explain why sampling fraction may matter even when the two samples contain the same number of observations.
Chapter 8. Confidence Intervals
Confidence intervals combine a point estimate with a margin describing uncertainty under stated sampling and modelling assumptions. Although the included section title is awkwardly worded, its worked material concerns estimating a population mean when the population standard deviation is known or a large-sample method is appropriate. The interval’s width reflects variability, sample size, and the selected confidence level. Confidence refers to the long-run performance of the interval-producing method; it does not guarantee that the particular estimate is close to the true mean. In a business setting, the result should be reported with units, the target population, the confidence level, and an explanation of the sampling process.
Study task. Identify the estimate, standard error, critical value, and margin of error in a mean interval. Explain how increasing sample size differs from increasing the confidence level.
Chapter 13. Linear Regression and Correlation
The final included chapter develops linear regression and correlation through Excel instructions. Correlation describes the direction and strength of a linear association, while a fitted regression line predicts a response from an explanatory variable. A scatterplot should be examined before a coefficient is interpreted, because curvature, outliers, and restricted ranges can make a single summary misleading. Regression output is useful when connected to the question: the slope has response-units per explanatory-unit, and residuals show differences between observed and predicted responses. An association alone does not establish a causal effect. Predictions far beyond the data range require particular caution, even when a fitted line looks convincing.
Study task. Fit a straight line to an appropriate small dataset in a spreadsheet. Interpret the slope, inspect residuals, and explain why the result does not by itself prove causation.
How to study this book
- Read the matching conceptual section in the parent OpenStax text before attempting the Yukon problems.
- Before calculating, write the target quantity, units, population, assumptions, and method in one short paragraph.
- In Excel, label inputs and preserve formulas so another student can reproduce the analysis. Check at least one result using a hand calculation or independent method.
- Report the statistical result and its practical meaning separately. Include limitations from sampling, model choice, or the local context.
Questions for reflection
- Which sampling problems can a larger sample reduce, and which can it leave unchanged?
- What changes when selecting items without replacement from a small population?
- Why can a strong correlation still be insufficient for a causal business recommendation?
Source edition and coverage
The source contains nine main chapters numbered 1–8 and 13, including selected subsections and Excel activities. The omitted chapter numbers are not missing from this guide: they are not supplied in this ancillary collection. This original study guide explains the source in new wording and adds learning activities. Read the publisher’s book and complete exercises.
About access & copyright
This page provides book information and study material. Full-text access is provided by the original publisher or authorised source; a listing does not grant permission to republish the book.
Read our Library Access & Copyright policyExplore the contents
Check the chapters covered in this edition.
Visit the official source
See reading, preview or purchase options.
Save for later
Keep this textbook in your saved collection.
Reader ratings & reviews
Share your thoughts
Your review helps other students choose the right resources.
KEEP LEARNING
Your next great read
Math Nursing
Population Health for Nurses
View Population Health for Nurses — book Music Theory
Fundmentals of Music Theory
View Fundmentals of Music Theory — book Science
Physics
View Physics — book Mathematical Modeling
From theORy to application: learning to optimize with Operations Research in an interactive way
View From theORy to application: learning to optimize with Operations Research in an interactive way — book Business
Organizational Behavior
View Organizational Behavior — book Nursing
Nutrition for Nurses
View Nutrition for Nurses — book evidence-based HRM
Evidence Based HRM: What we know about people in workplaces
View Evidence Based HRM: What we know about people in workplaces — book Science
Microbiology
View Microbiology — book Social Sciences



