
 Computer Science
Textbook
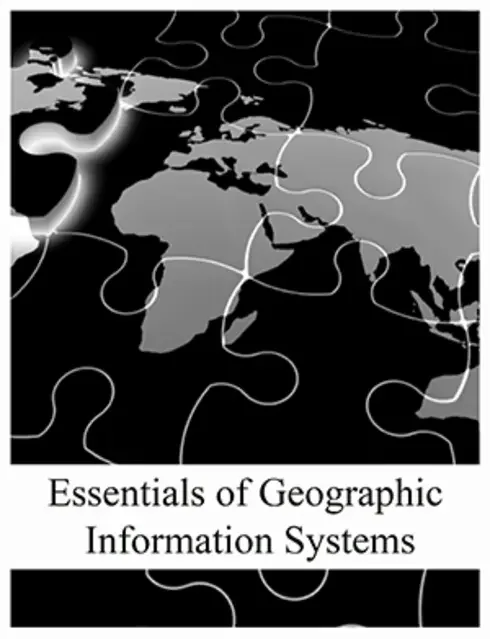
Essentials of Geographic Information Systems
Not rated yetRate this bookEssentials of Geographic Information Systems introduces the concepts needed to create, manage, analyze, and communicate geographic data. Jonathan Campbell and Michael Shin are the catalog authors. The linked archive is titled Geographic Information System Basics, version 1.0, and follows ten chapters from map fundamentals to project management. This guide makes that archival title explicit and emphasizes transferable reasoning rather than software-menu instructions. The central task is understanding how a data model, coordinate system, scale, measurement, and analytical choice affect the question a map can answer. A polished map can still mislead if its data or assumptions are unsuitable, so verification belongs throughout the workflow rather than only at the final layout stage.
Read on the publisher’s website. Opens in a new tab.
 Free
About this book
Essentials of Geographic Information Systems introduces the concepts needed to create, manage, analyze, and communicate geographic data. Jonathan Campbell and Michael Shin are the catalog authors. The linked archive is titled Geographic Information System Basics, version 1.0, and follows ten chapters from map fundamentals to project management. This guide makes that archival title explicit and emphasizes transferable reasoning rather than software-menu instructions. The central task is understanding how a data model, coordinate system, scale, measurement, and analytical choice affect the question a map can answer. A polished map can still mislead if its data or assumptions are unsuitable, so verification belongs throughout the workflow rather than only at the final layout stage.
Book summary
About this book
Essentials of Geographic Information Systems introduces the concepts needed to create, manage, analyze, and communicate geographic data. Jonathan Campbell and Michael Shin are the catalog authors. The linked archive is titled Geographic Information System Basics, version 1.0, and follows ten chapters from map fundamentals to project management. This guide makes that archival title explicit and emphasizes transferable reasoning rather than software-menu instructions. The central task is understanding how a data model, coordinate system, scale, measurement, and analytical choice affect the question a map can answer. A polished map can still mislead if its data or assumptions are unsuitable, so verification belongs throughout the workflow rather than only at the final layout stage.
Chapter-by-chapter study guide
Chapter 1: Introduction
GIS combines geographic data, analytical methods, people, and technology to investigate location-based questions. Spatial thinking asks where something is, how it relates to other features, and why the pattern matters. A map is one output of GIS, while the system also supports data management and analysis. Geographic representations simplify reality according to a purpose, so scale and context affect what can be inferred. The chapter establishes that successful work begins with a clear question rather than a collection of software operations. It also encourages attention to the relationship between geographic facts and the interpretations built from them.
Study application: Formulate a location-based question for a community service. Identify the decision it supports, the relevant features, and what information a simple point map would fail to provide.
Chapter 2: Map Anatomy
Maps use reference systems, coordinates, scale, projection, symbols, and layout elements to organize geographic information. A projection transforms the curved Earth to a plane and necessarily distorts some properties. The appropriate choice depends on region and purpose rather than a single universally best projection. Coordinate values are meaningful only with their reference system, and scale controls the detail that can be represented. Legends, titles, orientation, and source notes support interpretation, but decorative completeness cannot repair unsuitable geography or data.
Study application: Compare two projections for an area or distance task. Explain the tradeoff, identify the coordinate reference system, and show why combining layers with unrecognized reference systems can produce errors.
Chapter 3: Data, Information, and Where to Find Them
Geographic data become useful information through context, organization, and interpretation. Sources differ in coverage, resolution, collection date, accuracy, completeness, and permitted use. Metadata record these characteristics and help determine whether a dataset fits the question. Secondary data may save collection effort but can carry definitions or limitations from another purpose. A source's official status does not guarantee that its scale or date is appropriate for every project. The chapter encourages evaluating data before investing in analysis.
Study application: Compare two candidate datasets using extent, date, resolution, attribute definitions, accuracy, and license. Choose one for the project and document a limitation that the final result must acknowledge.
Chapter 4: Data Models for GIS
Vector and raster models represent geographic phenomena differently. Points, lines, and polygons encode discrete features and their relationships, while raster cells describe values across a grid. Choosing a model depends on the phenomenon, scale, and operations required. A raster cell size affects detail and storage, while vector geometry has its own representation and topology issues. Neither model is a direct copy of reality. Conversions can change boundaries or values, so the analytical consequences should be considered before treating formats as interchangeable.
Study application: Represent the same landscape using vector features and a raster grid. Explain which questions each supports and identify information that could be lost during conversion.
Chapter 5: Geospatial Data Management
Geographic datasets combine geometry with attributes stored in organized structures. Tables, field types, identifiers, relationships, and database design affect consistency and usability. Joins depend on compatible keys and expected cardinality; a mismatch can duplicate or omit records without making the map obviously wrong. File organization, naming, backups, and metadata support reproducible work. Data cleaning should preserve the meaning of missing or uncertain values rather than silently replacing them with convenient numbers. Management decisions shape the reliability of every later operation.
Study application: Design an attribute table with a stable identifier and appropriate field types. Test a join with missing and duplicate keys and explain how you would detect an incorrect one-to-many result.
Chapter 6: Data Characteristics and Visualization
Measurement scales and data distributions influence appropriate classification and symbols. Nominal categories differ from ordered, interval, and ratio measurements, and the map should not imply relationships the data do not contain. Classification methods can make the same distribution look different, especially when class boundaries or outliers change. Normalizing counts by population or area can answer a different question from mapping raw totals. Visualization requires matching the analytical purpose with the data's meaning rather than choosing an attractive color scheme first.
Study application: Map hypothetical event counts and rates separately, stating the question each answers. Compare two classification schemes and explain how a reader's impression changes without changing the observations.
Chapter 7: Geospatial Analysis I — Vector Operations
Vector analysis includes selection, spatial relationships, buffers, overlays, and operations that combine geometry with attributes. Each operation has assumptions about distance, boundaries, topology, and the meaning of the input features. A buffer is a geometric zone, not automatically a measure of travel time or actual access. Overlay can create small fragments or propagate existing errors. Results need attribute and geometry checks, not only a visual glance. The chapter encourages translating a question into a sequence of justified operations.
Study application: Find candidate service locations using a buffer and an overlay. Explain why straight-line proximity may differ from practical accessibility and identify one check for an unintended geometry or attribute result.
Chapter 8: Geospatial Analysis II — Raster Data
Raster analysis operates on cells through local, neighborhood, zonal, and broader functions. Alignment, resolution, extent, and treatment of missing cells affect the result. Surface and terrain applications derive information from neighboring values and therefore depend on the input's quality and scale. Combining grids with different definitions can produce a numerical output with little valid meaning. NoData should be distinguished from a genuine zero. A reproducible workflow records resampling and other transformations that could change interpretation.
Study application: Design a simple suitability model with several raster layers. State the normalization, weighting, alignment, and NoData rules, then test how changing one weight affects the selected areas.
Chapter 9: Cartographic Principles
Cartography organizes visual information so readers can understand a geographic claim. Symbol hierarchy, color, labeling, generalization, balance, and layout should serve the purpose and audience. Choropleth, proportional-symbol, and other map forms suit different variables and spatial units. A legend and source statement help readers interpret the representation and its limitations. Good design also avoids false precision and unnecessary detail. Ethical communication requires considering how choices of extent, classification, and emphasis can shape a conclusion.
Study application: Create two layouts for different audiences using the same analysis. Explain the changes in labels, detail, hierarchy, and explanatory notes, and check that the central claim remains supported.
Chapter 10: GIS Project Management
A GIS project connects a question, scope, data, methods, responsibilities, schedule, outputs, and evaluation. Planning identifies what can be delivered with available resources and what uncertainty remains. Documentation and quality checks support handover and reproducibility, while a clear communication plan helps the result reach the decision maker. Success is not simply completing a sequence of tools: the output must answer the intended question at an appropriate level of accuracy and usability. A project should preserve enough information for another person to understand and update it.
Study application: Assemble a project brief with a decision question, data inventory, method diagram, quality checks, deliverables, and limitations. Specify what another analyst would need to reproduce the final map.
Study instructions
- Choose one geographic question and carry it through data selection, modeling, analysis, visualization, and a final project brief.
- Record coordinate reference systems, scale, units, extent, resolution, and data dates before combining layers.
- Keep metadata and a decision log for transformations, joins, classifications, resampling, and weighting.
- Check intermediate tables and geometries as well as maps. A plausible picture can conceal missing or duplicated records.
- Distinguish raw counts from rates, zero from missing data, and geometric proximity from real access.
- Test the sensitivity of a result to classification, resolution, or weights where those choices influence the conclusion.
- Apply the concepts in a current GIS package using its official documentation; historical software references in the text are not current interface instructions.
Questions for reflection
- Why is a coordinate pair incomplete without a reference system?
- How can two accurate datasets still be unsuitable for the same analysis?
- When does mapping a rate answer a different question from mapping a count?
- Why is a buffer not automatically a measure of accessibility?
- What makes a GIS result reproducible?
Sources and edition coverage
Coverage follows all ten chapters of the linked archive, Geographic Information System Basics, version 1.0, preserved in December 2012. The catalog title is Essentials of Geographic Information Systems and credits Jonathan Campbell and Michael Shin (2011); the imported capitalization error in Michael's name is corrected. The original catalog cover is used. Concepts are distinguished from historical software examples. This is an original study guide. Read the linked textbook for its full explanations, evidence, worked examples, exercises, and references. The study applications above are new practice suggestions, not quoted textbook exercises.
About access & copyright
This page provides book information and study material. Full-text access is provided by the original publisher or authorised source; a listing does not grant permission to republish the book.
Read our Library Access & Copyright policyExplore the contents
Check the chapters covered in this edition.
Visit the official source
See reading, preview or purchase options.
Save for later
Keep this textbook in your saved collection.
Reader ratings & reviews
Share your thoughts
Your review helps other students choose the right resources.
KEEP LEARNING
Your next great read
Computer Science Computer Science
Physical Modeling in MATLAB
View Physical Modeling in MATLAB — book Earth Sciences
World Regional Geography - People, Places and Globalization
View World Regional Geography - People, Places and Globalization — book Computer Science
Open Data Structures: An Introduction
View Open Data Structures: An Introduction — book Computer Science
Foundations of Computation
View Foundations of Computation — book Computer Science
Think Bayes: Bayesian Statistics Made Simple
View Think Bayes: Bayesian Statistics Made Simple — book Cultural & Ethnic Studies
World Regional Geography
View World Regional Geography — book Computer Science
Python for Everybody: Exploring Data Using Python 3
View Python for Everybody: Exploring Data Using Python 3 — book Computer Science
An Introduction to Computer Networks
View An Introduction to Computer Networks — book Computer Science



