
Abstract
Cybercrime and network attacks create a need for effective intrusion detection. This paper describes an intrusion-detection workflow combining preprocessing, TF-IDF feature representation, seagull optimisation and a hybrid ensemble containing Bayesian classification and tree-based methods. The manuscript evaluates network-attack categories using the UNSW-NB15 dataset and presents implementations involving WEKA and Python. Its comparison table reports 99.98% accuracy for the proposed technique, alongside a reported processing time of 9.57 seconds. Class-level metrics, distribution charts and correlation heatmaps are also presented. These are reported experimental results, rather than independently reproduced measurements. The description of the ensemble integration and the relationship between textual features and network records limits reproducibility. The work illustrates a proposed combination of feature selection and classification while identifying the need for clearer implementation details and evaluation on live traffic.
Keywords: Cyber-security, Cyber Crime, J48, C4.5, I-forest, Decision Tree, IDS (Intrusion Detection System), NIDS, Bayesian Network Classification, Machine Learning.
Introduction
Cybercrime includes offences involving computer systems, internet services and digital information. Classifying incidents and identifying attack patterns can support the development of detection systems [1–8]. Network intrusions, malicious software, credential theft and other forms of unauthorised access present different technical challenges. An intrusion-detection system (IDS) analyses observable events to distinguish potentially malicious behaviour from normal activity. The classification task requires suitable data, informative features and a clear evaluation procedure. This paper focuses on a machine-learning workflow for identifying attacks in network records, while also discussing a separate web-application implementation.
The cross-border nature of internet communication creates challenges for investigation and legal jurisdiction, but network detection and legal adjudication are different tasks. An IDS can identify patterns that warrant investigation; it does not determine criminal responsibility or resolve jurisdictional questions. The present study therefore evaluates technical attack classification rather than the performance of courts or law-enforcement agencies [10–14]. This distinction defines the scope of the proposed system and the conclusions that can be drawn from its reported results.
The proposed IDS combines Bayesian network classification with a hybrid ensemble containing J48, C4.5, decision-tree and I-forest components. Seagull optimisation is used for feature selection. The workflow is intended to reduce the feature space and support classification of normal and malicious records. Performance is assessed through accuracy, class-level measures and processing time. These measures describe the reported experiments; wider claims about deployment require separate testing on representative network traffic.
Organisation of the Paper
The rest of the document is organized as follows: Section 2 contains relevant articles. Section 3 presents the experimental details and discussion of the proposed model. Section 4 presented the experimental setup and discussion of results. Finally, Section 5 summarizes the conclusion and indicates future research directions.
Related Work
Ramirez and Choucri [11] examined the importance of consistent cybersecurity terminology for interdisciplinary communication. Differences in vocabulary can obstruct collaboration between technical and non-technical stakeholders. Their review provides a basis for defining terms clearly when discussing threats, detection systems and responses.
Sultana et al. [12] reviewed machine-learning approaches to network intrusion detection in software-defined networking (SDN). Their discussion considers available methods, tools and continuing challenges, including the role of deep learning in the design of intelligent detection systems.
Karie et al. [13] discussed deep learning and cognitive-computing techniques in cyber forensics. These approaches can support the examination of digital evidence, but their usefulness depends on the quality of the data, the analytical task and the requirements of forensic investigation.
Torres et al. [14] reviewed machine-learning techniques applied to cybersecurity. Their work surveys classification and detection applications and highlights the need to select models in relation to the problem being investigated. This provides context for comparing alternative classifiers within an intrusion-detection workflow.
Yong Shi et al.,[15] proposed A machine method Using the ELM (Extreme Learning Machine) for detecting domain names of malware. ELM is a new link for the most accurate and highly learning rates. They used ELMs based on features taken from the number sources to rank domain names. Their experience has shown that the established detection method can provide a veracity of detection that is more than 95% and high rate. Our ELM-based approach’s the high learning rate was also shown with the help of a comparative experiment. Therefore, they believed that their method of using ELM was effective and efficient in detecting malicious domains, which improved the current APT attack detection mechanism.
Jungkook An and Hee-Woong Kim et al.,[16] proposed analytical data framework for cybercrime covert analysis, classification model, definitions of CaaS and criminal software. Moreover, we have evolved an application example to exhibits how the classification model and proposed structure can be applied in practice. With this app, they then looked at the economy of the underground. cyber-crime by analysing big data from the hacking community. It also gave professionals practical advice and guidance from different sectors how governments and organizations have able to prepare for clandestine cybercrime attacks.
Noor et al. [17] proposed a machine-learning framework for attributing financial-technology cyber threats using high-level indicators of compromise. Attribution and intrusion detection address related but distinct questions: detection identifies potentially malicious activity, whereas attribution seeks information about its source. Such work illustrates the range of tasks for which cybersecurity data can be analysed.
Baykara et al., [23] suggested the detection of phishing attacks which is a form of cybercrime. In this the attackers imitates like an original office person or institution and encourage them as an official person through mail or any other communication medium. In this method, the attackers send the harm full mail to the victims that will perform various functions like capturing or login into the account and theft the money or theft the identity of victims. Here by Bayesian algorithm, classifications of spam of the word added to the database is used. The author fails to analyse the mail content more thoroughly with basic test mining and also fails to analyse the accurate result and classification with ANN.
Sudha.T. S, et al., [24] proposed that analysing and evaluation of integrated cybercrime offences. To improve the cybercrime detection system and prediction of cyber-attacks yearly, incorporating the MLT such as clustering and classification into our model. To provide the preventive measures in order reduce the cybercrime incarnation and has the ability to detect and analyse the cyber-attacks.
Kim et al.,[25] explained that a data analytics approach and underground economy of cybercrime. Although the raising of cyber threats, still there has been little research into the foundations of the subject or methodologies that must serve to guide information systems researchers and practitioners who deal with cyber security. From the largest hacking community, the author collected a data and didn’t collect the data from other communities. Need more analyses on Crimeware and CaaS available in the underground of cybercrime. To overcome the above issues in cybercrime security we proposed the Intrusion Detection System based on Bayesian Network Classifier and hybrid ensemble algorithms.
Proposed Workflow
This section takes a closer look at machine learning and IDS systems, as well as various current techniques and trends in data mining and machine learning techniques [26]. The recognition systems were established to find and avoid malicious activity and give dependable protection for critical security systems [27]. Recent Research communities are focusing on intelligent IDS a system, which is capable of detecting intrusions with intelligent behaviour, for providing an effective security system. Recognition systems perform detection of internal intrusion prevention, one of the most important functions for finding input, is to find different patterns in the actions of users. inform early and deal with attacks. IDS is classified into two important classifications. That are HIDS (Host Intrusion Detection Systems) and NIDS (Network Intrusion Detection Systems). HIDS treats local management record data as a Windows control file or changes information, but NIDS analyses network traffic data, a TCP storage file stored on the network. The signature code, also known as rules-based tracking, determines the user behaviour by comparing some specific rules that are relevant to legitimizing user behaviour. To find the classification of data for possible users over a period of time, In IDS systems, another one more Statistical anomaly detection approach is used [28]. To define the behaviour of unauthorized users, with the highest level of privacy, these profiles (training structures) can be utilized. In figure 1 shows the schematic diagram of proposed methodology.
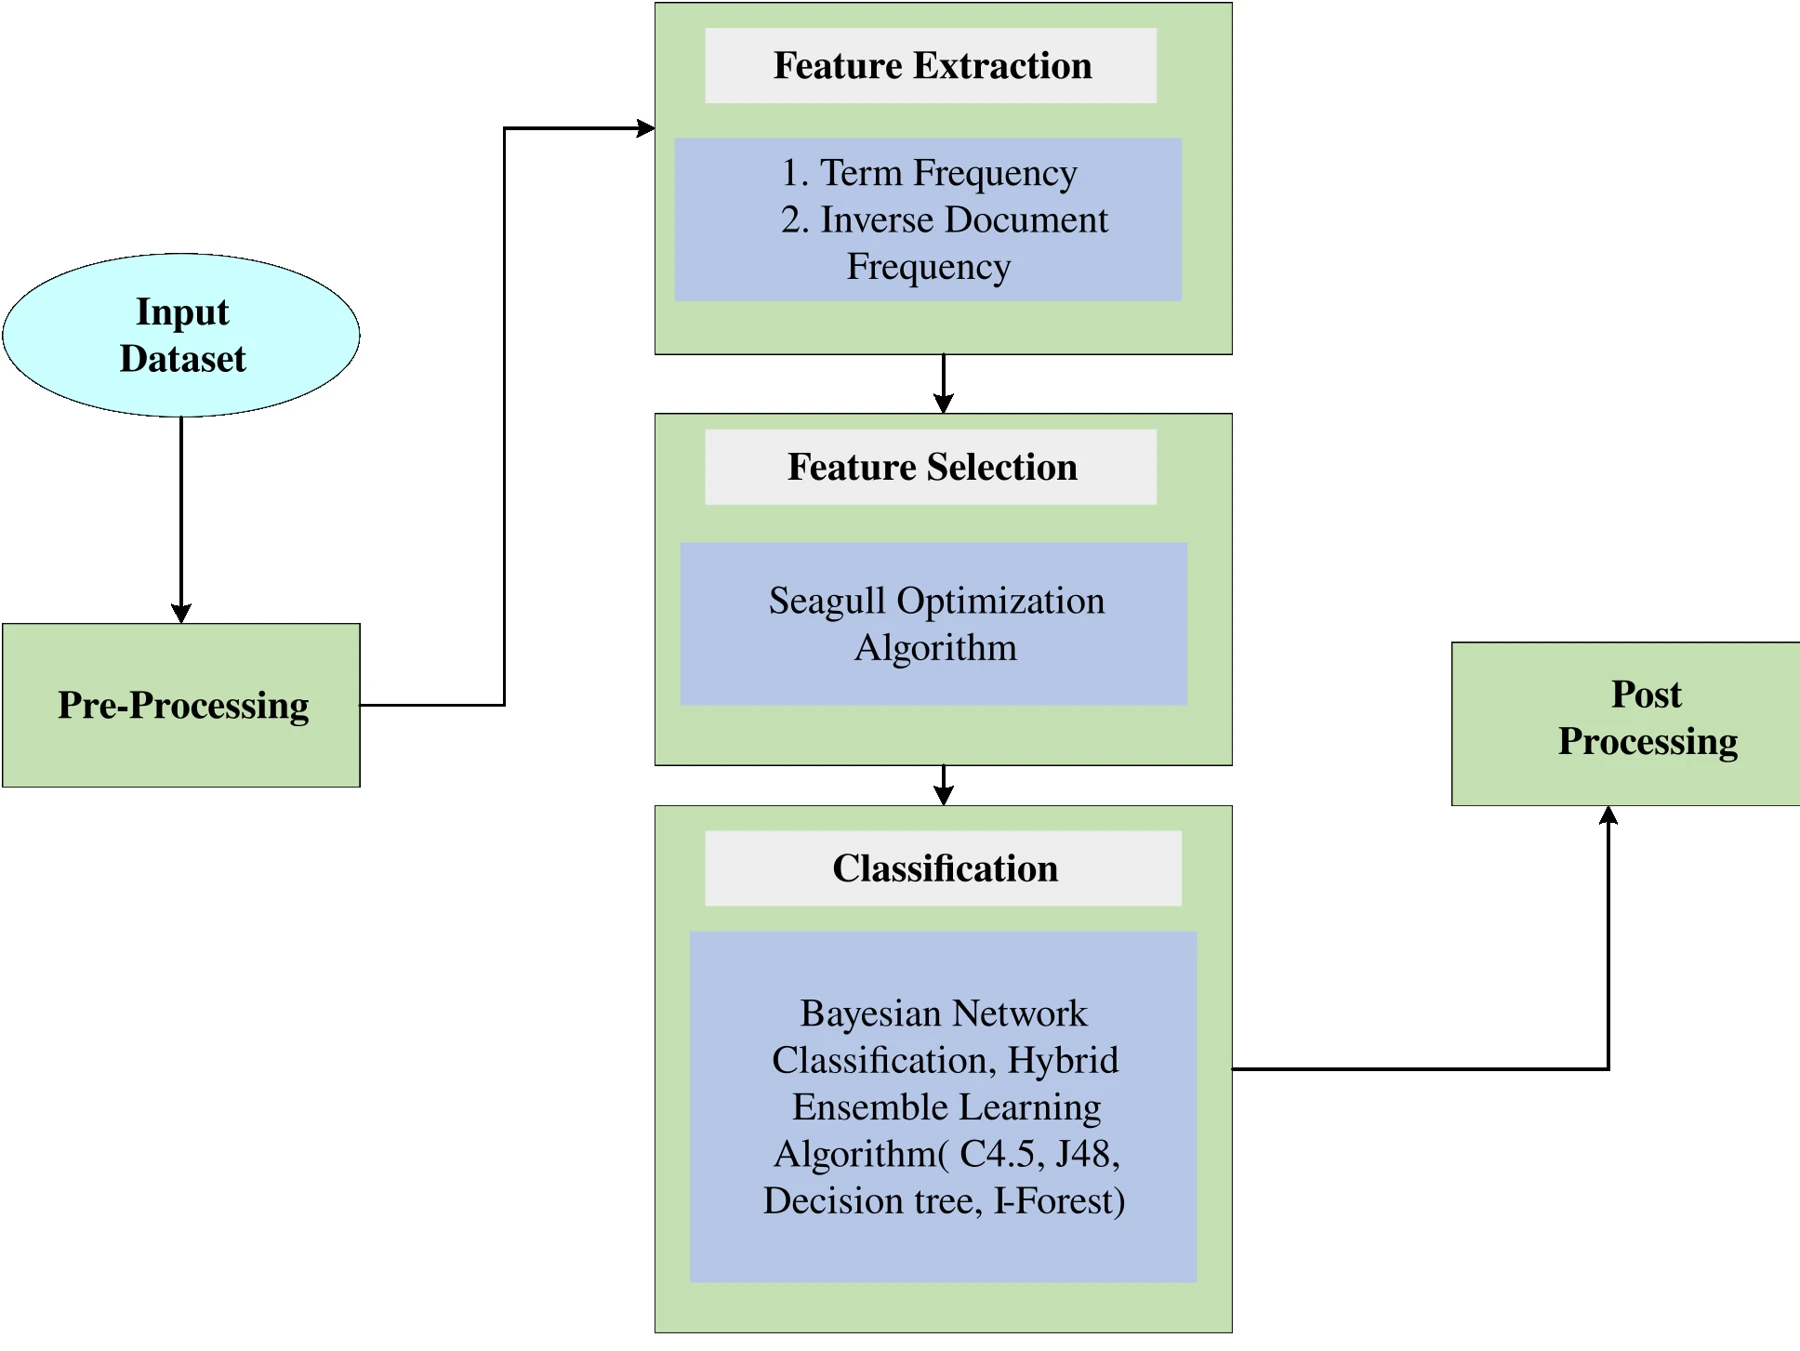
Figure 1 Schematic diagram of Proposed methodology
Research Contributions
The contribution of this work is illustrated as follows:
The Intrusion Detection based Bayesian Network Classification is done for reducing the security losses in the Cybercrime.
The Hybrid ensemble learning algorithm are included to enhance the performance of this work.
For the Feature Selection Seagull Optimization algorithm is included.
Here UNSW-NB15 dataset is used which is built for the NIDS evaluation.
The proposed strategy is applied and accuracy are analysed and validated with existing techniques to show the supremacy of the proposed approach.
Data Preprocessing
In machine learning data pre-processing is the main process and in data mining and information mining also it is used. However often neglected, pre-processing is important one in data mining. This is used to recover the features of data and recover the efficiency and easy to mining process. Data pre-processing contains five steps for processing. They are data cleaning, data normalization, data transformation, data feature extraction and data selection etc., The initial data of the data affects the outcomes of the data mining because initial data has lower signal to noise ratio, missing values and inconsistency. To improve the features of data, efficiency and easy to classify the mining process.
Feature Extraction
The feature extraction procedure only lay hold of place in these phases. High dimensional data is changed into low dimensional data by this method. The pre-processed data are needful for data visualization because of composite data can arrange competently when that composite data is converted as low dimension data. In this paper, TFIDF or vector process is used for feature extraction [29]. The unigrams and bigrams of each cybercrime would be evaluated by this. For the feature extraction, use of a bag of a model is one of the best approaches which finds out a model for each feature and find the number of different words presented in our case.
Not Selecting the words that appears in order of each feature and different words are taken for consideration. Incident, Offender, Harm, Access Violation, Year, Victim are the features based on the content. The classification of cybercrimes is made by these features. Theft identification, hacking, attack of copyright, and others can be done by vector with finding the frequency of words [30-33]. Before analysis of prediction, the text data must be pre-processed and remove the noise or words called tokenizers. To identify the relevant terms in a document was used in this work and it contains two parts.
They are:
Term Frequency
Inverse Document Frequency
Term Frequency
Concerning complete collection and using the equation (1), In the specified report, how often a word has demonstrate and finds out the each word’s importance in the document is calculated [34–36].
Inverse Document Frequency
It reduces the specified words that appeared many times in the report that are present in the report.
The important steps in are, (a) The sentence tokenization (b) Term frequency evaluation () (c) Inverse document frequency evaluation () (d) Results of multiplying the and to form score calculation (e) Sentences of the record’s score (f) Find out the threshold value.
The sentence tokenization is the first step. In this method words present in the records are tokenized and assigned a weights value to each word. The second step is the evaluation of the term frequency. Evaluating the term frequency () for each term present in a record based on statistics of its presence in a record.
(1)
(2)
Where, = Number of times the term appeared in the record.
= The number of terms totally in a record.
Evaluation of the inverse document frequency is the third step of this method. For each term in a record, the inverse document frequency is evaluated in this method. Finally, these are saved in a matrix represented as matrix.
(3)
Where, = The total number of records
The fourth step is the calculation of score, here the score of is evaluated by taking each matrix of two frequencies, i.e., and .
(4)
Sentences of the record’s score are the fifth step of this method. The scoring of the sentences is different in various methods or algorithms. The score of the sentences is allocated by a score to the terms of the sentences, we have taken . All the terms of a sentence’s average value of become the score of those sentences.
Find out the threshold value is the sixth step of this method. To evaluate the values of the threshold, the number of algorithms is used in this method. Here we have examined all the sentences ‘average score as the threshold and in the data, this value is used to detect the correlated terms.
To find out the connection between the two absolute imputes of the events [37], the chi-squared the measure is used.
(5)
Where is denoted as the observed number of events and cybercrimes and is denoted as the expected number of events and cybercrimes. For features of events, we calculate the frequency of term and inverse document, for every cybercrime event, these are used to calculate the vector.
Feature Selection Using Seagull Optimisation
In our work seagull optimization algorithm is used for the feature selection process. Globally covered seabirds are called Seagulls which is technically known as the seagull family. Depending upon their weights and lengths, seagulls are classified into many types. Seagulls have come under the omnivores types because they eat food like fish, amphibians, insects, earthworms and reptiles. Maximum seagull birds have feathers of white colour and are so intelligent birds. These seagulls have many specialties to attract the food that using the crumb of bread to attract the fish and using the rain sound effect on their feet to attract the earthworms in the underground. Both fresh and saltwater are drunk by seagulls [38]. Using this way seagulls are migrated and attack the prey. How a seagulls group moved from one place to another place was simulated by the algorithm during the migration. The seagulls should follow the following conditions.
We use an extra variable during the collaboration between the adjacent search agents to estimate the new search agent location.
(6)
Where = The position of the search agent.
= The current position of search agent
= The movement behaviour of the search agent in a given search space
(7)
= Control the frequency.
is decreased from to 0.
= Current iteration
The search agents are move in the direction of best neighbour after neglecting the collaboration between the neighbours.
(8)
Where, is represented as the search agent’s position towards the best-fit search agent . For balancing between exploitation and exploration, the behaviour of is distinguished.
(9)
Where = The random number ; 0 < <1.
At last update the position of search agents concerning best search agent in the following equation,
(10)
= Distance between the search agent and best-fit search agent
To take the benefits of the history and experience of the search process, this development is designed. During the prey attack the spiraling action takes place in the air. In the x, y, and z axis, this behaviour is denoted as follows [39].
(11)
(12)
(13)
(14)
= The spiral’s radius of each turn.
= The random number ;0 to 2.
and = The shape of spiral constants.
= The base value of the natural logarithm.
= (15)
Where = The updated position of the search agent.
The best solution and updates the position of other search agents are saved by .
Seagull Optimisation Pseudocode
Input and Output: Initialize the input and output parameters of SOA. Population of Seagull and optimal search agents . Maximum Iteration, = Current iteration. Procedure: Set = Control the frequency 2 Set 1 Set 1. While (< max iteration) do = Compute fitness () , fitness calculation Behaviour of Migration, = The random number; 0 < <1. = The random number ;0 to 2. Attacking behaviour, Distance Calculation, ; = ; end while return end procedure procedure Compute Fitness ( ) for i 1 to n do, a given problem dimension representation. Calculate the fitness of each individual. end for Calculate the best fitness value, Return best fitness. end procedure procedure Best Best fitness, For i 1 to n do If (fitness < Best), then Best fitness, end if end for return best end procedure |
|---|
Hybrid Ensemble Learning
Bayesian Network Classification, J48, C4.5, Decision tree and I-forest are combined to form hybrid ensemble learning algorithm.
Bayesian Classification
In our work mainly discussed with Intrusion Detection System (IDS) based on the Bayesian Network classification with hybrid ensemble learning algorithms. Benign and Malicious are the two defined labels in the sample space [40]. The distribution probability is expressed below,
(16)
For each vector’s prior probability is expressed below,
(17)
The two label’s posterior probability is denoted below,
(18)
If the noticed features denoted a strong chance that a post is a malicious post. Hence, the rule for classification is expressed as follows,
(19)
Decision Trees and I-Forest
Decision trees elect the best parts for each category to regulate the structure of the tree depend on convinced defined criteria. One of these norms is to use statistical analysis. Decision trees are very fast to operate and are very likely to be an attack even though there is a lot of information. The classification algorithm has been thoroughly studied to create models from a customized data collection. In order to proper use those hypotheses to organize unseen data, effective learning is the process of considering hypotheses from specific models. A simple learning model for the classification algorithm is known as classification. The converter may look at a map from the attribute assigned to specific class. By the values of their attributes data items are defined and The value of the X is the vector {x1, x2,……,xn} is either nominal or numeric. The set containing all possible attribute vectors are called as attribute space and is denoted by Z. Thus, Z (X∈Z)’s element is X. C = {c1, c2,……,cn}, this is a set of all classes . For every attribute of the vector X∈Z a classifier assigns a class c∈C . The classifier can be considered as a mapping f, where f: X→C.
To classify unseen data with a class label, this classification is used. Using the values of its attributes, DT classifies distributed data items. Initially, The DT was created from a pre-configured set of data. By the values of the attributes, each statement section is defined [41]. The important thing is to choose the attributes that best divide the materials into their classes. According to the values of these attributes the information resources are distributed. This process is repeated in each subset of the data objects. When the process is complete all the current components will be transferred to the same class. DT contains nodes, leaves, and edges. The DT node represents the attribute to separate the data. Each node has several edges, named according to the potential value of the edges and the potential value of the attribute in both of you. The edge connects the two parts, or the node and the leaf. Leaves are labelled as decision values for organizing information. Incorporating DT using training data, described for attributes.
C4.5 and J48
For generating classification models, learning the decision tree is one of the machine learning methods. For the ID3 algorithm, in this paper, C4.5, a next step will be used to create classification decision trees. Leaf nodes are a class symbol or a class distribution. The uppermost node of the tree is the root node and the source of most information. Following the root node, one of the remaining attributes with the most important information is selected for the following node. Until all the attributes have been compared, this process will extend, whether the models are in the same class or not remnants left that can be separated from the models [42].
For the current node, the result and the maximum amount of information (or entropy reduction) were selected as test scores such a theory-oriented approach reduces the number of attempts to sort something and claims to find a simple (but not easy) tree.
Consider selecting a case at random from a set of S-set sets and claiming that they belong to certain classes Cj. The probability that an arbitrary sample belongs to class Cj is estimated by
(20)
|S| = The number of samples in the set S, entropy of P is,
(21)
(22)
Gain (X’, T’), The information gain is then defined as
(23)
This shows the difference between the identify information as a part of and the identify information as a part of after evaluating the value of the element, this is the result of information by element .
Detection rate (recall) and false-positive rate are defined below. The fraction in Equation (27) is precision, rather than detection rate.
(24)
(25)
UNSW-NB15 Dataset
The UNSW-NB15 data set contains nine family of attacks depending upon the nature of attacks behaviour [43].
Analysis
This class contains the various form of attacks depending upon the port scans, vulnerability scans, Scam files and foot printing, in some manner, here the network is scanned but not exploited, it is also called as Active Reconnaissance.
Backdoors
Here, to gain illicit access, this method uses a method by which use a legitimate system portal by attackers. In a computer system, the backdoor to install themselves use malicious software. As a part of an exploit for an attacker, to provide remote access.
Denial of Service
This is a well-known cyber-attack where with the help of many connections of illegitimate requests. To compromise a machine to make the network resource unavailable the perpetrator needs to its deliberated users temporarily or permanently. From a legitimate network activity DoS can be tough to differentiate, in progress, such intrusive activities are detected and there are some indictors available.
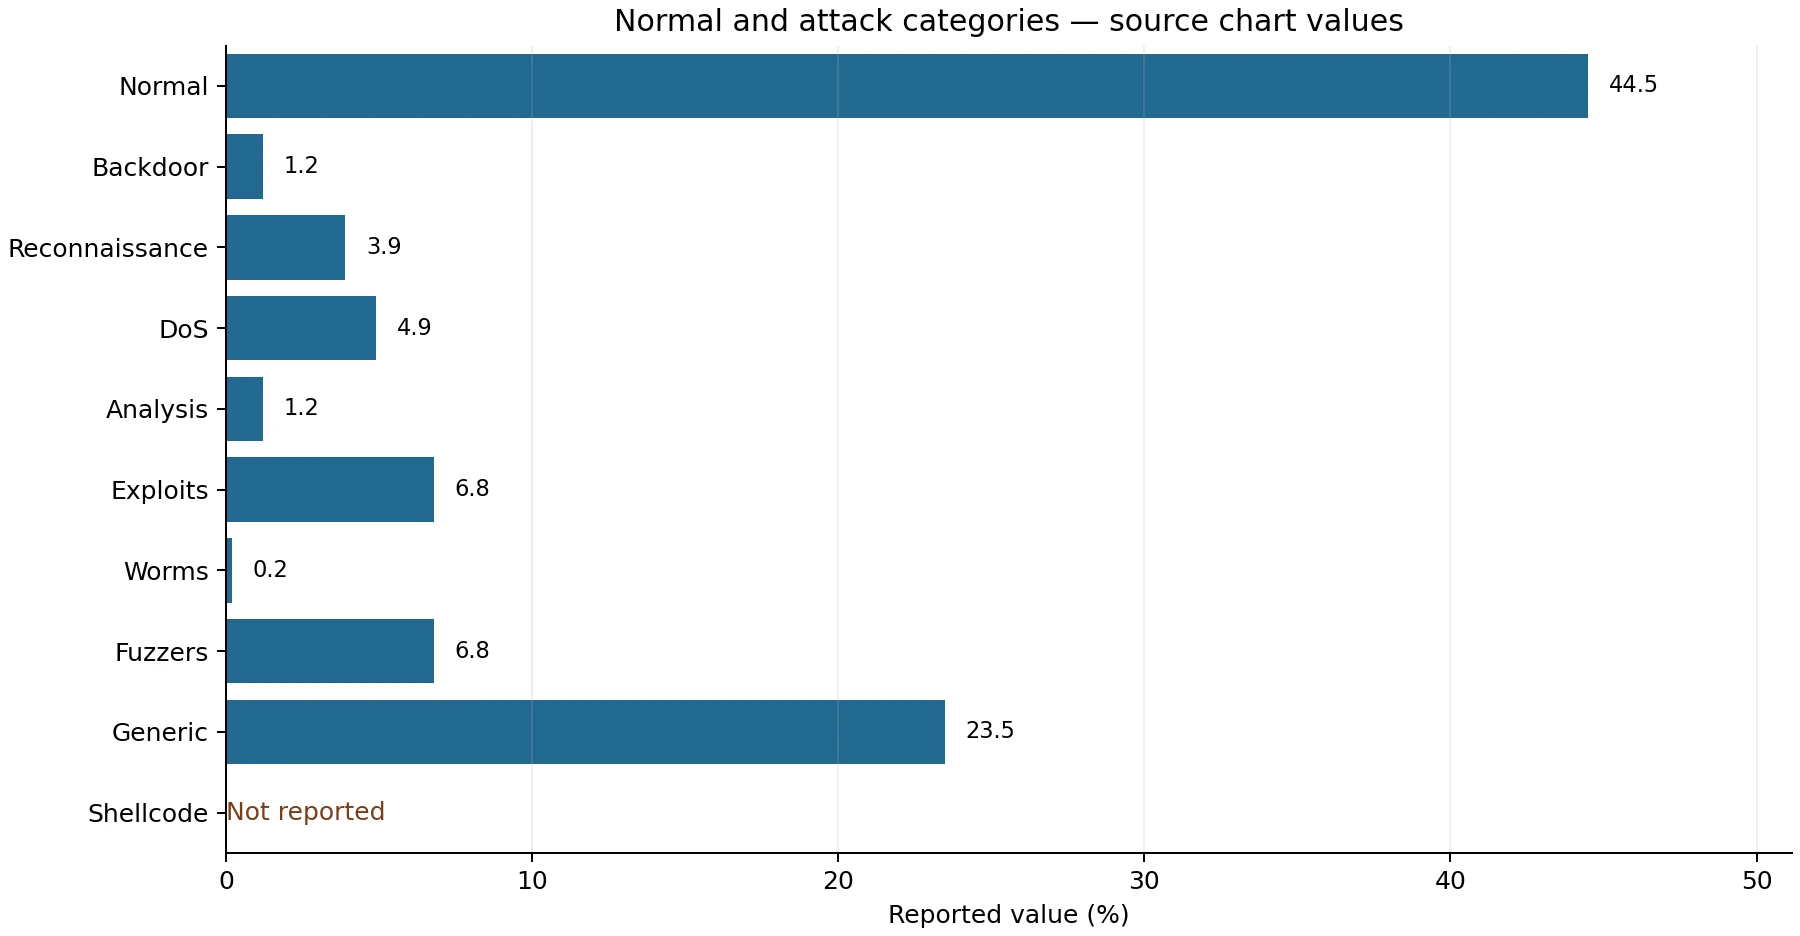
Figure 2: Analysis of distribution of attack and normal data
Exploits
In operating systems, vulnerabilities such as targeting and compromising are achieving the exploits attacks. In a network, potential vulnerability is detected, To automate these attacks, the exploit software can be need.
Fuzzers
To trigger a failure of network or to crash important servers on a network, ‘Fuzz’ is a massive amount of randomized data used by attack an attempt made.
Generic Attacks
By the cryptographic principles depending upon the ciphers, an attack on the secret key is a collision attack which is made. To stream, block and message authentication code ciphers, this generic analysis is applied. Collision attack is denoted by denoted by this, maximum of these families is allowing to birthday attack. Between the random attack attempts, the attack based on the higher likelihood of collisions found.
Reconnaissance
Any public network’s preliminary information of target host is collected by this method and the exploit technique is using this by leveraging the gathered information to penetrate target host or networks.
Shellcode
This method uses a small piece of code as a payload of an exploit, and is a sub method of exploit. To victim’s computer, the malicious code is injected into an active application, compromise and gain remote access
Worms
This method is quickly affecting a larger network and its is called as malicious attack and open out through the network propagation. In distributed attacks via the formation of botnets, affect the computers and changed them into zombie or botnets with the intent of using them.
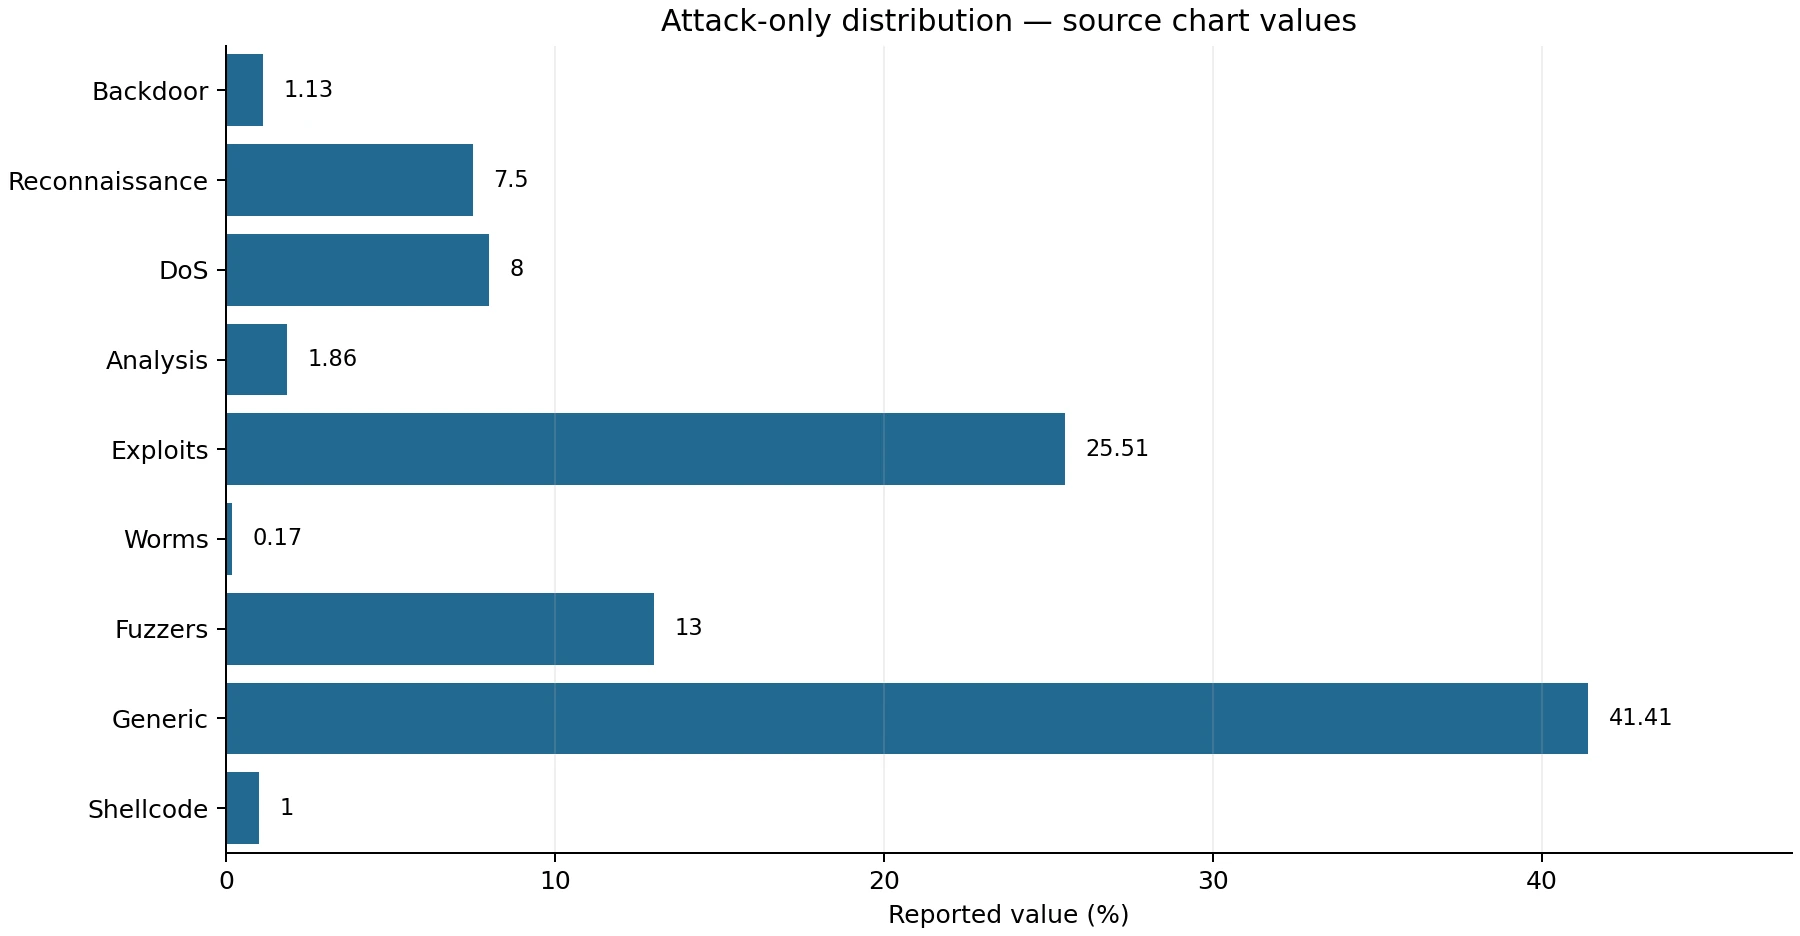
Figure 3 Analysis of Distribution of attack data
Figures 2 and 3 present the distribution information stored with the manuscript. The first chart cache records a value of 44.5 for normal traffic and provides no value for Shellcode; its available values do not form a complete percentage distribution. The attack-only chart contains a separate set of category percentages. These source values are retained separately, and the charts should not be treated as interchangeable descriptions of one normalised sample.
(26)
(27)
(28)
Where, = False Negative,
True Negative = ,
True Positive = ,
False Positive = .
True Positive is the rate of correctly classified records in the given testing dataset out of all records. The ratio of the number of incorrectly classified normal connections are called as False Positive.
The manuscript describes an 80% training and 20% testing split. This is a holdout description; an n-fold cross-validation procedure is not specified.
Implementation
This model as represented for KF MODEL means knowledge flow model on simulation tool representation. This file will be uploading on WEKA tool and get number of attacks on system. For this simulation and implementation classification modified machine learning based parameters optimized algorithm is used for determining number of attacks.
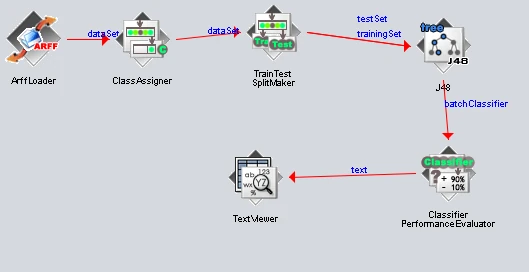
Figure 4 Proposed KF model design on WEKA tool
Machine learning simulation tool- pycharm simulation tool and python language
The manuscript also describes a Python implementation for detecting cross-site scripting (XSS) in web applications. This is distinct from the WEKA network-attack classification workflow. The screenshot is included as implementation evidence, but the manuscript does not supply a separate XSS evaluation protocol that would permit its results to be generalised to all web applications.
Cyber-attacks on network system.
Cross scripting attacks on web application.
These are performing by WEKA and PyCharm simulation tool work done. For using implementation, the decision tree and J48 algorithms are implemented on WEKA tool. The cross-site scripting attacks detection and prevention done by PyCharm simulation tool.
Results and Discussion
Our work mainly discussed with the intrusion detection system based on the Bayesian network classification and with hybrid ensemble learning algorithm. In table 1 shows the accuracy of different techniques such as C4.5, Random Forest, Naive Bayes, SVM, and hybrid ensemble learning algorithm. This hybrid ensemble algorithm contains I-forest, C4.5, J48, Bayesian network classifier, Decision tree.
Table 1 Performance of different techniques
S.No | Techniques | Accuracy (%) |
|---|---|---|
1 | C4.5 | 91.56 % |
2 | Random Forest | 93.67 % |
3 | Naive Bayes | 88.32 % |
4 | SVM | 90 % |
5 | Proposed technique | 99.98 % |
In table 1 analyses the accuracy of the different algorithm such C4.5, Random Forest, Naive Bayes, SVM, and hybrid ensemble learning algorithm. The accuracy of the proposed method is reported as 99.98%, accuracy of SVM is 90% and other algorithms are below that proposed algorithms. With analysing this table our proposed is more accuracy than the other algorithms, and the reported classification performance favours the proposed technique.
Table 2 Analyse the accuracy for different attacks
Attacks | Rate of TP | Rate of FP | F-Measure | Value of Precision | Value of Recall |
|---|---|---|---|---|---|
Normal | 0.89 | 0 | 0.946 | 0.991 | 0.963 |
Analysis | 0.88 | 0 | 0.965 | 0.956 | 0.762 |
Backdoor | 0.92 | 0.006 | 0.985 | 0.852 | 0.6215 |
DoS | 0.996 | 0.003 | 0.998 | 0.6589 | 0.6411 |
Exploits | 0.936 | 0.002 | 0.936 | 0.952 | 0.596 |
Fuzzers | 0.945 | 0 | 1 | 0.6985 | 0.958 |
Generic | 0.993 | 0 | 0.96 | 0.859 | 0.865 |
Reconnaissance | 0.994 | 0.0035 | 0.365 | 0.9614 | 0.6945 |
Shellcode | 0.896 | 0 | 0.542 | 0.965 | 0.569 |
Worms | 0.921 | 0.005 | 0.982 | 0.682 | 0.839 |
Table 2 reports true-positive rates, false-positive rates, F-measures, precision and recall for the normal class and nine attack categories. Figure 5 compares the reported true-positive and false-positive rates across those classes. These class-level points are not a threshold-swept ROC curve, and an area under the ROC curve is not established by this chart.
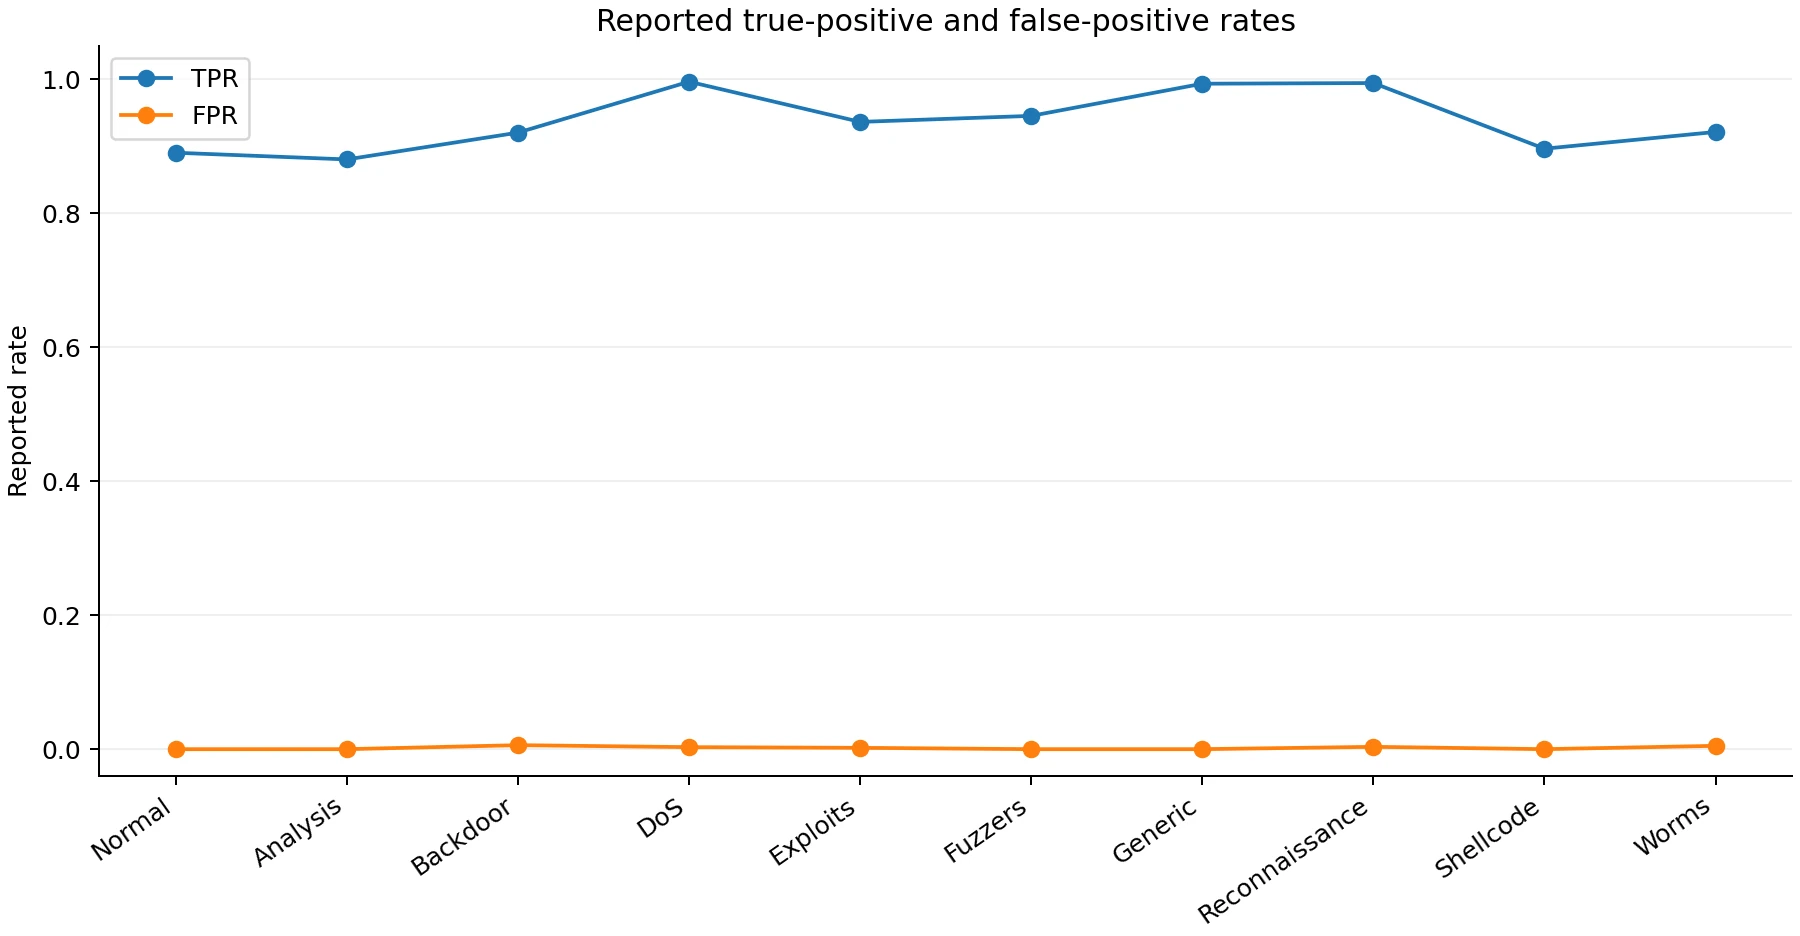
Figure 5: Reported true-positive and false-positive rates by class
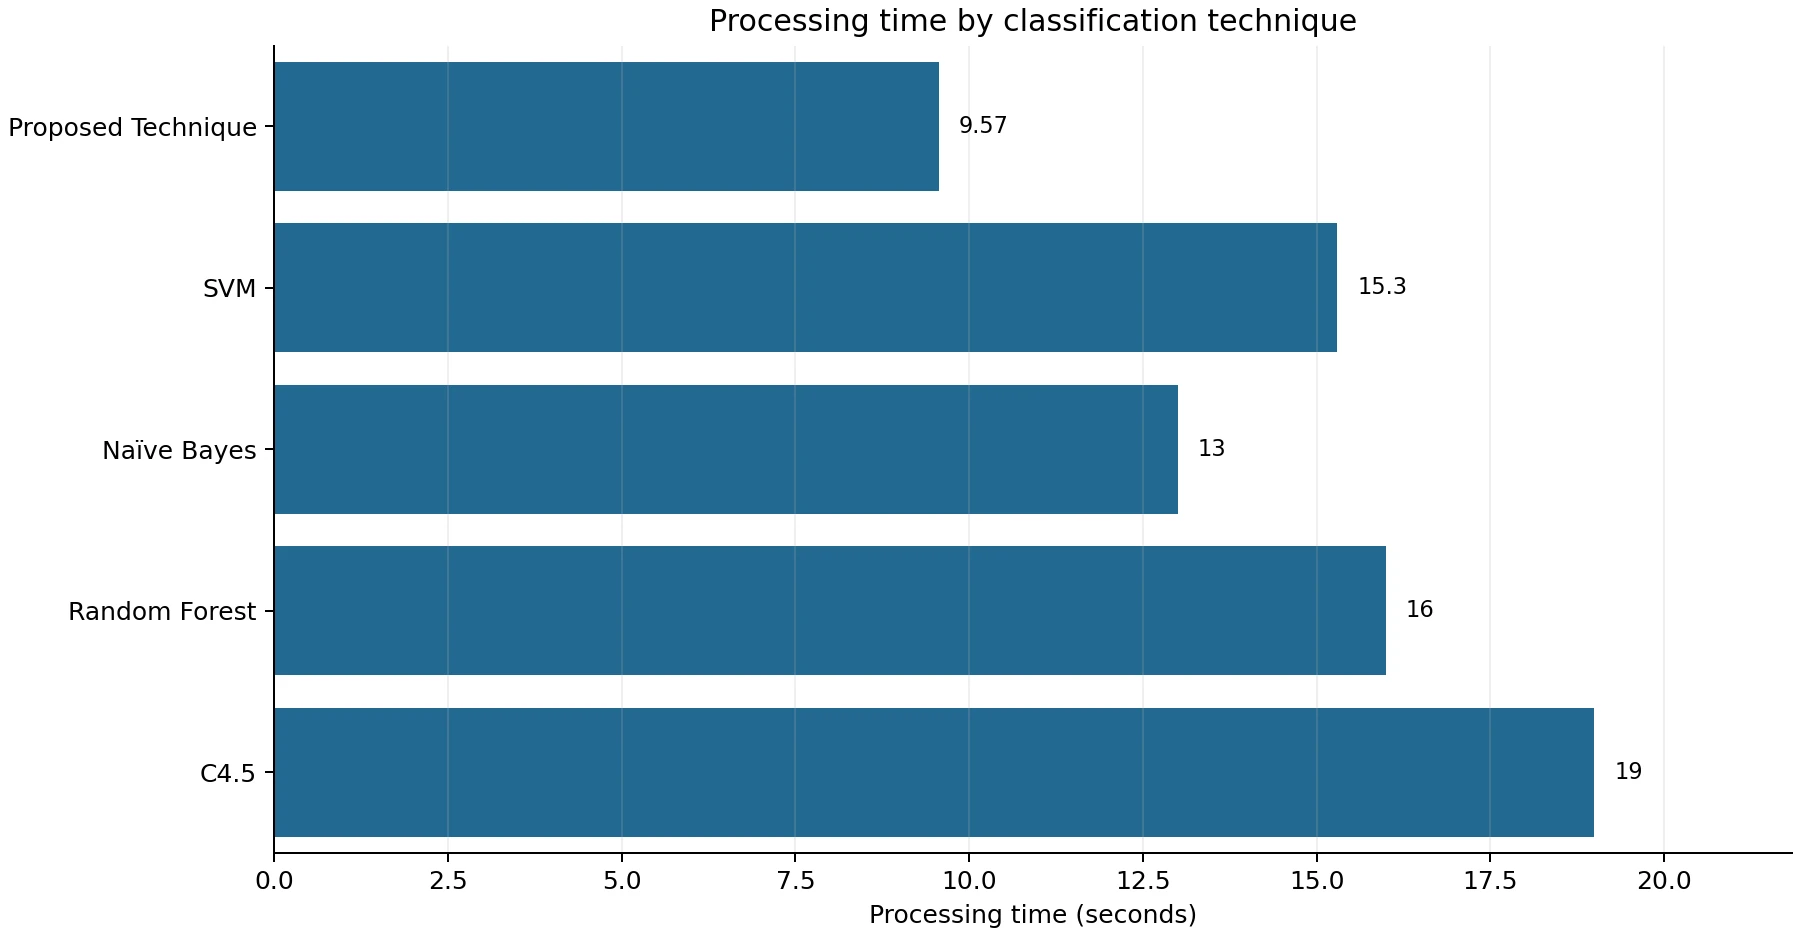
Figure 6: Reported processing time
In our proposed work complete the process in 9.57 seconds other techniques achieved greater than our proposed method. SVM achieve in 15.3 seconds, in 13 seconds Naive bayes achieved. Random forest achieves the performance in 16 seconds and C4.5 in 19 seconds. The results we obtained are shows that our proposed technique is very effective. This experimental process is executed by means of results of normal, DoS, Analysis, Backdoor, Exploits, Reconnaissance, Fuzzers, Worms, Generic, Shellcode and Accuracy calculation. Therefore, various results are determined. Moreover, these obtained result shows the proposed technique has been scored better results than other existing technique. Moreover, the accuracy of this system is very high. In this section, we analyse the results of number of attacks predicted by utilizing WEKA tools. From the experiment, the function and the performance of the proposed system is exploited by means of number of attacks such as, predicted normal, DoS, Reconnaissance, Backdoor, Analysis, Generic, Fuzzers, Worms, Shellcode, Exploits and accuracy based on decision tree – training data set and testing data set. The result of the proposed technique is tabulated in the below section.
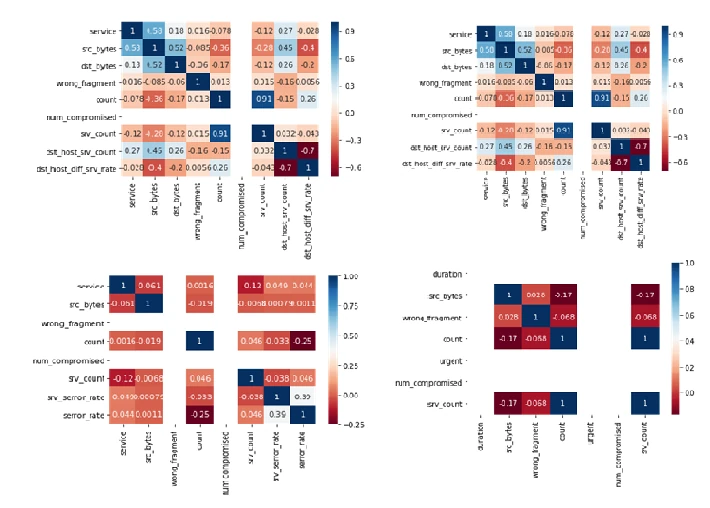
Figure 7: Correlation heatmaps from the Python implementation
The Python screenshot shows correlation heatmaps for selected network features, including duration, service and packet-related variables. These plots describe relationships between features; they are not confusion matrices and do not independently establish classification accuracy. The quantitative performance claims in this paper therefore rely on the reported comparison and class-level tables. Additional implementation details, consistent metric definitions and independently reproducible experiments would strengthen the evaluation.
Conclusion
This study describes an intrusion-detection approach based on Bayesian classification, seagull feature selection and a hybrid ensemble of tree-based and related models. The network-data evaluation uses UNSW-NB15 attack categories. The comparison table reports 99.98% accuracy and a processing time of 9.57 seconds for the proposed technique. The manuscript also presents class-level metrics and implementation screenshots. These results should be interpreted within the reported experimental setting. The exact ensemble integration, the conversion of network records to the described textual feature representation and some evaluation details remain insufficiently specified for independent reproduction. Testing on live traffic and supplying the implementation and configuration details would be necessary before drawing conclusions about operational effectiveness.
References
1. Singh, A.K.; Prasad, N.; Narkhede, N.; Mehta, S. Crime: Classification and Pattern Prediction. Int. Adv. Res. J. Sci. Eng. Technol. 2016, 3, 41–43. [CrossRef]
2. Brar, H.S.; Kumar, G. Cybercrimes: A Proposed Taxonomy and Challenges. J. Comput. Netw. Commun. 2018, 2018, 1–11. [CrossRef]
3. Pete, I.; Chua, Y.T. An Assessment of the Usability of Cybercrime Datasets. In Proceedings of the CSET @ USENIX Security Symposium, Santa Clara, CA, USA, 12 August 2019.
4. Ngo, F.; Jaishankar, K. Commemorating a Decade in Existence of the International Journal of Cyber Criminology: A Research Agenda to Advance the Scholarship on Cyber Crime. Int. J. Cyber Criminol. 2017, 11, 1–9.
5. Khusna, A.N.; Agustina, I. Implementation of Information Retrieval Using Tf–idf Weighting Method On Detik.Com’s Website. In Proceedings of the 2018 12th International Conference on Telecommunication Systems, Services and Applications (TSSA), Yogyakarta, Indonesia, 4–5 October 2018; pp. 1–4.
6. Zhang, G.Z. Computer Forensics Based on Data Mining. Appl. Mech. Mater. 2014, 536–537, 371–375. [CrossRef]
7. Tsakalidis, George, Kostas Vergidis, Sophia Petridou, and MaroVlachopoulou;A cybercrime incident architecture with adaptive response policy, Computers & Security, Vol. 83, PP.22-37, 2019.
8. Riek, Markus, Rainer Bohme, and Tyler Moore. "Measuring the influence of perceived cybercrime risk on online service avoidance." IEEE Transactions on Dependable and Secure Computing, Vol. 13, No. 2, PP. 261-273, 2015.
9. BHARGAVA, GUDDITI, and M. CHANDINI. "Then and Now: On the Maturity of the Cybercrime Markets.", IEEE Transactions on Emerging Topics in Computing, Vol. 4, No. 1, 2018.
10. Tsakalidis, George, and Kostas Vergidis. "A systematic approach toward description and classification of cybercrime incidents, IEEE Transactions on Systems, Man, and Cybernetics: Systems, Vol. 49, No. 4, PP. 710-729, 2017.
11. Ramirez, Robert, and NazliChoucri, Improving interdisciplinary communication with standardized cyber security terminology: a literature review, IEEE Access, Vol. 4, PP.2216-2243, 2016.
12. Sultana, Nasrin, Naveen Chilamkurti, Wei Peng, and RabeiAlhadad, Survey on SDN based network intrusion detection system using machine learning approaches." Peer-to-Peer Networking and Applications, Vol. 12, No. 2, PP.493-501, 2019.
13. Karie, Nickson M., Victor R. Kebande, and H. S. Venter, Diverging deep learning cognitive computing techniques into cyber forensics, Forensic Science International: Synergy, Vol. 1, PP.61-67, 2019.
14. Torres, Javier Martínez, Carla Iglesias Comesaña, and Paulino J. García-Nieto, Machine learning techniques applied to cybersecurity, International Journal of Machine Learning and Cybernetics, Vol. 10, No. 10, PP. 2823-2836, 2019.
15. Shi, Yong, Gong Chen, and Juntao Li, Malicious domain name detection based on extreme machine learning, Neural Processing Letters, Vol. 48, No. 3, PP. 1347-1357, 2018.
16. An, Jungkook, and Hee-Woong Kim, A data analytics approach to the cybercrime underground economy, Ieee Access, Vol. 6, PP. 26636-26652, 2018.
17. Noor, Umara, Zahid Anwar, TehminaAmjad, and Kim-Kwang Raymond Choo, A machine learning-based FinTech cyber threat attribution framework using high-level indicators of compromise." Future Generation Computer Systems, Vol. 96, PP.227-242, 2019.
18. Choraś, Michał, and RafałKozik,”Machine learning techniques applied to detect cyber-attacks on web applications”, Logic Journal of the IGPL, Vol. 23, No. 1, PP.45-56, 2015.
19. Ogidan, Ezekiel T., KamilDimililer, and YoneyKirsal-Ever, Machine learning for cyber security frameworks: a review, In Drones in Smart-Cities, Vol.1, PP. 27-36, 2020.
20. Wu, Zhe, Scarlett Chen, David Rincon, and Panagiotis D. Christofides, “Post cyber-attack state reconstruction for nonlinear processes using machine learning”, Chemical Engineering Research and Design, 2020.
21. Ferrag, Mohamed Amine, LeandrosMaglaras, Sotiris Moschoyiannis, and HelgeJanicke,”Deep learning for cyber security intrusion detection: Approaches, datasets, and comparative study”, Journal of Information Security and Applications, Vol. 50, PP. 102419, 2020.
22. Katzir, Ziv, and Yuval Elovici, “Quantifying the resilience of machine learning classifiers used for cyber security”, Expert Systems with Applications, Vol. 92, PP. 419-429, 2020.
23.Baykara, M. and Gürel, Z.Z., 2018, March. Detection of phishing attacks. In 2018 6th International Symposium on Digital Forensic and Security (ISDFS) (pp. 1-5). IEEE.
24. Sudha, T.S. and Rupa, C., 2019, March. Analysis and Evaluation of Integrated Cyber Crime Offences. In 2019 Innovations in Power and Advanced Computing Technologies (i-PACT) (Vol. 1, pp. 1-6). IEEE.
25. An, J. and Kim, H.W., 2018. A data analytics approach to the cybercrime underground economy. Ieee Access, 6, pp.26636-26652.
26. O’Donovan, Peter, Colm Gallagher, Kevin Leahy, and Dominic TJ O’Sullivan, A comparison of fog and cloud computing cyber-physical interfaces for Industry 4.0 real-time embedded machine learning engineering applications, Computers in Industry, Vol.110, PP. 12-35, 2019.
27. Wang, Defu, Xiaojuan Wang, Yong Zhang, and Lei Jin, Detection of power grid disturbances and cyber-attacks based on machine learning, Journal of Information Security and Applications, Vol. 46, PP. 42-52, 2019.
28. Gunduz, MuhammedZekeriya, and Resul Das, Cyber-security on smart grid: Threats and potential solutionsComputer Networks, Vol. 169, PP. 107094, 2020.
29. Wu, H.; Yuan, N. An Improved TF–IDF algorithm based on word frequency distribution information and category distribution information. In Proceedings of the 3rd International Conference on Intelligent Information Processing, Guilin, Chin, 4–6 May 2018; pp. 211–215.
30.Zheng, M.; Robbins, H.; Chai, Z.; Thapa, P.; Moore, T. Cybersecurity Research Datasets: Taxonomy and Empirical Analysis. In Proceedings of the International Conference on Cyber Security Experimentation and Test, Baltimore, MD, USA, 13 August 2018.
31. Wang, C.; Yang, B.; Luo, J. Identity Theft Detection in Mobile Social Networks Using Behavioral Semantics. In Proceedings of the 2017 IEEE International Conference on Smart Computing (SMARTCOMP), Hong Kong, China, 29–31 May 2017; pp. 1–3.
32. Zhijun, L.; Ning, W. A Cyber Crime Investigation Model Based on Case Characteristics. In Proceedings of the 2017 4th International Conference on Information Science and Control Engineering (ICISCE), Changsha, China, 21–23 July 2017; pp. 11–15.
33. Delamaire, L.; Abdou, H.; Pointon, J. Credit Card fraud and Detection techniques: A review. Banks Bank Syst. 2009, 4, 57–68.
34. Roul, R.K.; Sahoo, J.K.; Arora, K. Modified TF–IDF Term Weighting Strategies for Text Categorization. In Proceedings of the 2017 14th IEEE India Council International Conference (INDICON), Roorkee, India, 15–17 December 2017; pp. 1–6
35. Sonawane, T.R.; Al-Shaikh, S.; Shinde, R.; Shaikh, S.; Sayyad, A.G. Crime Pattern Analysis Visualization and Prediction using Data Mining. Int. J. Adv. Res. Innov. Ideas Educ. 2015, 1, 681–686
36. Williams, M.L.; Burnap, P.; Sloan, L. Crime Sensing With Big Data: The Affordances and Limitations of Using Open-source Communications to Estimate Crime Patterns. Br. J. Criminol. 2016, 57, 320–340. [CrossRef]
37. Chen, H.; Chung, W.; Xu, J.J.; Wang, G.; Qin, Y.; Chau, M. Crime data mining: A general framework and some examples. Computer 2004, 37, 50–56. [CrossRef]
38. G. Dhiman and V. Kumar, ‘‘Seagull optimization algorithm: Theory and its applications for large-scale industrial engineering problems,’’ Knowl.- Based Syst., vol. 165, pp. 169–196, Feb. 2018.
39. Jia, H., Xing, Z. and Song, W., 2019. A new hybrid seagull optimization algorithm for feature selection. IEEE access, 7, pp.49614-49631.
40. Chen, C.M., Guan, D.J. and Su, Q.K., 2014. Feature set identification for detecting suspicious URLs using Bayesian classification in social networks. Information Sciences, 289, pp.133-147.
41. Öztürk, Z., Pekkaya, M. and Temli, M., 2020. Evaluation of Cybercrime Economy via MCDM and Decision Tree Approaches: The Case of Zonguldak. In Digital Business Strategies in Blockchain Ecosystems (pp. 521-554). Springer, Cham.
42. Priya, A. and Meenakshi, E., 2017, May. Detection of phishing websites using C4. 5 data mining algorithm. In 2017 2nd IEEE International Conference on Recent Trends in Electronics, Information & Communication Technology (RTEICT) (pp. 1468-1472). IEEE.
43. Bagui, S., Kalaimannan, E., Bagui, S., Nandi, D. and Pinto, A., 2019. Using machine learning techniques to identify rare cyber‐attacks on the UNSW‐NB15 dataset. Security and Privacy, 2(6), p.e91.
Cite This Work
To export a reference to this article please select a referencing stye below:

Academic Master Education Team is a group of academic editors and subject specialists responsible for producing structured, research-backed essays across multiple disciplines. Each article is developed following Academic Master’s Editorial Policy and supported by credible academic references. The team ensures clarity, citation accuracy, and adherence to ethical academic writing standards
Content reviewed under Academic Master Editorial Policy.



