Abstract
Advancements in genetic research have opened up new avenues for understanding and predicting genetic disorders. This study presents a comprehensive pipeline for gene-based disease prediction, leveraging big data and deep learning techniques. The study employs Apache Hadoop-based big data handling to efficiently process and manage the voluminous and intricate genetic datasets. The collected genetic data then undergoes meticulous pre-processing, which involves crucial steps such as data cleaning, standardization, and normalization. These processes are essential to maintain data integrity and consistency. The result is a refined pre-processed dataset that serves as the foundation for subsequent analysis. Feature extraction techniques are subsequently applied to pre-processed data. The Self-improved Genetic Algorithm with Optimization (SA-GAO) technique is then deployed for feature selection. The pinnacle of this research lies in gene-disease prediction, where the selected features are utilized for training a hybrid deep-learning model. This model combines a Convolutional Neural Network (CNN) and a Recurrent Neural Network (RNN), enabling the comprehensive capture of spatial and sequential patterns inherent in the genetic data. Subsequently, a weighted mean is calculated from the model’s outputs, providing an accurate and holistic prediction of gene-based diseases.
Introduction
Big data encompasses vast datasets unmanageable by traditional applications. Processing begins with raw, challenging-to-store data not suited for a single machine. In today’s competitive business landscape, enterprises leveraging big data analysis gain a strategic edge. By harnessing and analyzing big data deliberately, they unlock opportunities for improved business outcomes and faster problem-solving. Digitization has led to extensive data generation in healthcare, manufacturing, sales, IoT devices, the web, and various organizational sectors [1]. Leveraging extensive data in healthcare contrasts with VPH researchers’ goal of creating personalized mechanistic models for patients [2]. The rapid evolution of the Internet has ushered healthcare into the era of extensive big data utilization and integration [3]. Utilizing EHR data for predictive modelling in personalized medicine aims to enhance healthcare yet often discards valuable patient information [4]. In the biomedical and health informatics realm, integrating diverse data sources, structured and unstructured, enriches personalized information across genomics, proteomics, imaging, clinical data, and continuous physiological monitoring [5].
DeepCare, an all-encompassing dynamic neural network, interprets medical records, retains past health data, deduces current health status, and forecasts future medical conditions [6]. Health-CPS is a patient-focused cyber-physical system that leverages cloud infrastructure and big data analytics for advanced healthcare applications and services [7]. Deep learning stands as the cutting-edge cornerstone among these tools, driving notable advancements in accuracy and performance [8]. Leveraging digital tech, statistics, data platforms, and integration enhances disease diagnosis and treatment in clinical research and aids epidemiologists in tracing infection sources, like identifying Zero Patients during epidemics [9]and focused on deep learning in biomedicine, beginning with the evolution of artificial neural networks and deep learning techniques [10].
By current security and privacy concerns in healthcare’s big data realm and explored potential solutions to mitigate these challenges [11]. Existing CXR diagnostics fall short of clinical standards, driving the demand for artificial intelligence to enhance CXR diagnostic accuracy [12]. Recent publications and medical reports select inputs and targets, aiming to create a dependable Artificial Neural Network for addressing challenges [13]. It highlights the current status and emerging trends in MBD, offering medical professionals an in-depth view of its state-of-the-art [14]. Explored the advantages of big data analytics across IT infrastructure, operations, organization, management, and strategic domains [15].
In the context of gene-disease prediction, the handling of big data is a pivotal aspect of this study. With the vast amount of genetic information available, efficient and effective data management is essential. Big data handling, in this case, involves the utilization of advanced technologies, such as Apache Hadoop, to manage, store, and process extensive genetic datasets. Genetic data can be massive and complex, consisting of a multitude of data points and variables. Apache Hadoop, as a distributed data processing framework, plays a crucial role in ensuring that this data is efficiently stored, accessed, and analyzed. It operates across multiple nodes, allowing for parallel processing and scalability, thus accelerating subsequent analysis. In summary, big data handling in this study ensures that the genetic data is managed effectively, enabling researchers to harness its full potential for accurate gene-disease prediction.
Organization of the article: Section II provides background information on the genetic context and the data sources used in the study. It describes the genetic datasets and their relevance to disease prediction. Section III elaborates on the methodology employed, encompassing data pre-processing, feature extraction, feature selection using the Self-improved GAO technique, and the development of the hybrid deep learning model comprising CNN and RNN components. Section IV presents a comprehensive account of the research’s findings, including the performance of the gene-disease prediction model. It also engages in discussions on the implications and significance of the results. Section V provides a concluding summary of the study, emphasizing the major contributions and their potential impact on gene-based disease prediction. It also discusses future directions and areas for further research in the field.
Literature Review
In 2019, Yadav and Jadhav et al. [16] investigated the application of a convolutional neural network-based algorithm to classify pneumonia in a chest X-ray dataset. Three techniques were experimentally evaluated, including a linear support vector machine classifier with local rotation and orientation-free features, transfer learning on two CNN models (VGG16 and InceptionV3), and training a capsule network from scratch. Data augmentation was applied as a preprocessing method for all three approaches, with the need for extensive computational resources for training the capsule network from scratch, which could be a limiting factor in real-world applications.
In 2019, Li et al. [17] proposed by beginning with recent accomplishments in bioinformatics, identified problems apt for deep learning and explained deep learning, from shallow neural networks to renowned models like convolutional and recurrent neural networks, graph neural networks, generative adversarial networks, variational autoencoders, and cutting-edge architectures, there was a need for substantial data and computational resources for training advanced models.
In 2015, Najafabadi et al. [18] used Deep Learning to tackle critical issues in Big Data Analytics, such as extracting intricate patterns from vast data volumes, semantic indexing, data tagging, swift information retrieval, and streamlining discriminative tasks. Challenges included handling streaming and high-dimensional data, ensuring model scalability, and enabling distributed computing and the substantial computational resources required for these endeavours.
In 2019, Ting et al. [19] described the prevailing global burden of eye diseases, identified clinical unmet needs, and highlighted common ophthalmic conditions suitable for AI and DL systems. It explored the technical and clinical aspects of constructing DL systems to bridge these gaps, along with potential challenges in their clinical integration.
In 2018, Mahmud et al. [20] proposed the factors that enabled the amalgamation of learning techniques to enhance the machine’s ability to interpret complex patterns in biological data. To promote broader adoption and serve as a community reference, the article provided a comprehensive survey of technique usability across various biological data types and conducted comparative performance assessments of different DL techniques on diverse application domains. A challenge observed was the need for extensive data for robust model training.
In 2016, Deng et al. [21] introduced a novel approach where an efficient kNN classification method involved initial k-means clustering to partition the dataset. Subsequently, kNNaassification was performed for each partition. This method bifurcated the conventional kNN process into training and testing phases, offering an innovative solution for improved classification tasks.
In 2020, Amyar et al. [22] introduced an automated classification segmentation tool for aiding in COVID-19 pneumonia screening via chest CT dataset. It focused on segmenting lesions to evaluate pneumonia severity and patient follow-up. The research proposed a multitask deep learning model that effectively identified COVID-19 patients and segmented COVID-19 lesions from chest CT data, offering a valuable diagnostic and monitoring tool.
In 2018, Manogaran et al. [23] introduced a novel architecture for implementing IoT to store and process scalable sensor data (big data) in healthcare applications. The architecture comprised two key sub-architectures: Meta Fog redirection and Grouping and Choosing architecture. The MF-R architecture used big data technologies like Apache Pig and Apache HBase to collect and store sensor data from various sensor devices.
In 2018, Wang et al. [24] introduced critical elements and value chains for comprehensive big data-enabled transformation. A limitation was the reliance on secondary data; improving the BDET model’s validity might involve gathering and analyzing primary data from a larger sample of healthcare organizations. Quantitative analysis methods could offer insights by quantifying correlations and relationships, though they require a valid scale for big data analytics capabilities.
In 2017, Manogaran et al. [25] introduced a secure Industrial Internet of Things (IoT) architecture for storing and processing scalable sensor data in healthcare applications. The proposed Meta Cloud-Redirection (MC-R) architecture, integrated with a big data knowledge system, collected and stored sensor data generated by various devices. Sensor medical devices were affixed to patients’ bodies to gather clinical measurements.
1.1 Problem Statement
Table 1: Overview of Aim and drawback of the previous research
| Author | Method | Aim | Drawback |
| Li et al. [17] | Deep learning | Explore deep learning in bioinformatics, its applications, and its role in the big data era. | A potential need for extensive computational resources to train deep learning models on large-scale biological datasets. |
| Najafabadi et al. [18] | Deep Learning | To Investigate deep learning applications in big data analytics. | Challenges may include data scalability and the need for substantial computational resources for training deep models. |
| Ting et al. [19] | AI | Providing customized healthcare solutions tailored to individuals worldwide . | Not included predictive algorithms for improved patient stratification across risk groups and treatment categories. |
| Deng et al. [21] | KNN | Create an efficient kNN classification algorithm for big data. | Large datasets may require extensive computational resources and memory. |
Methodology
The field of medical research and healthcare has witnessed a significant transformation with the advent of big data technologies. One area where this transformation is particularly evident is in the classification and diagnosis of genetic diseases. Genetic diseases are often complex and can be challenging to diagnose accurately. However, the availability of massive datasets containing genetic information, coupled with advanced data analytics techniques, has opened up new avenues for researchers and clinicians to enhance disease classification.
Data Acquisition: The initial step involves the collection of data denoted as.
Apache Hadoop based big data Handling: With the collected data in hand, the next phase involves big data handling using Hadoop-based technologies. Hadoop is a distributed data processing framework that allows for the efficient storage and processing of large datasets. This phase is essential because genetic data can be massive and complex. Hadoop’s distributed architecture ensures that the data can be stored, accessed, and processed efficiently across multiple nodes, thus speeding up subsequent analysis.
Pre-Processing: After big data handling, the collected data undergoes a pre-processing stage. This stage involves several critical processes, including data cleaning, standardization, and normalization. Data cleaning aims to remove any errors or inconsistencies in the dataset, such as missing values or duplicate records. Standardization ensures that data is represented in a consistent format, while normalization scales data to a common range. The outcome of this phase is the pre-processed dataset, which is designated as.
Feature Extraction: From the normalized pre-processed dataset, a range of features is extracted. These features encompass statistical features, denoted including mean, median, min-max values, and standard deviation. Additionally, higher-order statistical features like skewness and variance are derived from the normalized dataset.
Feature Selection: The extracted features are subjected to a feature selection process wherein the Self-improved GAO technique is utilized. The chosen features resulting from this process are labelled as.
Gene disease Prediction: The final phase involves the prediction of gene-disease. This prediction is facilitated using the optimal features which are employed to train a hybrid deep-learning model. This deep-learning model is composed of two primary components: a CNN [27] and an RNN [28]. Upon training these two components, a weighted mean is calculated from their outputs, resulting in a comprehensive prediction of gene-disease.
3.1 Data Handling using Hadoop
3.1.1 Data Handling using Apache Hadoop
Apache Hadoop was used to effectively handle massive amounts of data. In this work, Apache Hadoop is used to handle big data. In a distributed computing environment, this facilitates the processing and analysis of massive datasets. The Hadoop open-source software architecture, which is highly well-liked and practical, offers distributed storage, including the capacity to store a lot of massive datasets across clusters. Its architecture allows it to expand from a single server to hundreds of nodes. Hadoop handles massive amounts of data simultaneously and generates quick results. MapReduce and Hadoop Distributed File System (HDFS) are the two main components of Hadoop.
HDFS
HDFS divides the dataset into tiny blocks and stores them on several nodes. Data nodes (worker nodes) and name nodes (master nodes) are the two categories of nodes in HDFS. All actions, including read, write, and delete, are based on these two categories of nodes. The HDFS procedure is similar to the flow shown below:
The name node initially requests access authorization.
Upon approval, the file name will be converted into a list of HDFS block IDs, together with the dataset and data nodes that recorded the blocks associated with that file.
The ID list is then returned to the client, where the users can proceed with their actions depending on it.
MapReduce
Mappers and Reducers are the two components of the computer system known as MapReduce. The mappers are going to utilize the map function to analyse the dataset and convert them into new pairs of key values. After that, the key-value pairs are sorted and divided into different divisions based on their keys. As a local reduction operation that may be acknowledged as an optional component, the combiner enables the forward counting of data with the same key to reduce I/O pressure. The intermediate key-value pairs will then be divided into various portions by partitions and transferred to a reducer. Shuffle is the only operation that MapReduce must implement. Transferring the output data from the appropriate reduction is referred to as a “shuffle.” After the shuffling operation is complete, the reducer launches a few copy threads (Fetcher) and uses HTTP to acquire the output dataset of the map job. The output is then combined into several final datasets, which are subsequently recognised as reducer input data in the following stage. The reducer then processes the data in accordance with the reduced function and returns the result to the HDFS. These data are given to the pre-processing stage to clean the data.
3.2 Pre-Processing
The data obtained undergoes a pre-processing phase that involves a series of steps to ensure its quality and suitability for further analysis.
3.2.1 Data Cleaning
This phase initiates with a crucial step known as data cleaning, an intricate process that carries the responsibility of identifying and rectifying any semblance of inconsistencies, inaccuracies, or irregularities that may have infiltrated the acquired dataset. Through diligent examination and the diligent removal or correction of erroneous entries, this step serves as the guardian of accuracy, ensuring that all subsequent analyses are firmly rooted in trustworthy and precise information.
3.2.2 Data Standardization
Progressing onwards, the pre-processing stage incorporates the critical process of data standardization. In this step, the focus is on harmonizing the diverse values within the dataset to adhere to a uniform scale or format. This harmonization becomes especially crucial when grappling with data procured from different sources or characterized by disparate measurement units. By carefully enforcing a realm of consistency, the data transforms its initial disparities, thus rendering it more conducive to meaningful comparisons and comprehensive analysis.
3.2.3 Data Normalization
Stepping into the next stride of the pre-processing stage, we encounter the crucial phenomenon of data normalization. This process entails the profound transformation of data onto a shared scale, often within the confines of a range spanning from 0 to 1. This normalization endeavour is exactly crafted, considering the distribution and scope of the data. The ultimate goal of this phase is to foster equitable comparisons amongst variables that exhibit diverse magnitudes, effectively curbing any disproportionate influence that a solitary variable may exert upon the subsequent analyses.
Collectively, these pre-processing steps—data cleaning, data standardization, and data normalization—play an instrumental role in refining the acquired dataset. By enhancing data quality, consistency, and compatibility, this phase prepares the data for extraction of meaningful features, optimal feature selection, and the subsequent prediction of gene-disease.
3.3 Feature Extraction
3.3.1 Statistical Features
Mean: The mean value is calculated by taking the average of all values in the pre-processed dataset, denoted as. This can be either a mean for a sample or an entire population.
Here, N represents the total number of observations and refers to the pre-processed data.
Median: The median is the middle value of the data when it’s arranged in ascending order after pre-processing.
The median divides the data into two halves, with an equal number of values above and below it.
Standard deviation: The standard deviation is the square root of the variance. It quantifies the extent of variation in the pre-processed dataset, and it’s expressed in the same units as the original data. Both the population and sample standard deviations are calculated using the square root of the variance.
Here, it represents the pre-processed data and is the mean value. The standard deviation provides insight into the dispersion of values about the mean.
3.3.2 Higher-Order Statistical Features
Skewness: Skewness is a measure used to assess the asymmetry of the distribution. If a distribution is asymmetric, its left and right sides are not mirror images of each other. The skewness of a distribution can take various forms: zero, right (or positive), left (or negative), or a combination.
Where is the mean value of, is the median value of, and represents the standard deviation. Skewness quantifies the degree and direction of the asymmetry in the distribution.
Variance: Variance is a statistical measure that assesses the extent of numerical variability within the dataset. It indicates how much each value in the collection deviates from the mean (average) and each other.
Here, represents individual values in the dataset, μ is the mean value of, and is the total number of observations. Variance provides insight into the spread and dispersion of the data points around the mean, highlighting the level of variability present in the dataset.
3.4 Feature selection
The extracted features are subject to a feature selection process, which uses self-improving GAO techniques. This section explains the inspiration and theory behind the GAO method for optimization tasks and its mathematical model.
3.4.1 GAO inspiration
The green anaconda (Eunectes murinus) is a South American boa species, also known as the common anaconda, giant anaconda, common water boa, or secure. As a non-venomous constrictor, it’s one of the largest and heaviest snakes globally, often reaching lengths of up to 5.21 meters. Females are generally larger, around 4.6 meters on average, compared to males at about 3 meters. Their weight ranges between 30 and 70 kilograms. Recognizable by their green colour and black blotches, they have a narrower head with orange-yellow stripes and flexible jaws, enabling them to swallow prey larger than their head. Green anacondas mainly prey on fish, birds, reptiles, and mammals, employing a hunting strategy that involves ambushing and constricting their prey. They are aquatic creatures, swift swimmers in water, and slower on land. During mating, males track females using pheromones and chemical cues. Their mating behaviour and hunting tactics are pivotal aspects modelled in the proposed GAO approach.
3.4.2 Initialization
The GOA algorithm is a population-based metaheuristic utilizing green anacondas as its population members. Mathematically, each anaconda represents a candidate solution, with its position in the search space dictating decision variable values. Thus, a vector models each anaconda, and a matrix represents the population of these vectors.
Here, represents the population matrix in the GAO context, with signifying the 𝑖-th green anaconda, representing a candidate solution. In this context, it stands for its value along the 𝑑-th dimension in the search space, which pertains to a decision variable. Notably, denotes the count of green anacondas, represents the number of decision variables, and symbolizes random values falling within the [0,1] interval. Additionally, and refer to the lower and upper bounds of the 𝑑-th decision variable, respectively.
For each suggested set of values assigned to the decision variables of a green anaconda, the problem’s objective function is computed. The resulting set of objective function values can be mathematically expressed as a vector.
By contrasting the computed objective function values, the member associated with the most favourable objective function value is recognized as the best candidate solution. Given that the positions of the green anacondas, and consequently the objective function values, are updated in each GAO iteration, the optimal member—representing the best solution—needs to be continually updated as well.
3.4.3 GAO Mathematical Modeling
Within the GAO design, the updates to the positions of green anacondas in the search space are conducted through a simulation of green anaconda behaviour. This simulation occurs in two distinct phases, with the overarching goal of ensuring both exploration and exploitation in the search process.
3.4.3.1 Mating Season (Exploration)
During mating, female green anacondas release pheromones to signal their presence, guiding males toward them. The males detect these cues through their tongues and approach the females. In the first GAO phase, this behaviour inspires the update of anacondas’ positions. Similar to the males’ strategy, anacondas’ positions are significantly shifted, emphasizing exploration for global search and avoiding local optima. In the mathematical simulation, GAO treats superior members of the population as female anacondas for each individual.
In this context, it represents the collection of potential locations for candidate female anacondas corresponding to the individual. Here, it denotes the row index of the green anaconda within the GAO population matrix while also indicating the position in the objective function vector of the element with a superior objective function value compared to the th anaconda.
The movement of green anacondas is notably influenced by the concentration of pheromones. Objective function values have been employed to model this concentration. Consequently, members with better objective function values have an increased likelihood of being chosen by green anacondas.
Here, denotes the probability of pheromone concentration for the -th female about the -th green anaconda. Represents the vector containing the set of objective function values for candidate females representing green anaconda, which signifies its specific-th value. It represents the maximum value within this vector and stands for the number of female candidates for Representative Anaconda.
In the GAO approach, the assumption is that the green anaconda randomly opts for one of the potential candidates and advances in its direction. To model this selection, the initial step involves computing the cumulative probability function of candidate females via Eq.(12). Subsequently, by contrasting this cumulative probability function with a normally distributed random number within the [0,1] range, the chosen female species for the green anaconda is determined.
Where is a function of the cumulative probability of the th candidate female for the th green anaconda, offspring selected for the th green anaconda, and is a random number with a range of distribution [0,1].
Once the selected female species is identified, the subsequent step involves simulating the movement of the green anaconda toward it. This is achieved by calculating a random position within the search space.
In this context, it represents the newly proposed position of the -th green anaconda, originating from the first phase of GAO. For this position, it signifies its value along the 𝑑-th dimension. Corresponds to its objective function value. Denotes random numbers characterized by a normal distribution in the [0,1] range. Stands for the -th dimension of the chosen female for the -th green anaconda. Represents random nuStandsdrawn from the set }. Furthermore, represents the count of green anacondas, and 𝑚 denotes the number of decision variables.
3.4.3.2 Strategy of Hunting (Exploitation)
Green anacondas, as formidable predators, utilize an underwater ambush technique to seize their prey. By striking when the prey halts drinking water or ventures near, they encircle, constrict, and ultimately consume their victim. In GAO’s second phase, population members’ positions are updated to mimic the hunting behaviour of green anacondas. This approach yields minor shifts in positions, emphasizing GAO’s capacity for local search and extracting potential improvements from proximate solutions.
To simulate this strategy, population members’ positions are adjusted towards nearby prey. If the objective function value is enhanced in this new position, updating the anaconda’s location will be deemed viable.
In this context, it represents the newly proposed position of the -th green anaconda, stemming from the second phase of GAO. For this position, it signifies its value along the 𝑑-th dimension. Corresponds to its objective function value. denotes the algorithm’s iteration counter and signifies the maximum number of iterations for the algorithm
3.5 Gene Disease Prediction
In this stage, the focus shifts toward predicting gene-diseasCorrespondsdiction process leverages optimal features, which are utilized to train a hybrid deep-learning model. This model comprises two core components: CNN and RNN. Following the training of these components, their outputs are combined through a weighted mean calculation, culminating in a comprehensive prediction of gene-disease.
3.5.1 Convolutional Neural Network (CNN)
The CNN functions as a multi-layer perceptron neural network and finds application in various tasks such as image classification, object detection, and tracking. The primary purpose of the CNN is to capture image features efficiently and subsequently classify these images using a fully connected layer. The CNN architecture consists of three main components: the convolutional layer, the pooling layer, and the fully connected layer.
Convolution Layer: Within CNN architecture, the convolutional layer is of significant importance. It serves the purpose of reducing the image dimensions while generating a feature map. This layer consists of a set of kernels designed to produce a matrix containing extracted features. These kernels utilize “stride(s)” to traverse the entire input, leading to fractional changes in the dimensions of the output volume. As a result of this striding process, the input volume’s dimensions in the convolutional layer undergo a reduction. The convolution operation is represented as follows,
Here, stands for the number of layers, represents the activation function, signifies the convolutional kernel, is the bias term, stands for the input data, represents the output data.
The purpose of the pooling layer is to reduce data dimensionality by condensing information across stacked layers. By utilizing the pooling layer, distortions in the feature obtained through this process are prevented, thus avoiding overfitting.
3.5.2 Recurrent Neural Network (RNN)
RNNs represent a specific category of Neural Networks (NN) wherein the outcomes from one step serve as inputs for the next. In contrast to conventional NNs, RNNs incorporate a hidden layer that enables them to retain information from preceding steps within a sequence. This concealed state functions as a memory reservoir, storing data pertinent to earlier computations. By utilizing uniform weights and biases for all inputs, RNNs simplify the complexity associated with expanding parameters, reducing the necessity for extensive memorization when compared to other neural network types. Consequently, these three layers can be consolidated into a solitary recurrent layer, with shared strengths and biases across all hidden levels.
Within this model, it signifies the input layer during the time step with the corresponding index. Represents the hidden layer at the time step with the index. Corresponds to the hidden layer during the tRepresentsith the index y. j(t) denotes the output layer aCorrespondsstep with the index. Represents the weight matrix connecting the input to the hidden layer with indices, stands for foRepresentsht matrix linking the previously hidden layer to the current hidden layer with indices and signifies the weight matrix connecting the hidden layer to the output layer with indices and corresponds to the number of input units. Represents the number of hidden units. This is indicative of the number of output units.
The function represents a non-linear function, such as aIsor. To calculate the first hidden state is necessary, and it is commonly initialized with all zero values.
The process of training RNNs bears a resemblance to training traditional neural networks. There exists a subtle distinction due to the shared parameters across all time steps within the network. Backpropagation, the algorithm employed, remains the basis, albeit with a modification. The crux lies in the fact that the gradients at each output not only depend on the current time step calculations but also on those from previous time steps. This phenomenon is termed Backpropagation Through Time (BPTT).
Result and discussion
4.1 Experimental Setup
The presented model was implemented using MATLAB software. An extensive evaluation of the proposed model was conducted utilizing data sources. Within the collected dataset, 80% was designated for training purposes, while the remaining 20% was reserved for testing. The evaluation process encompassed a range of performance metrics, including Accuracy, Precision, Sensitivity, Specificity, F1-score, Negative Predictive Value (NPV), Matthews Correlation Coefficient (MCC), False Positive Rate (FPR), and False Negative Rate (FNR). This comprehensive assessment was carried out by varying the training percentage in performance analysis.
Accuracy: It measures the overall correctness of the model’s prediction
Precision: It quantifies the proportion of true positive (TP) predictions among all positive predictions.
Sensitivity: It evaluates the proportion of actual positives that are correctly predicted as positive by the model.
Specificity: It calculates the proportion of actual negatives that are correctly predicted as negative by the model.
F1_Score: It combines both precision and specificity to provide a balanced measure of model performance.
NPV: It assesses the proportion of actual negatives that are correctly predicted as negative.
MCC: It takes into account true and false positives and negatives and is useful for imbalanced datasets.
FPR: It calculates the proportion of actual negatives that are incorrectly predicted as positive.
FNR: It calculates the proportion of actual positives that are incorrectly predicted as negative.
4.2 Performance analysis
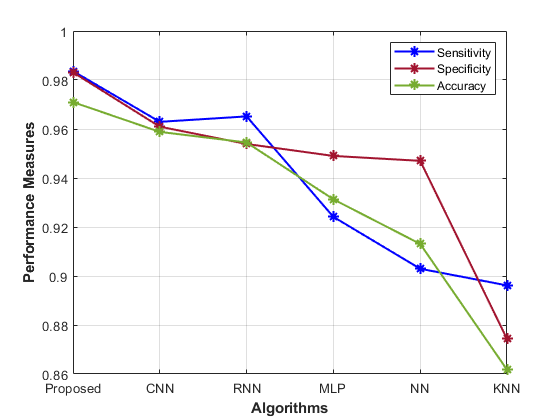
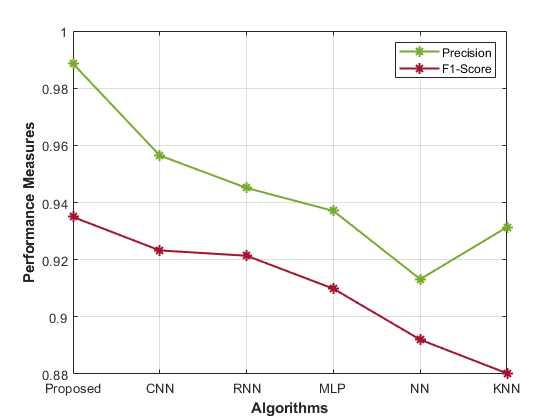
Table 1 presents performance metrics for various models in predicting gene-disease. Each model’s accuracy, precision, sensitivity, specificity, F1-Score, MCC, NPV, FPR, and FNR display the performance analysis of the proposed model.
Table 1: Performance Evaluation of Gene Disease Prediction Models
| Accuracy | Precision | Sensitivity | Specificity | F1-Score | MCC | NPV | FPR | FR | |
| Proposed | 0.98 | 0.99 | 0.98 | 0.97 | 0.93 | 0.99 | 0.95 | 0.02 | 0.00 |
| CNN | 0.96 | 0.96 | 0.96 | 0.96 | 0.92 | 0.96 | 0.92 | 0.02 | 0.00 |
| RNN | 0.97 | 0.95 | 0.95 | 0.95 | 0.92 | 0.96 | 0.91 | 0.02 | 0.00 |
| MLP | 0.92 | 0.94 | 0.95 | 0.93 | 0.91 | 0.93 | 0.88 | 0.03 | 0.01 |
| NN | 0.90 | 0.91 | 0.95 | 0.91 | 0.89 | 0.87 | 0.84 | 0.03 | 0.01 |
| KNN | 0.90 | 0.93 | 0.87 | 0.86 | 0.88 | 0.86 | 0.83 | 0.03 | 0.01 |
The Proposed model achieves high accuracy (0.98) and precision (0.99), signifying its ability to correctly identify susceptible cases. The sensitivity (0.98) and specificity (0.97) demonstrate its balanced recognition of both positive and negative instances. The F1-Score (0.93) indicates good overall performance, while the MCC (0.99) highlights its robustness. Comparatively, the CNN model’s accuracy (0.96) and precision (0.96) are slightly lower than the proposed approach. Similarly, the RNN model also shows similar trends, with an accuracy of 0.97 and a precision of 0.95. Other models, such as MLP, NN, and KNN, exhibit progressively lower accuracy, precision, and overall performance. The Proposed hybrid DL (CNN and RNN) model outperforms other methods in most metrics, showcasing its effectiveness in gene-disease prediction for the Habdat Embankment scenario.
 |  |
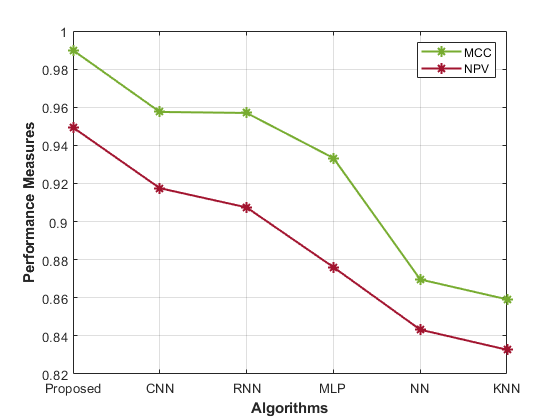 | 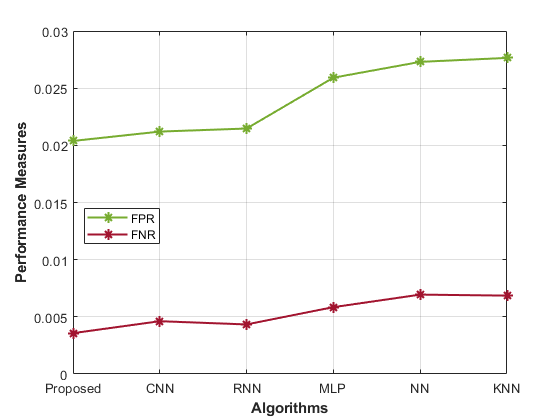 |
| Figure 4: Analysis of the proposed model’s performance | |
Conclusion
In conclusion, this research has introduced a comprehensive framework for gene-based disease prediction that leverages big data technologies and deep learning techniques. Efficient data handling, facilitated by Apache Hadoop, is the linchpin that ensures the processing and management of complex genetic datasets. This fundamental step addresses the challenge of big data and guarantees that the data is ready for meaningful analysis. Pre-processing, encompassing data cleaning, standardization, and normalization, ensures the integrity and quality of the genetic data. Feature extraction techniques, spanning basic and higher-order statistical features, unearth the hidden gems of information concealed within the genetic data. The employment of the Self-improved Genetic Algorithm with Optimization (GAO) technique for feature selection refines the dataset further by spotlighting the most informative features. At the heart of this research lies the innovation of gene-disease prediction. The hybrid deep-learning model, incorporating a Convolutional Neural Network (CNN) and a Recurrent Neural Network (RNN), orchestrates a symphony of analysis. It harmonizes the spatial and sequential patterns inherent in genetic data, culminating in a weighted mean that offers an accurate and comprehensive prediction of gene-based diseases. This integrated approach, seamlessly weaving together big data analytics, feature engineering, and deep learning, represents a transformative shift in gene-disease assessment. It holds the promise of not only improving our understanding of genetic disorders but also revolutionizing personalized medicine. The implications are profound, with the potential to enhance healthcare outcomes, refine treatment strategies, and empower individuals with vital insights into their genetic health. The future of gene-based disease prediction presents exciting opportunities, with a particular emphasis on refining big data handling techniques. The handling of vast and complex genetic datasets is pivotal to advancing precision medicine and enhancing disease predictions. As genetic datasets continue to grow in size and complexity, there is a need for even more scalable big data handling solutions. Future research could explore advanced distributed computing frameworks beyond Hadoop to efficiently manage and analyze these massive datasets. Future big data handling should extend beyond genomics to integrate data from various omics domains, such as transcriptomics, proteomics, and metabolomics. This integration will provide a more comprehensive view of an individual’s health and disease risk.
Cite This Work
To export a reference to this article please select a referencing stye below:

Academic Master Education Team is a group of academic editors and subject specialists responsible for producing structured, research-backed essays across multiple disciplines. Each article is developed following Academic Master’s Editorial Policy and supported by credible academic references. The team ensures clarity, citation accuracy, and adherence to ethical academic writing standards
Content reviewed under Academic Master Editorial Policy.


