
Abstract
The paper will concentrate on educational change in America and how it could be more efficient. The current education system of America has become obsolete compared with the rest of the world. The paper will show a comparison of different surveys used to rank educational systems of the world. It will help us to understand the American education system. This article will analyze the current barriers to change in the American education system.
The paper will suggest a change in the American education system. An action plan would be given to cater to the current need for institutional changes required. The paper will illustrate the facts from different parts of the world to relate to the educational obsolescence of American education. The overview of this study is to introduce a new education system that can compete with the rest of the world. Education is an important aspect of a nation’s growth. The paper would raise the negative effects it leaves on society. The paper will establish the grounds for necessary changes in the education system of America.
Introduction
If we talk about the US educational system, it has been compared to the rest of the world and is considered to be at the intermediate level. Based on the age class, compulsory schooling begins between ages five and eight and ends between ages sixteen and eighteen. The US education system has three different types of schools: public schools, private schools, and home educational programs (Ryan, 2013):
Public schools: Schools can be referred to as government schools. They are based on the public education system. Private schools: These are not government schools. They are funded and run by private school organizations.
Home-based school curriculum: home studies by parents or tutors, with government approval.
Education students were divided into three different levels considering age:
- • Elementary School
- • Upper and lower secondary
- • High School
The Organization for Economic Co-operation and Development (OECD) and international students participate in various evaluations under the Work Program. The survey focuses mainly on math and is done every three years, but it also includes science and reading. In 2012, more than 500,000 students around the world over the age of 15 participated in this evaluation. The results of the assessment placed the United States behind Finland and Korea (OECD, 2015).
Here are some other conclusions of the report:
Spain, Norway, Sweden, Portugal, the Slovak Republic, Russia, Italy, Hungary, Lithuania and the United States performed similarly. Thirteen percent of the students scored at the highest level, or the second-highest level, on the test and were classified as “the best.” In Shanghai, China, fifty percent of students were considered the best. One in four children in the United States did not reach level two on the math competency quizzes. At this level, the educational report stated that students had “began to show students the skills that will be able to participate efficiently and productive in life” (Wilde, 2015).
Discussion
The United States also has some of the best results by region, with Massachusetts, Connecticut, and Florida recording strong performance. Massachusetts, for example, performs above the national average and has shown high-quality performance compared with other education systems.
US spending per student is ranked fifth. Austria, Luxembourg, Norway and Switzerland spend more per student. To put this in context, the US student score, according to the Slovak Republic comparison, involved spending of $53,000, while the United States spends $115,000. Among OECD countries, the PISA report notes that spending more on education does not necessarily predict higher math performance. In comparison with other countries, socio-economic class plays an important role in the United States. Fifteen percent of the differences in US student scores were described by economic and social differences. Finland, Hong Kong, Japan, and Norway have less than 10 percent of this difference due to socioeconomic changes (IAP, 2017).
As defined by the US authorities, “resilient” students are disadvantaged socio-economic students who perform better than expected for their socio-economic class. Typically, 7 percent of students are considered resilient. In Korea, Hong Kong, Macao, China, Shanghai-China, Singapore and Vietnam, thirteen percent of students are in the “resilient” category.
China, Singapore, Japan, Korea and other parts of the world have acquired higher math, reading, and science grades. Finland is often cited as a good example of a school system. However, the country has also experienced moderate declines in some areas.
Parts of China, Singapore, Japan, Korea and Liechtenstein have passed the ranking for mathematics, reading, and science. Finland, often referred to as an example of an excellent school system, continues to function well. However, the country lost 2.8 points for math, 1.7 points for reading and three points for science in “yearly variations in seats,” which are “the average annual PISA scores after the country’s first participation in PISA.” The best annual improvements were in Brazil, Tunisia, Mexico, Turkey and Portugal. Italy, Poland, and Germany have also shown an increase since 2003 (PISA, 2017).
How seriously do we take these recent results? Educators around the world have asked for temperate reactions to PISA scores and questioned how useful the test is. However, this year’s report and the United States’ limited math results are worthy of attention for at least one reason. One study found that the 2011 PISA scores were an economic indicator: a rising score is a good predictor that the country’s economy grows well. At the international level, NCES data also reported that children enjoy reading, but there are still questions about differences among countries.
But what’s important here is that American students’ reading enjoyment is generally low: only 33 percent of girls and 20 percent of males reported enjoying reading. Only children in Russia, Italy, England, and Saudi Arabia had lower rates than US students in enjoying reading. Curiously, US children stated that they were highly “motivated to learn.” This suggests that, since differences are aimed at reading at school, educators need to encourage more children to develop a lifelong interest in reading (IPAC, 2017).
In comparison, 45 percent of men and 44 percent of girls reported enjoying math, showing little gender difference and a rate around the global average. On average, many American students are not interested in math. Less than half reported such interest, but this is equal to or slightly better than in other countries, and there is no major difference between males and females in mathematics. These are the 2011 data; it would be interesting to see if there is a better interest among students before pushing more students into science, technology, math and marketing campaigns.
American teachers were much more likely than those in other countries to say that a reading specialist was always available to help struggling students. American teachers were also less likely to wait and see if a student would grow out of reading problems than teachers in any other country except Australia and the UK (TIMSS, 2017).
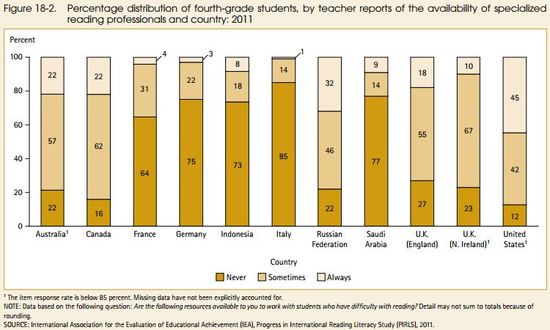
US readers, like teachers in most other industrialized nations, reported that they were very satisfied with their work. However, it is important to realize that the United States experienced one of the greatest declines in teacher job satisfaction among all G-20 countries. From 2006 to 2011, the share of fourth-grade students taught by a “very happy” teacher was reduced by 26 percentage points. The research will be interesting to watch as the discovery of teacher enjoyment can affect the taste for reading among students (PIRLS, 2001).
Action Plan:
Five initiatives could restructure the education system of America. Technology is one of the most important factors. It enhances the learning level of individuals. If technological changes are made, they will increase educational attainment in America. The second aspect of change in the educational paradigm is the wage rate of teachers. The increase in pay rate will motivate the efforts of teachers to work their way toward better learning for students. The infrastructure change will bring a healthy shift in the betterment of education. The curriculum change, however, will be one step ahead toward modern education. The curriculum has to be more advanced and learning-based. Training is the final factor of the action plan. It is to be used to identify weaknesses in teachers and train them accordingly (PIAAC, 2017).
Conclusion And Recommendations
1. Higher wages, fewer classes and less time in the class, with this extra time being used for curriculum training and development. The discipline should come in the form of training with a temporarily reduced class load.
2. Treat teachers differently. They are responsible for each new generation of students and should be considered as some of the most influential individuals in the country. The teaching profession should be considered first class, with higher salaries. Teachers inspire and help students learn quickly rather than only keeping their work through the annual exams. / Travis Ward
3. More freedom for teachers. Hire the best teachers, pay them well and let them teach how they feel fit (trust and moderate supervision).
4. Continuing Education for Teachers. Provide annual workshops/seminars for teachers’ classes. To maintain competitiveness in the world, our teachers are clearly the backbone of education and need to learn new skills for effective dissemination and teaching of young people.
5. Accept the ideas in the book by Ripley, Amanda (and the most intelligent children in the world) and explain why it is harder to be a teacher while trying to reach the profession. Finland and South Korea, despite this, appear in many of the comparisons according to this discussion.
6. Annually update and improve learning. Technological advancements would increase the speed and efficiency of knowledge transfer to individuals. The more technology is used, the greater the chances for practical education for the American people.
Work Cited
Program for International Student Assessment (PISA): This site provides access to publications and data that focus on 15-year-olds’ capabilities in reading literacy, mathematics literacy, and science literacy (2017).
Program for the International Assessment of Adult Competencies (PIAAC): International website: This page provides access to PIAAC reports and data sets, as well as to actual questionnaires and sample tests (2017).
2017, Progress in International Reading Literacy Study (PIRLS): This site features publications and data on the comparative study of the reading literacy of young students.
Trends in the International Mathematics and Science Study (TIMSS): This site provides access to publications and data on the mathematics and science achievement of U.S. 4th- and 8th-grade students (2017).
International Activities Program (IAP): This page provides a compilation of indicators from a multitude of data sources with a rich array of information on the current state of education internationally (2017).
Ryan Julia. American Schools vs. the World: Expensive, Unequal, Bad at Math, (2013). Accessed from https://www.theatlantic.com/education/archive/2013/12/american-schools-vs-the-world-expensive-unequal-bad-at-math/281983/
Wilde Marian. Global grade: How do U.S. students compare? (2015). Accessed from https://www.greatschools.org/gk/articles/u-s-students-compare/
Cite This Work
To export a reference to this article please select a referencing stye below:

Academic Master Education Team is a group of academic editors and subject specialists responsible for producing structured, research-backed essays across multiple disciplines. Each article is developed following Academic Master’s Editorial Policy and supported by credible academic references. The team ensures clarity, citation accuracy, and adherence to ethical academic writing standards
Content reviewed under Academic Master Editorial Policy.





