Abstract
Outbreak analysis involves utilizing data analysis techniques to identify patterns and insights from outbreak data. This analysis can aid in informed decision-making during a pandemic. However, challenges such as limited data availability, the need for real-time analysis, and the complexity of outbreak patterns pose significant problems for effective outbreak analysis. A novel approach to pandemic management is proposed in this research through a three-layer machine learning-based outbreak prediction model. The model consists of pre-processing, feature extraction, feature selection, and outbreak prediction phases, which can aid in effective pandemic management. The first step involves collecting and pre-processing outbreak data, which includes cleaning the data, handling missing values, and formatting it for analysis. The second step involves extracting relevant features from the pre-processed data using techniques such as central tendency and statistical dispersion. The third step involves selecting the most relevant features for outbreak prediction using a hybrid optimization algorithm, such as the Spotted Hyena Optimizer (SHO) and Seagull Optimization Algorithm (SOA), to minimize the risk of overfitting. Finally, a three-layer machine learning approach is employed for outbreak prediction, consisting of an optimized Support Vector Machines (O-SVM) in the first layer with hyperparameters optimized through the hybrid optimization algorithm, a k Nearest Neighbors (KNN) for sequence modelling in the second layer, and XGBoost for prediction in the third layer. The proposed model is implemented using PYTHON.
Keywords- Outbreak Analysis; HSHSA; Machine learning; Support Vector Machines; K-Nearest Neighbors; XGBoost.
1. Introduction
The outbreak of the COVID-19 pandemic has challenged the world in ways that were previously unimaginable. Governments, organizations, and individuals have had to take unprecedented measures to control the spread of the virus, including lockdowns, social distancing, and mass vaccination campaigns [1] [2]. As the pandemic continues to evolve, decision-makers are faced with an increasing need for accurate and timely information to make informed decisions that can help save lives, reduce the impact of the pandemic, and minimize economic and social disruptions. One tool that can help in this regard is outbreak analysis [3] [4]. Outbreak analysis refers to the process of collecting, analyzing, and interpreting data related to the spread and impact of an infectious disease outbreak. The aim of outbreak analysis is to provide decision-makers with the information they need to make informed decisions about how to control the outbreak and mitigate its effects on the population [5] [6]. Outbreak analysis involves the collection, analysis, and interpretation of data related to the spread and impact of an infectious disease outbreak. The data can include information about the number of cases, deaths, hospitalizations, and other relevant factors such as demographic data, transmission patterns, and clinical characteristics of the disease [7] [26].
The aim of outbreak analysis is to provide decision-makers with accurate and timely information that can help them make informed decisions about how to control the outbreak and mitigate its effects on the population. By analyzing the data, decision-makers can identify trends, patterns, and risk factors associated with the outbreak and use this information to develop effective strategies for prevention, treatment, and control [8] [9] [27]. Outbreak analysis is not without its challenges. One of the biggest challenges is the availability and quality of data. In many cases, the data may be incomplete or inaccurate, making it difficult to draw meaningful conclusions from the analysis. Additionally, outbreaks can evolve rapidly, making it challenging to keep up with the latest data and trends. Finally, outbreak analysis can be resource-intensive, requiring significant time, expertise, and resources to collect, analyze, and interpret the data [10] [11].
To address these challenges, decision-makers can take several steps. First, they can invest in improving the quality and availability of data by ensuring that systems are in place to collect and report data in a timely and accurate manner [12]. Second, they can use advanced analytical tools and methods to help identify trends and patterns in the data. Third, they can work closely with public health experts and other stakeholders to develop effective strategies for prevention, treatment, and control. Outbreak analysis has numerous applications in the context of a pandemic. For example, outbreak analysis can help decision-makers identify high-risk populations and areas, track the spread of the disease, and develop effective prevention and control measures. Additionally, outbreak analysis can be used to evaluate the effectiveness of interventions, monitor the impact of the outbreak on the population, and inform resource allocation decisions [13] [14] [28]. In conclusion, outbreak analysis is a critical tool for decision-makers in the context of a pandemic. By collecting, analyzing, and interpreting data related to the spread and impact of an infectious disease outbreak, decision-makers can make informed decisions that can help save lives, reduce the impact of the pandemic, and minimize economic and social disruptions [15] [29]. While outbreak analysis is not without its challenges, decision-makers can take steps to overcome these challenges and use outbreak analysis to its full potential.
The major contribution of this research work is:
To select the most relevant features for outbreak prediction after feature extraction, a hybrid optimization algorithm is utilized. This involves using algorithms such as the Spotted Hyena Optimizer (SHO) and Seagull Optimization Algorithm (SOA). The hybrid optimization algorithm helps to minimize the risk of overfitting while selecting the most appropriate features for outbreak prediction.
A three-layer machine learning approach is utilized to construct a model for outbreak prediction. The first layer involves an optimized Support Vector Machines (O-SVM), followed by a k Nearest Neighbors (KNN) layer for sequence modelling. Finally, the third layer utilizes XGBoost for prediction. Also, the hyperparameter of SVM is optimized using the hybrid optimization algorithm, HSHSA.
The rest of this paper is arranged as: section 2 discusses about the literature works reviews regarding the subject. section 3 talks about the proposed framework. section 4 manifests about the recorded results and this paper are concluded in section 5.
2. Literature Review
In 2021, Leach et al. [16] have highlighted the pandemic’s unfolding the need to examine both structural and unruly processes, reflecting complexity, uncertainty, contingency, and context-specificity. Post-pandemic transformations must be radically transformative, egalitarian, and inclusive, with anticipation and resilience to major shocks at the core.
In 2020, Janssen and Voort [17] have examined the COVID-19 pandemic challenged countries worldwide to be agile and adaptive in their crisis response. This includes decision centralization, timing of policy measures, autonomy of decisions, and balancing change and stability. Adaptivity and agility can complement each other, but may also conflict. Successful adaptive governance requires balancing decision speed with sound analysis, centralized and decentralized decision-making, innovation and bureaucracy, and science and politics.
In 2022, Gamal et al. [18] have proposes an enhanced framework for developing an early warning system for pandemic outbreaks using social network data. The framework comprises three interlinked subsystems that collect, pre-process, and classify data, extract features and train classifiers, and evaluate situational awareness. Factors that affect accurate reporting of SARS-CoV-2 outbreaks, such as limited data collection resources and inconsistent reporting from different sectors, make this framework especially relevant.
In 2022, Islam et al. [19] have described a blockchain-based AI-empowered pandemic situation supervision scheme that uses drones to monitor pandemic outbreaks without much human intervention. The scheme employs two types of drone swarms for different tasks, and a lightweight blockchain and a two-phase security mechanism to validate entities. The use of this scheme is illustrated with a use case based on the COVID-19 pandemic.
In 2021, Castiglione et al. [20] have discussed the potential of IoT in controlling the spread of COVID-19 and proposes a cloud-based framework for real-time identification and monitoring of patients. The framework includes data collection through IoT devices, analysis using machine learning models, and treatment provided by health professionals.
In 2022, Pei et al. [21] have proposed a dynamic allocation strategy of medical resources during epidemics such as COVID-19. A multistage and multi-type medical service network model is established, and a stochastic optimization problem is solved via fluid queueing approximation. Real data from Wuhan is used to validate the proposed algorithm, which maintains a guaranteed service level while keeping the healthcare system operational, even with limited resources.
In 2022, Raj et al. [22] have explores the supply chain challenges faced by manufacturing organizations in emerging economies during and after the COVID-19 pandemic. A conceptual framework based on dynamic capability theory is presented, along with mitigation strategies for ten major challenges identified through literature review and expert discussions. The Grey-DEMATEL method is applied to analyze the relationships between the challenges, and guidelines for addressing them are provided for practitioners and scholars.
In 2021, López et al. [23] have presented a modified SEIR model for predicting the COVID-19 outbreak in Spain and Italy, with a focus on simulating control scenarios and multi-scale epidemics. The model accounts for the spread of infection during the latent period and varying proportions of containment measures. Data is fitted to reported infected populations to account for uncertainties in case reporting. The aim of the model is to evaluate confinement rates and assess scenarios that minimize incidence and mortality during the first stages of the epidemic outbreak.
In 2020, Pantano et al. [24] have examined the impact of the COVID-19 pandemic on retailers, who are facing numerous challenges that require quick adaptation. The authors provide a synthesis of the interventions that retailers have taken in response to the crisis, and offer guidelines and examples for how they can navigate this unprecedented situation from both consumer and managerial perspectives.
In 2021, Pappas and Glyptou [25] have examined the decision-making factors influencing accommodation preferences of 2020 tourists amidst the COVID-19 pandemic, using a sample of 385 Athenian residents and fuzzy-set Qualitative Comparative Analysis. Four solutions were identified: health and safety, price-quality nexus, risk aspects, and quality-related health and safety, with implications for the accommodation industry.
2.1. Problem Statement
The COVID-19 pandemic has underscored the crucial need for accurate and timely information to inform decisions about outbreak control and mitigation [1]. Outbreak analysis is a valuable tool for providing data on disease spread and impact. Nevertheless, it faces challenges. Data availability and quality are primary concerns, as data may be incomplete or inaccurate, impeding meaningful conclusions. Outbreaks evolve rapidly, posing difficulties in keeping up with the latest trends. Moreover, outbreak analysis demands substantial resources, including time, expertise, and funding, for data collection, analysis, and interpretation. These challenges must be addressed to fully leverage outbreak analysis for informed decision-making during pandemics. Additionally, similar challenges exist in analysing diseases like pneumonia and flu.
3. Proposed Methodology
Outbreak analysis is a crucial task in managing pandemics that involves identifying infected individuals, tracing contacts, and predicting outbreaks. Effective outbreak analysis requires timely and accurate data analysis and interpretation. The use of machine learning models can aid in managing pandemics by analyzing outbreak data and providing valuable insights. This research proposes a three-layer machine learning-based outbreak prediction model that consists of four phases: (a) pre-processing, (b) feature extraction, (c) feature selection, and (d) outbreak prediction, which can provide a novel approach to effectively manage pandemics.
Data pre-processing: The first step involves collecting and pre-processing outbreak data, which includes cleaning the data, handling missing values, and formatting it for analysis. Pre-processing techniques such as data cleaning and normalization (such as min-max normalization) are employed to prepare the data for further analysis.
Feature extraction: In the next step, relevant features are extracted from the pre-processed data using techniques such as central tendency and statistical dispersion.
Feature selection: After the features are extracted, the subsequent step involves selecting the most relevant features for outbreak prediction. This is achieved through the use of a hybrid optimization algorithm, such as the Spotted Hyena Optimizer (SHO) and Seagull Optimization Algorithm (SOA). The hybrid optimization algorithm assists in selecting the most relevant features for outbreak prediction, while also minimizing the risk of overfitting.
Outbreak prediction: The last step is to construct a machine learning model for outbreak prediction utilizing a three-layer machine learning approach. The first layer consists of an optimized Support Vector Machines (O-SVM) with the hyperparameter of SVM optimized through a hybrid optimization algorithm, such as SHO and SOA. The second layer is a k Nearest Neighbors (KNN) for sequence modelling, and the third layer is XGBoost for prediction. The model can be trained on historical outbreak data and utilized to forecast the likelihood of future outbreaks. Fig. 1 shows the overall proposed architecture.
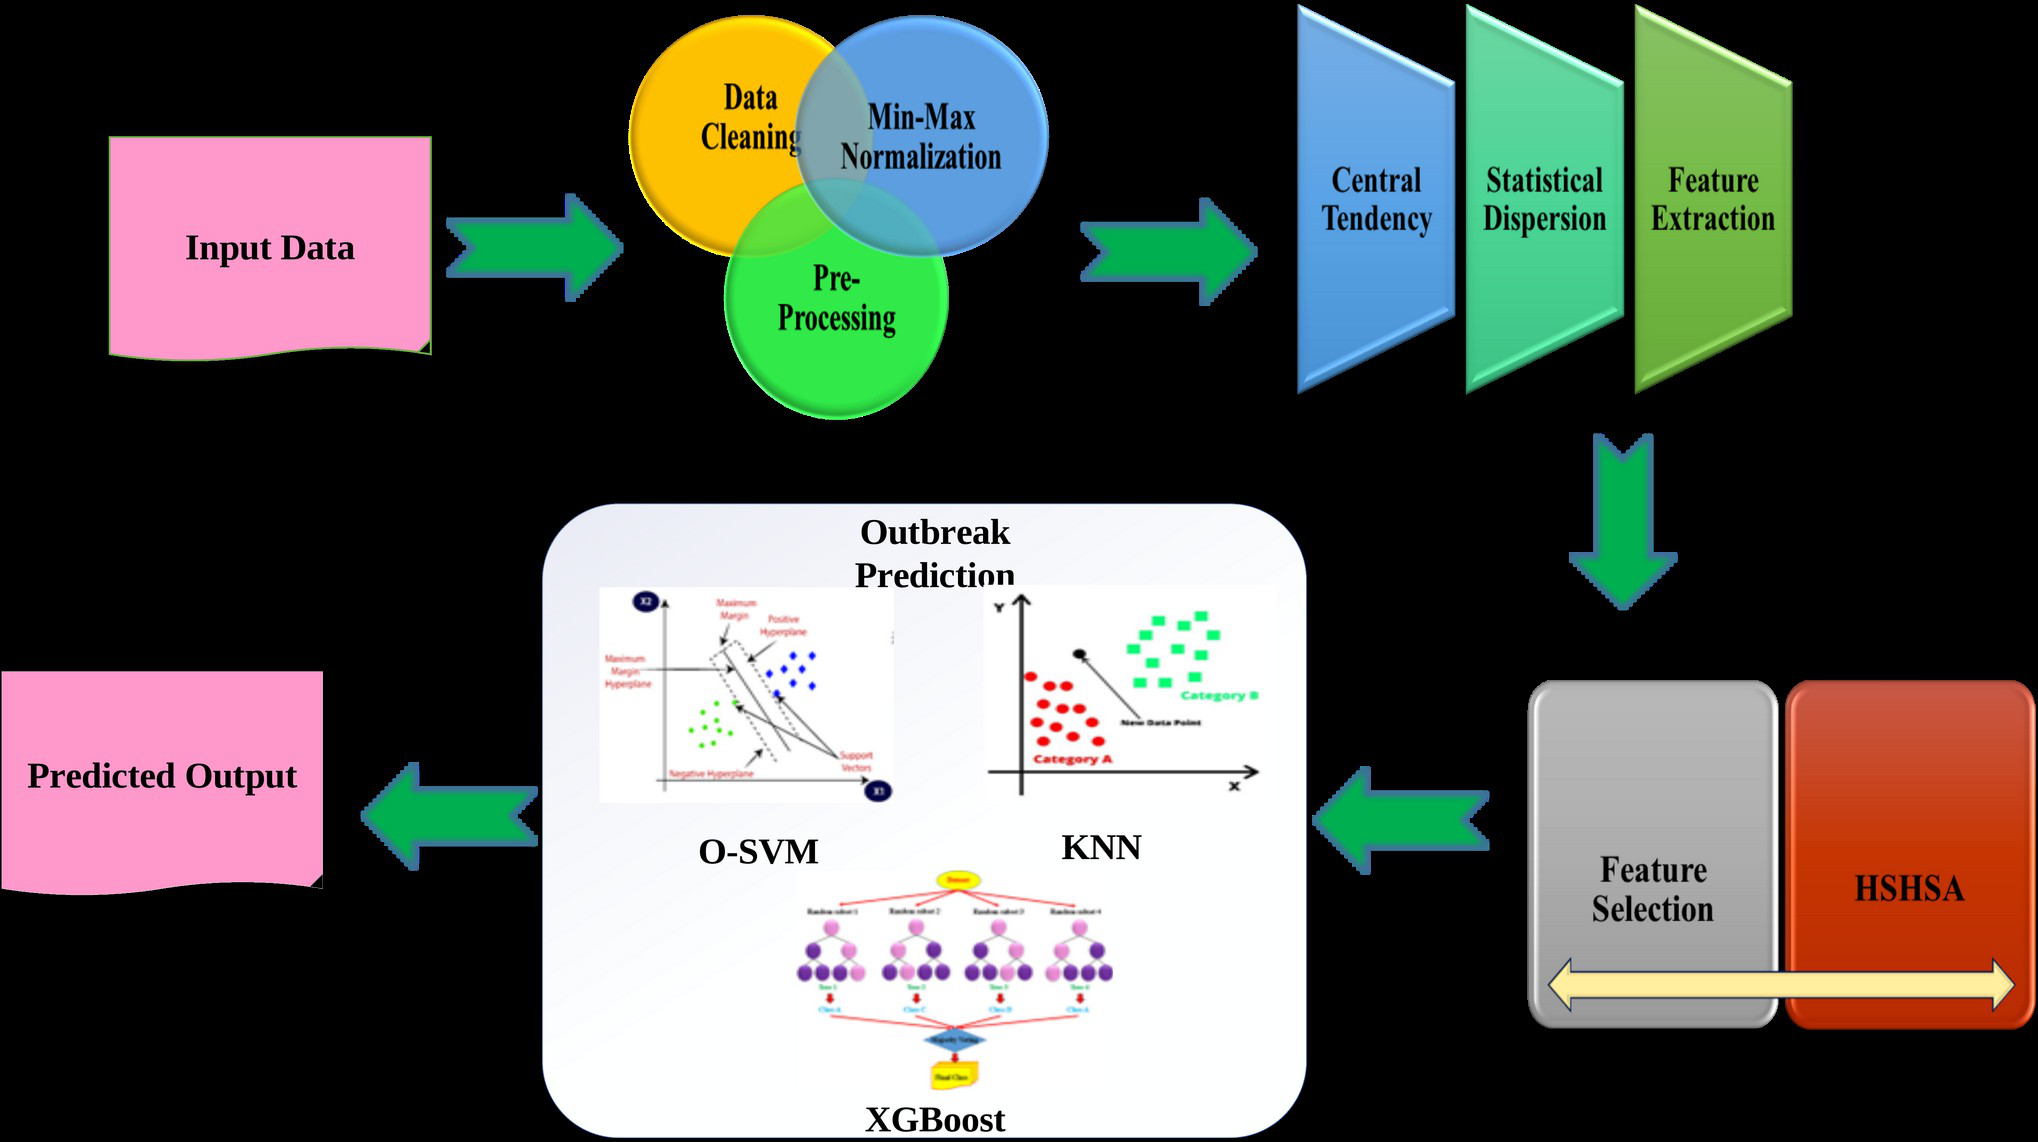
Figure 1: Overall Proposed Architecture
3.1. Data Pre-Processing
In this research, the data is pre-processed using techniques such as data cleaning and normalization, specifically min-max normalization.
3.1.1. Data Cleaning
Data cleaning is a crucial step in outbreak analysis as it involves identifying and correcting or removing erroneous, incomplete, or irrelevant data from the dataset. It is an essential process to ensure that the analysis is based on accurate and trustworthy data. During a pandemic, managing outbreak data can be challenging due to the sheer volume of data being generated, and the possibility of errors or inconsistencies in data collection. Data cleaning can help to address these issues and ensure that the analysis is based on reliable data. Data cleaning involves several techniques such as removing duplicate records, handling missing values, correcting inconsistent data, and dealing with outliers. These techniques are necessary to ensure that the analysis is based on consistent and accurate data. In the context of outbreak analysis, data cleaning can help to identify and correct errors in data related to factors such as date, location, and demographic information. These errors can have a significant impact on the accuracy of outbreak predictions and the effectiveness of response efforts. Effective data cleaning requires careful attention to detail, as even small errors can have a significant impact on the accuracy of the analysis. Automated tools can be used to facilitate the data cleaning process and improve efficiency. In addition to improving the accuracy of outbreak analysis, data cleaning can also help to increase public trust in the analysis and the response efforts. Transparency and accountability in data collection and analysis are essential for effective outbreak management. It is a critical step in outbreak analysis, as it ensures that the analysis is based on accurate, reliable, and consistent data. It is an essential component of effective pandemic management and response efforts.
3.1.2. Min-Max Normalization
Min-Max normalization is a statistical technique that can be used to transform a dataset into a common scale, typically between 0 and 1. This technique is particularly useful when analyzing data during a pandemic situation, where it can be critical to identify patterns and make informed decisions quickly. One application of Min-Max normalization in outbreak analysis is to compare the number of cases across different regions or time periods. By scaling the data to a common range, it becomes easier to identify areas with particularly high or low levels of cases. Min-Max normalization rescales the data but does not remove outliers or reduce their influence. Outliers can affect the observed minimum and maximum and therefore require separate assessment during data cleaning. In addition to outbreak analysis, Min-Max normalization can also be used in other types of data analysis, such as financial forecasting or customer segmentation. However, it is important to note that this technique should be used in conjunction with other analytical tools and techniques in order to make informed decisions. To perform Min-Max normalization, the data is first transformed to a range between 0 and 1 as per Eq. (1).
(1)
where is the original value, is the minimum value in the dataset, and is the maximum value in the dataset. It is a powerful tool for outbreak analysis during a pandemic situation. By scaling the data to a common range, it becomes easier to identify patterns and make informed decisions that can help to mitigate the spread of the disease. Once the data is pre-processed, it is then fed into the feature extraction phase to extract relevant information or features that can be used for modelling or analysis.
3.2. Feature Extraction
In this research study, the process of feature extraction is conducted by utilizing measures of central tendency and statistical dispersion. These techniques are commonly employed in data analysis to identify and extract important characteristics of a dataset that can be used for further analysis and decision-making.
3.2.1. Central Tendency
In the context of outbreak analysis for decision making under pandemic situations, central tendency is a statistical concept used to identify the typical or central value of a dataset. It is an important feature extraction technique used to summarize the characteristics of pandemic data and gain insights into the overall distribution of the outbreak. The three main measures of central tendency used in outbreak analysis are:
Mean: The mean is the arithmetic average of the data, calculated by adding up all the values and dividing by the number of values. The formula for calculating the mean is the same as in the general case as per Eq. (2).
(2)
where are the values in the dataset, and is the number of values.
Median: The median is the middle value in a dataset when the values are arranged in order. If there is an even number of values, the median is the average of the two middle values. The formula for calculating the median is given as per Eq. (3) and Eq. (4).
If is odd, (3)
If is even, (4)
where and are the two middle values in the dataset.
Mode: The mode is the value that occurs most frequently in a dataset. In outbreak analysis, the mode can be used to identify the most common symptoms or transmission routes of a disease. Central tendency is a critical feature extraction technique in outbreak analysis, as it provides a summary of the data that can help researchers and decision-makers better understand the outbreak and take appropriate action. By identifying the central tendency of the data, analysts can determine the most significant trends and patterns in the outbreak and make informed decisions about public health measures and interventions.
3.2.2. Statistical Dispersion
In the context of outbreak analysis for decision making under pandemic situations, feature extraction using statistical dispersion involves summarizing the variability of the outbreak data using measures such as range, variance, and standard deviation. This can help identify patterns and trends in the data, as well as areas of high risk or vulnerability. The formulas for calculating the range, variance, and standard deviation are as follows:
Range: The range is calculated as the difference between the maximum and minimum values in the dataset. The formulas for calculating the range are given as per Eq. (5).
(5)
where is the outbreak data.
Variance: The variance measures the average squared deviation of the data from the mean. It is calculated as per Eq. (6).
(6)
where is each value in the outbreak data, is the mean of the outbreak data, and is the number of values in the dataset.
Standard Deviation: The standard deviation is the square root of the variance and provides a measure of the spread of the data around the mean. It is calculated as per Eq. (7).
(7)
Feature extraction using statistical dispersion can be useful in outbreak analysis for decision making under pandemic situations as it allows for a more detailed understanding of the variability of the outbreak data. This information can be used to identify areas of high risk or vulnerability, as well as inform public health interventions and policies. After the feature extraction phase, the extracted features are passed on to the feature selection phase where relevant information or features are selected for further analysis.
3.3. Feature Selection
A hybrid optimization algorithm such as Spotted Hyena Optimizer (SHO) and Seagull Optimization Algorithm (SOA) is utilized in the feature selection phase. The hybrid algorithm enables the selection of the most relevant features for outbreak prediction, while minimizing the risk of overfitting.
3.3.1. Seagull Customized Hyena Optimization Algorithm (SCHOA)
A new hybrid optimization model, which combines SHO and SOA. SHO is inspired by the foraging behaviour of spotted hyenas, which hunt in packs and use different strategies for catching their prey. It is a metaheuristic optimization algorithm that can be used for solving complex optimization problems. On the other hand, SOA is inspired by the flocking behaviour of seagulls, which fly in a coordinated manner and adapt their flight path to changes in the environment. To summarize, the Seagull Customized Hyena Optimization Algorithm (SCHOA) involves initializing a population of hyenas, calculating the fitness of each hyena using an objective function, and then iterating through a series of optimization steps to improve the overall fitness of the population.
3.3.1.1. Initialization
The initialization step of the Spotted Hyena Optimizer (SHO) involves creating a population of candidate solutions, represented as hyenas. The population is denoted as , and each individual in the population is represented as , where . The size of the population, , is typically chosen by the user based on the complexity of the problem being solved and the available computational resources. During the initialization step, each hyena is assigned an initial position in the search space, which can be random or based on some prior knowledge about the problem. The initial position represents a candidate solution to the optimization problem, and the goal of the SHO algorithm is to iteratively improve upon these solutions through a combination of exploration and exploitation.
3.3.1.2. Fitness Computation
The fitness of each hyena is typically computed based on the objective function of the optimization problem being solved. The specific calculation of the fitness value can vary depending on the problem and the formulation of the objective function. However, based on the provided information, it seems that in your case, the fitness of each hyena is computed as the minimum value of the error function. That is, if a hyena has an error, then its fitness value would be calculated as
3.3.1.3. Global Best Hyena
Selecting the global best hyena involves identifying the individual with the best fitness value in the entire population. This is typically done by comparing the fitness values of all individuals in the population and selecting the one with the lowest (or highest, depending on the problem) fitness value as the global best. Once the global best hyena has been identified, its position and fitness value are used as a reference point for the rest of the population. Other individuals in the population can then use the position of the global best hyena to guide their own movement and search for better solutions in the search space.
3.3.1.4. Proposed Encircling prey
SCHOA uses two mechanisms for updating the position of search agents during optimization. The first mechanism simulates the behaviour of hyenas in encircling prey, and involves updating the position of each hyena based on a set of rules. The target prey is thought to be the best option at this time because the search space is unknown. Hyenas in the area that are searching for the target attempt to update their positions relative to it. This behaviour can be mathematically expressed as per Eq. (8) and Eq. (9).
(8)
(9)
Here, is the current iteration, and are the coefficient vectors, and are the position vectors of the prey and spotted hyena and the is the distance between the spotted hyena and prey. However, (.)and (||) are the multiplication of vector and absolute value correspondingly. Eq. (10) to Eq. (11) are the calculation for the vectors and .
(10)
(11)
(12)
Where, . and represents the random vectors. A different number of locations can be reached by varying the values of and vector. The second mechanism simulates the helix-shaped movement of humpback whales during hunting, and updates the position of search agents using a spiral equation.
Shrinking Encircling Mechanism: This involves decreasing the value of a in the equation used to update the position of the search agent, and decreasing the fluctuation range of as well. The value of is reduced from 2 to 0 over the course of iterations, and random values of A are chosen from the interval The new position of the search agent can be defined anywhere in between its original position and the position of the current best agent.
Spiral Updating Position: This mechanism simulates the helix-shaped movement of humpback whales during hunting. It first calculates the distance between the search agent and the prey, and then creates a spiral equation between the two positions to update the agent’s position as per Eq. (13).
(13)
where is the distance between the agent and the prey, is a constant defining the shape of the logarithmic spiral, is a random number in [-1,1], and denotes element-wise multiplication.
3.3.1.5. Proposed Hunting
The proposed hunting optimization algorithm is designed to simulate the behaviour of hyenas in encircling prey. The algorithm includes two mechanisms for updating the position of search agents during optimization. The first mechanism is propagation through a leader’s position. The algorithm assumes the candidate solution close to the optimum, which is determined based on the fitness function, as the best solution. The leader position, represented as , is the first best position of the hunter. Each individual in the population tries to attain the best position, and the encircling behaviour is modelled using Eq. (13).
(13)
where is the position at the current iteration,andare coefficient vectors, and is a random number developed considering the wind speed. The coefficient vectors are measured as per Eq. (14).
(14)
(15)
where is the maximum iteration, is a parameter that has a value between -1 and 1, and is a random number within the interval [0, 1]. The second mechanism is propagation through position angle. The algorithm considers the position angle in the update rule to enhance the search space. The angle calculation is essential to determine the position of the hunter such that prey is unaware of the attack, and hence, the hunting process will be effective. The angle of visualization of the deer or the prey is computed as per Eq. (16).
(16)
Based on the difference between the wind angle and the visual angle of the deer, a parameter is computed that helps to update the position angle. Then, the position angle is updated for the next iteration as per Eq. (17).
(17)
(18)
With the consideration of the position angle, the position update is designed as per Eq. (19).
(19)
where represents the best position, and is the random number. The position of the individual is nearly the opposite of the position angle so that the hunter is not in the view of the deer. The proposed hunting optimization algorithm is designed to simulate the behaviour of hyenas in encircling prey using two mechanisms for updating the position of search agents. These mechanisms enable the algorithm to effectively explore the search space and converge to the optimal solution.
3.3.1.6. Attacking
The purpose of the exploitation is to capitalize on both the experience and the prior success of the search. The seagulls had the ability to often change their attacking angle and speed during the period of migration. They assist themselves in maintaining their height by using both their body weight and their wings. The seagull bird attacks its prey in a spiral motion while it is in the air. The u, v, and w planes were used to show the following properties in Eq. (20) to Eq. (23) respectively.
(20)
(21)
(22)
(23)
Where denoted the diameter of each spiral turn and denoted a random value falling within the range of . Where e was used as the base for the natural logarithm, were the constants used to define the spiral shape. Eq. (24) is used to determine the search agents’ most recent location.
(24)
Where changes the position and then saves the best response from various search agents. The population is produced randomly at the start of the seagull optimization algorithm (SOA) that is being presented. The search agents were able to inform the positions according to the most effective search agent during iterations. The was linearly minimized from to 0. The seamless transition between exploitation and exploration was due to the variable .
3.3.1.7. Exploration
Hyenas that are part of the vector assist the algorithm explore in a wide-ranging search region. The value of becomes >1 or < -1 throughout exploration. The search agent is able to stay away from the target thanks to it. Typically, it allows hyenas to perform global searches. By providing the random weights of the goal, also plays a significant part in exploration. SHO avoids the local optima trap by utilizing these resources.
3.3.1.8. Update the Global Best Position
After updating the positions of all the search agents, the next step is to update the global best position, which represents the best solution found so far in the search space. The global best position is updated by comparing the fitness value of the current best position with the fitness value of the new candidate solutions. If a new candidate solution has a better fitness value than the current best position, then the global best position is updated to that solution. This process ensures that the search algorithm converges towards the best possible solution in the search space. In the outbreak prediction phase, the selected optimal features are used as input to a prediction model that can forecast the occurrence of outbreaks.
3.4. Outbreak Prediction
The objective of this research work is to develop a machine learning model for predicting outbreaks using a three-layer approach. The model utilizes three different machine learning algorithms namely Optimized Support Vector Machines (O-SVM), K-Nearest Neighbours (KNN), and XGBoost for making predictions. These algorithms are popular choices in the field of machine learning and are applied in various prediction tasks.
3.4.1. Optimized Support Vector Machines (O-SVM)
SVM is a popular machine learning algorithm used for classification and regression tasks. It separates data points by finding an optimal hyperplane in a high-dimensional space, where the margin between the two classes is maximized. In the context of outbreak analysis for decision making under pandemic situation using optimized three-layer machine learning approach, SVM is used as a classifier to predict the outbreak risk level of a particular area. The weight in SVM refers to the coefficient values assigned to each feature in the input data. The optimization of these weights is important to ensure the accuracy of the SVM model. SCHOA is used to optimize the weight values in SVM. It is a hybrid optimization algorithm that combines the foraging behaviour of spotted hyenas and the flocking behaviour of seagulls. The SVM algorithm can be expressed mathematically as follows:
Given a set of training data where is a d-dimensional input feature vector and is its corresponding class label the SVM algorithm seeks to find a hyperplane that separates the data points with the largest possible margin. The hyperplane can be represented as per Eq. (25).
(25)
where is the weight vector and is the bias term. The objective of the SVM algorithm is to find the weight vector w and bias term b that maximize the margin between the two classes, subject to the constraint that all data points lie on the correct side of the hyperplane. This can be expressed mathematically as per Eq. (26).
Here, represents the squared Euclidean norm of the weight vector , and represents the functional margin of the ith data point from the hyperplane.
3.4.2. K-Nearest Neighbours (KNN)
KNN is a supervised learning algorithm used for classification and regression tasks. In the context of outbreak prediction, KNN can be used to predict the likelihood of an outbreak occurring in a particular region based on historical data and features such as population density, temperature, rainfall, and travel patterns. The algorithm works by finding the k-nearest neighbours to a new data point and assigning a class label to the new point based on the majority class of the neighbours. The distance metric used to calculate the similarity between the new data point and the training data points can be Euclidean distance, Manhattan distance, or any other suitable distance metric. The procedure for KNN for outbreak prediction can be described as follows:
1. Normalize the data: Normalize the data by scaling it between 0 and 1, so that all features are treated equally in the prediction process.
2. Choose a value for : Choose a value for , which is the number of nearest neighbors to consider when predicting the class of a new data point.
3. Calculate the distance: Calculate the distance between the new data point and each training data point using a distance metric, such as Euclidean distance or Manhattan distance.
4. Select k-nearest neighbours: Select the data points with the shortest distances to the new data point.
5. Predict the class label: Predict the class label for the new data point based on the majority class of the k-nearest neighbours.
The formulas for Euclidean distance and Manhattan distance are given as per Eq. (1) and Eq. (2).
(1)
(2)
Where and are two data points in n-dimensional space, and andrepresent the i-th feature of and. KNN is a powerful tool for outbreak prediction that can help public health officials to take proactive measures to prevent the spread of disease. By analysing historical data and identifying patterns in the data, KNN can predict the likelihood of an outbreak occurring in a particular region based on various features, such as population density, temperature, rainfall, and travel patterns.
3.4.3. XGBoost
XGBoost can be applied to outbreak prediction by training the algorithm on historical outbreak data and using it to predict future outbreaks. The input data for XGBoost would include features such as population density, climate data, and previous outbreak data. To train the model, the objective function is defined as a sum of a loss function and a regularization term. The loss function measures the difference between the predicted and actual outbreak data, while the regularization term is used to control the complexity of the model and prevent overfitting. The objective function is given as per Eq. (3).
(3)
where represents the model parameters, represents the actual outbreak data, and represents the predicted outbreak data. is the loss function and is the regularization term. XGBoost uses gradient boosting to iteratively improve the model by adding new decision trees. The gradient descent algorithm is used to minimize the objective function. The new decision tree is added to the model by fitting the residual errors of the previous tree. The final prediction is the sum of the predictions from all the trees. The algorithm also uses a technique called feature importance to identify which features are most important in predicting the outbreak. The feature importance is calculated based on the number of times a feature is used to split the data across all the trees. The XGBoost algorithm for outbreak prediction involves defining the objective function, using gradient boosting to add new decision trees, and calculating feature importance to identify important features. In conclusion, utilizing historical outbreak data, three-layer machine learning models can be trained to forecast the probability of future outbreaks.
4. Result and Discussion
4.1. Experimental Setup
The proposed model is implemented using Python. The proposed model is compared with the existing models namely, Support vector machine (SVM), Artificial neural network (ANN), Random Forest (RF), Decision tree (DT). The performance metrics like Mean Squared Error (MSE), Mean Absolute Error (MAE), Mean error (MEAN), Root Mean Squared Error (RMSE), Relative Absolute Error (RAE), and Mean Absolute Percentage Error (MAPE) are used to evaluate the proposed model.
4.2. Overall performance of the proposed model
Table 1: Overall performance metrics
| Methods | Proposed | SVM | ANN | RF | DT |
|---|---|---|---|---|---|
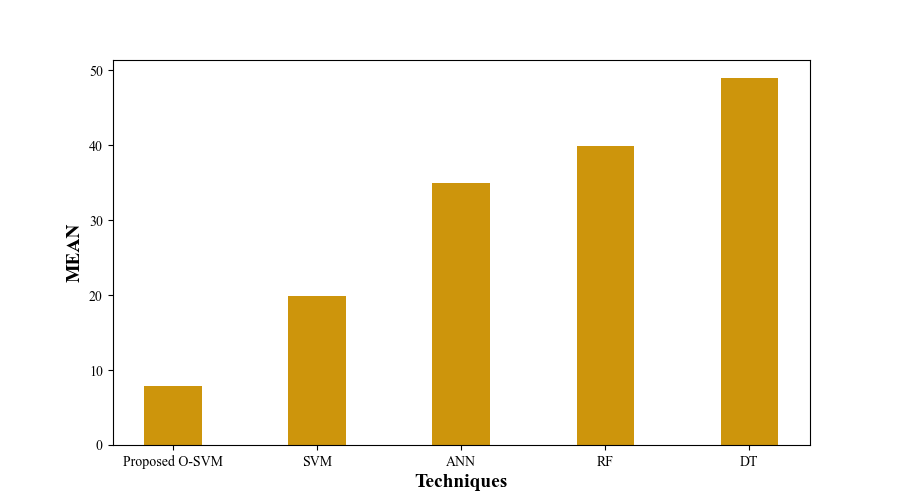
| MEAN | 7.935 | 19.935 | 34.935 | 39.935 | 48.935 |
| MAE | 0.143742 | 8.130767 | 31.79949 | 38.20838 | 43.13139 |
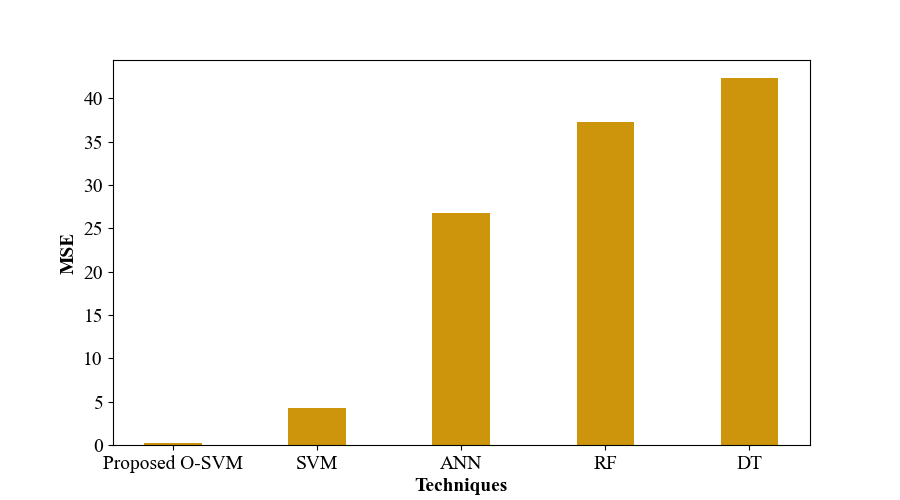
| MSE | 0.23075 | 4.250869 | 26.77395 | 37.26956 | 42.26325 |
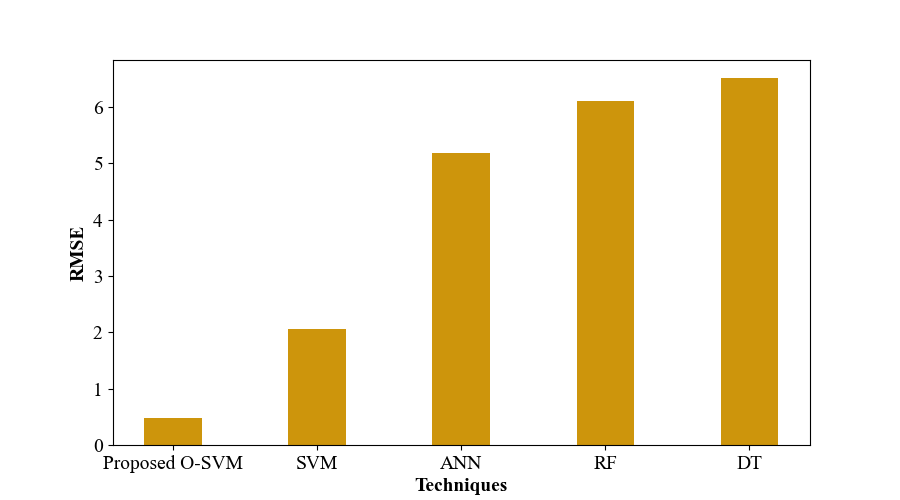
| RMSE | 0.480364 | 2.061764 | 5.174355 | 6.10488 | 6.501019 |
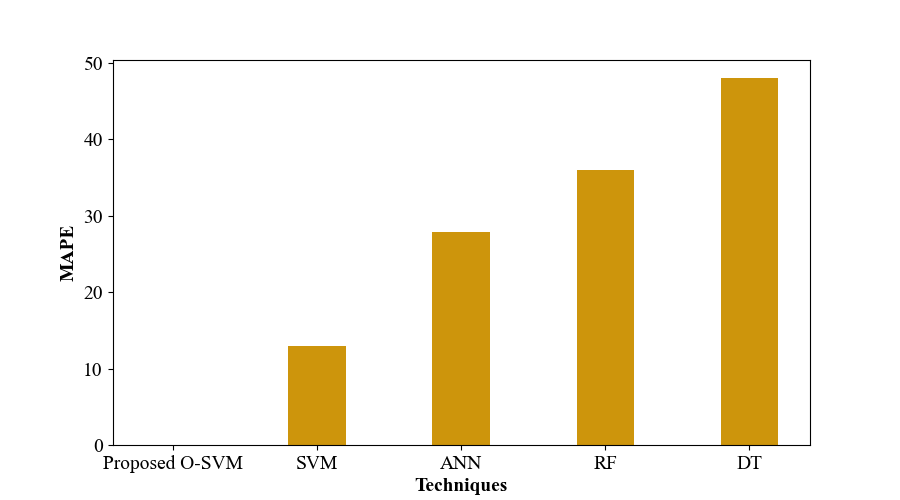
| MAPE | 0.001459 | 12.997 | 27.90725 | 36.00321 | 47.99747 |
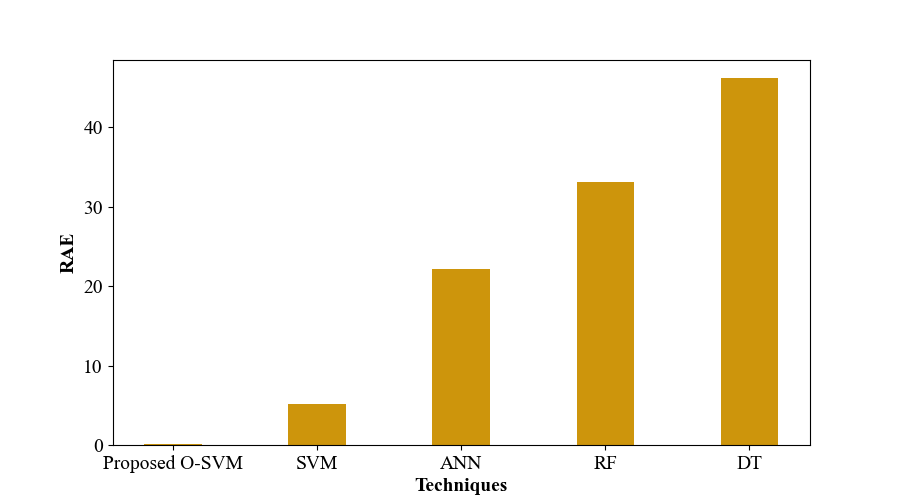
| RAE | 0.125898 | 5.125898 | 22.1259 | 33.1259 | 46.1259 |
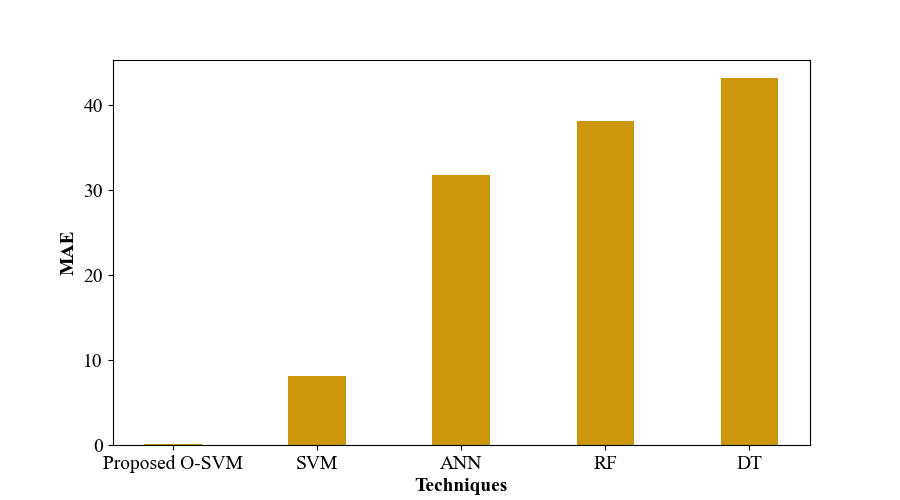
Table 1 presents a comparative analysis of the performance metrics for the proposed model and four existing models. The proposed model achieved the lowest mean error (7.935), indicating its superior overall predictive accuracy compared to the other models. The proposed model exhibits the smallest absolute prediction errors on average (0.143742), signifying its high precision in predicting outcomes. The proposed model again outperforms others with the lowest MSE (0.23075), highlighting its effectiveness in minimizing squared prediction errors. The RMSE for the proposed model (0.480364) is the lowest, suggesting its predictions are closest to the actual values. The proposed model shows a notably low MAPE (0.001459), indicating minimal percentage prediction errors. The RAE is impressively low for the proposed model (0.125898), underscoring its high precision compared to other models.
Table 2: Feature Selection Time (ms)
| Methods | 5 | 10 | 15 | 20 | 25 |
|---|---|---|---|---|---|
| Proposed SHSOA | 3229.12 | 6848.24 | 9368.25 | 12781.12 | 16103.21 |
| SHOA | 6747.235 | 9489.245 | 12326.24 | 16161.27 | 20206.21 |
| SOA | 9269.125 | 12122.24 | 15184.27 | 19246.25 | 23301.56 |
| CSOA | 12589.26 | 15168.13 | 18248.12 | 23329.45 | 26407.24 |
| PSOA | 16108.26 | 18205.12 | 21301.46 | 27406.13 | 29505.21 |
Table 2 provides insights into the computational efficiency of different feature selection methods measured in milliseconds (ms). The methods compared are the Proposed SHSOA, SHOA, SOA, CSOA, and PSOA. Proposed method consistently demonstrates the lowest feature selection time across varying feature dimensions, ranging from 3229.12 ms for 5 features to 16103.21 ms for 25 features. It showcases notable efficiency in selecting relevant features. All other methods exhibit progressively higher feature selection times as the feature dimensionality increases. The Proposed SHSOA consistently outperforms these methods, indicating its superiority in terms of computational efficiency. The Proposed SHSOA stands out as the most time-efficient feature selection method, making it a promising choice for scenarios where rapid feature selection is crucial.
Table 3: Fitness vs Iteration
| Methods | 5 | 10 | 15 | 20 | 25 |
|---|---|---|---|---|---|
| Proposed SHSOA | 18.12 | 14.256 | 11.32 | 7.17 | 4.97 |
| SHOA | 22.58 | 19.67 | 15.85 | 10.24 | 7.75 |
| SOA | 26.85 | 22.32 | 18.78 | 14.8 | 11.77 |
| CSOA | 35.32 | 29.78 | 24.01 | 18.93 | 14.45 |
| PSOA | 39.74 | 34.97 | 29.78 | 25.87 | 18.27 |
Table 3 presents the fitness values achieved by different optimization methods across various iterations. The methods compared include the proposed and existing models. The proposed SHSOA This method consistently achieves lower fitness values, indicating better optimization performance as iterations progress. As the iteration count increases, the fitness values steadily decrease, demonstrating its effectiveness in converging towards optimal solutions. These alternative methods exhibit higher fitness values, which suggest slower convergence and less effective optimization. As iterations increase, the fitness values decrease, but they remain consistently higher than those of the proposed. The proposed SHSOA consistently outperforms the other methods by converging to lower fitness values, signifying its superior optimization capability. This makes it a compelling choice for optimization tasks where achieving lower fitness values is crucial.
4.3. Overall graphical representation
Fig. 2 displays the feature selection time for various methods across different numbers of selected features (5, 10, 15, 20, 25). The methods include the proposed SHSOA, SHOA, SOA, CSOA, and PSOA. Feature selection time increases with the number of selected features for all methods, but the proposed SHSOA consistently exhibits shorter times compared to the other methods. Fig. 3 illustrates the fitness values achieved by these methods over multiple iterations.
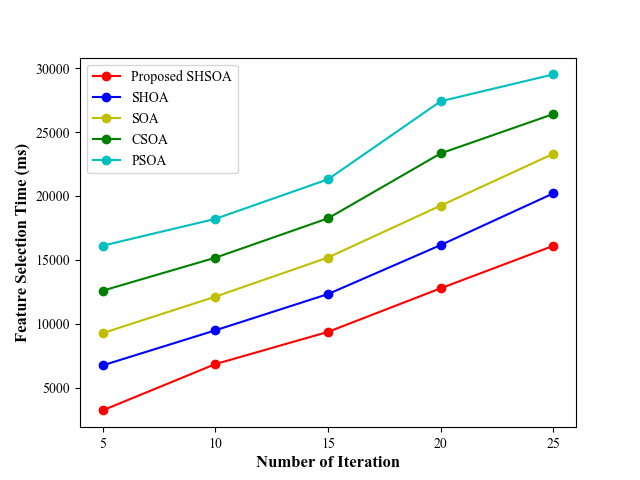
Figure 2: Feature selection time
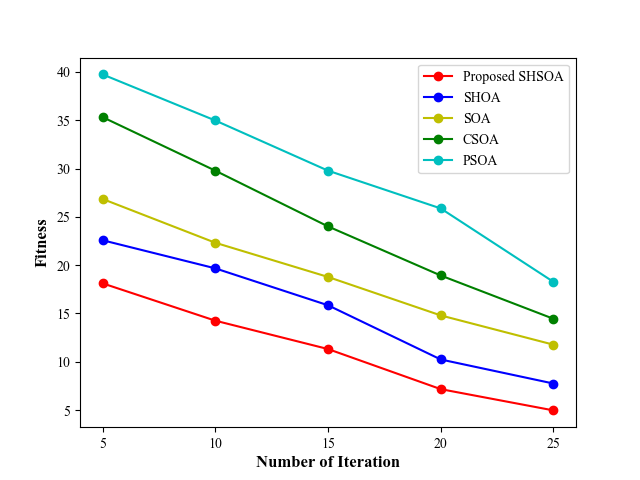
Figure 3: Fitness
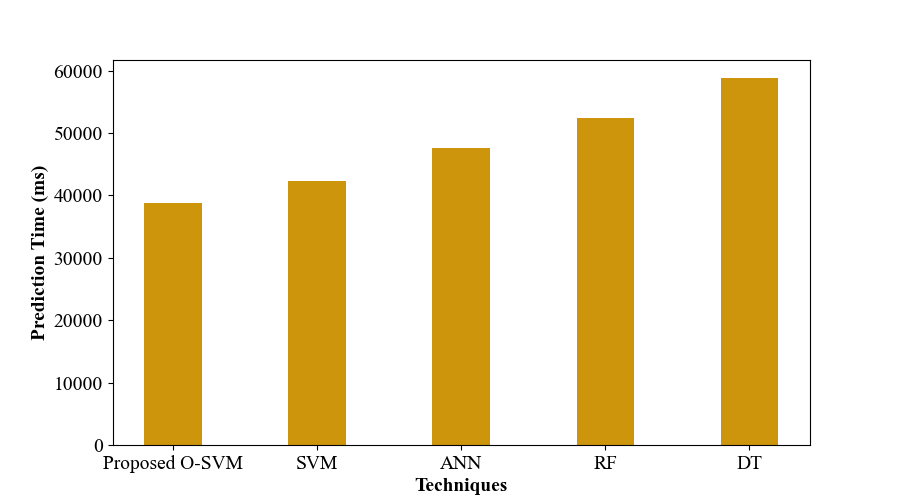
Fig. 4 displays graphical representations of performance metrics, including MAE, MAPE, MEAN, MSE, RAE, RMSE, and predicted time. These visuals offer insights into the accuracy and quality of predictions, aiding in the assessment of model performance.
 |  |
|---|---|
| (a) | (b) |
 |  |
| (c) | (d) |
 |  |
| (e) | (f) |
 | |
| (g) | |
Figure 4: Graphical representation of (a) MAE (b) MAPE (c) MEAN (d) MSE (e) RAE (f) RMSE (g) predicted time
5. Conclusion
A three-layer machine learning-based pandemic prediction model was used in this study to propose a unique method to pandemic management. The model was created in an effort to solve issues like the lack of readily available data, the requirement for real-time analysis, and the complexity of outbreak patterns, which posed serious obstacles to effective outbreak analysis. Pre-processing, feature extraction, feature selection, and outbreak prediction were the four phases of the model, all of which were carried out using PYTHON. Data on outbreaks was gathered and cleaned during the pre-processing stage, missing values were handled, and the data was structured for analysis. The second stage involved applying methods like statistical dispersion and central tendency to extract pertinent features from the pre-processed data. In order to reduce the risk of overfitting, the most important features for outbreak prediction were chosen in the third phase utilising a hybrid optimisation algorithm, such as the Spotted Hyena Optimizer (SHO) and Seagull Optimisation Algorithm (SOA). Finally, a three-layer machine learning approach was used to predict outbreaks. This approach included an optimised Support Vector Machines (O-SVM) in the first layer with hyperparameters optimised using a hybrid optimisation algorithm, a k Nearest Neighbours (KNN) in the second layer for sequence modelling, and XGBoost in the third layer for prediction. Overall, the suggested model provided a potential method for managing pandemics through accurate outbreak analysis and forecasting.
Reference
Ivanov, D., 2020. Predicting the impacts of epidemic outbreaks on global supply chains: A simulation-based analysis on the coronavirus outbreak (COVID-19/SARS-CoV-2) case. Transportation Research Part E: Logistics and Transportation Review, 136, p.101922.
Yánez Benítez, C., Güemes, A., Aranda, J., Ribeiro, M., Ottolino, P., Di Saverio, S., Alexandrino, H., Ponchietti, L., Blas, J.L., International Cooperation Group on PPE and Emergency Surgery and Ramos, J.P., 2020. Impact of personal protective equipment on surgical performance during the COVID-19 pandemic. World Journal of Surgery, 44(9), pp.2842-2847.
Ramanathan, K., Antognini, D., Combes, A., Paden, M., Zakhary, B., Ogino, M., MacLaren, G., Brodie, D. and Shekar, K., 2020. Planning and provision of ECMO services for severe ARDS during the COVID-19 pandemic and other outbreaks of emerging infectious diseases. The Lancet Respiratory Medicine, 8(5), pp.518-526.
Altuntas, F. and Gok, M.S., 2021. The effect of COVID-19 pandemic on domestic tourism: A DEMATEL method analysis on quarantine decisions. International Journal of Hospitality Management, 92, p.102719.
Yasir, A., Hu, X., Ahmad, M., Rauf, A., Shi, J. and Ali Nasir, S., 2020. Modeling impact of word of mouth and E-government on online social presence during COVID-19 outbreak: a multi-mediation approach. International journal of environmental research and public health, 17(8), p.2954.
Kargar, S., Pourmehdi, M. and Paydar, M.M., 2020. Reverse logistics network design for medical waste management in the epidemic outbreak of the novel coronavirus (COVID-19). Science of the Total Environment, 746, p.141183.
Shaker, M.S., Oppenheimer, J., Grayson, M., Stukus, D., Hartog, N., Hsieh, E.W., Rider, N., Dutmer, C.M., Vander Leek, T.K., Kim, H. and Chan, E.S., 2020. COVID-19: pandemic contingency planning for the allergy and immunology clinic. The Journal of Allergy and Clinical Immunology: In Practice, 8(5), pp.1477-1488.
Fong, S.J., Li, G., Dey, N., Crespo, R.G. and Herrera-Viedma, E., 2020. Composite Monte Carlo decision making under high uncertainty of novel coronavirus epidemic using hybridized deep learning and fuzzy rule induction. Applied soft computing, 93, p.106282.
Tirkolaee, E.B., Abbasian, P. and Weber, G.W., 2021. Sustainable fuzzy multi-trip location-routing problem for medical waste management during the COVID-19 outbreak. Science of the Total Environment, 756, p.143607.
Vîrghileanu, M., Săvulescu, I., Mihai, B.A., Nistor, C. and Dobre, R., 2020. Nitrogen Dioxide (NO2) Pollution monitoring with Sentinel-5P satellite imagery over Europe during the coronavirus pandemic outbreak. Remote Sensing, 12(21), p.3575.
Uddin, S., Imam, T., Khushi, M., Khan, A. and Moni, M.A., 2021. How did socio-demographic status and personal attributes influence compliance to COVID-19 preventive behaviours during the early outbreak in Japan? Lessons for pandemic management. Personality and Individual Differences, 175, p.110692.
Paul, S.K. and Chowdhury, P., 2021. A production recovery plan in manufacturing supply chains for a high-demand item during COVID-19. International Journal of Physical Distribution & Logistics Management, 51(2), pp.104-125.
Rahman, M.R., Islam, A.H. and Islam, M.N., 2021. Geospatial modelling on the spread and dynamics of 154-day outbreak of the novel coronavirus (COVID-19) pandemic in Bangladesh towards vulnerability zoning and management approaches. Modeling earth systems and environment, 7, pp.2059-2087.
Yadav, S., Luthra, S. and Garg, D., 2021. Modelling Internet of things (IoT)-driven global sustainability in multi-tier agri-food supply chain under natural epidemic outbreaks. Environmental Science and Pollution Research, 28, pp.16633-16654.
Belhadi, A., Kamble, S., Jabbour, C.J.C., Gunasekaran, A., Ndubisi, N.O. and Venkatesh, M., 2021. Manufacturing and service supply chain resilience to the COVID-19 outbreak: Lessons learned from the automobile and airline industries. Technological forecasting and social change, 163, p.120447.
Leach, M., MacGregor, H., Scoones, I. and Wilkinson, A., 2021. Post-pandemic transformations: How and why COVID-19 requires us to rethink development. World Development, 138, p.105233.
Janssen, M. and Van der Voort, H., 2020. Agile and adaptive governance in crisis response: Lessons from the COVID-19 pandemic. International journal of information management, 55, p.102180.
N. Gamal, S. Ghoniemy, H. M. Faheem and N. A. Seada, “Sentiment-Based Spatiotemporal Prediction Framework for Pandemic Outbreaks Awareness Using Social Networks Data Classification,” in IEEE Access, vol. 10, pp. 76434-76469, 2022.
A. Islam, T. Rahim, M. Masuduzzaman and S. Y. Shin, “A Blockchain-Based Artificial Intelligence-Empowered Contagious Pandemic Situation Supervision Scheme Using Internet of Drone Things,” in IEEE Wireless Communications, vol. 28, no. 4, pp. 166-173, August 2021.
A. Castiglione, M. Umer, S. Sadiq, M. S. Obaidat and P. Vijayakumar, “The Role of Internet of Things to Control the Outbreak of COVID-19 Pandemic,” in IEEE Internet of Things Journal, vol. 8, no. 21, pp. 16072-16082, 1 Nov.1, 2021.
Z. Pei, Y. Yuan, T. Yu and N. Li, “Dynamic Allocation of Medical Resources During the Outbreak of Epidemics,” in IEEE Transactions on Automation Science and Engineering, vol. 19, no. 2, pp. 663-676, April 2022.
Raj, A., Mukherjee, A.A., de Sousa Jabbour, A.B.L. and Srivastava, S.K., 2022. Supply chain management during and post-COVID-19 pandemic: Mitigation strategies and practical lessons learned. Journal of business research, 142, pp.1125-1139.
López, L. and Rodo, X., 2021. A modified SEIR model to predict the COVID-19 outbreak in Spain and Italy: simulating control scenarios and multi-scale epidemics. Results in Physics, 21, p.103746.
Pantano, E., Pizzi, G., Scarpi, D. and Dennis, C., 2020. Competing during a pandemic? Retailers’ ups and downs during the COVID-19 outbreak. Journal of Business research, 116, pp.209-213.
Pappas, N. and Glyptou, K., 2021. Accommodation decision-making during the COVID-19 pandemic: Complexity insights from Greece. International Journal of Hospitality Management, 93, p.102767.
Mei, X., Hao, H., Sun, Y., Wang, X. and Zhou, Y., 2022. Optimization of medical waste recycling network considering disposal capacity bottlenecks under a novel coronavirus pneumonia outbreak. Environmental Science and Pollution Research, 29(53), pp.79669-79687.
Das, D., Santosh, K.C. and Pal, U., 2020. Truncated inception net: COVID-19 outbreak screening using chest X-rays. Physical and engineering sciences in medicine, 43, pp.915-925.
El Asnaoui, K., Chawki, Y. and Idri, A., 2021. Automated methods for detection and classification pneumonia based on x-ray images using deep learning. In Artificial intelligence and blockchain for future cybersecurity applications (pp. 257-284). Cham: Springer International Publishing.
Hassan Zadeh, A., Zolbanin, H.M., Sharda, R. and Delen, D., 2019. Social media for nowcasting flu activity: Spatio-temporal big data analysis. Information Systems Frontiers, 21, pp.743-760.
Cite This Work
To export a reference to this article please select a referencing stye below:

Academic Master Education Team is a group of academic editors and subject specialists responsible for producing structured, research-backed essays across multiple disciplines. Each article is developed following Academic Master’s Editorial Policy and supported by credible academic references. The team ensures clarity, citation accuracy, and adherence to ethical academic writing standards
Content reviewed under Academic Master Editorial Policy.