
Abstract
Organic food sentiment analysis can provide insights into public perceptions of organic brands. This research introduces a deep learning model for analysing tweets about organic food companies. The proposed approach has four stages: preprocessing, feature extraction, feature selection and sentiment recognition. Raw tweets are preprocessed through tokenization, stop-word removal, stemming and URL removal. PoS tagging, Bag of Words, N-gram and Improved TF-IDF features are then extracted. Relevant features are selected using Chicken Royale Optimization Algorithm (CROA), which combines Battle Royale Optimization (BRO) and Chicken Swarm Optimization (CSO). The selected features train a three-tier voter network combining a Convolutional Neural Network, a Recurrent Neural Network and a Two-Stage Residual Long Short-Term Memory network. The voting classifier identifies positive, negative and neutral sentiments. Performance is evaluated using accuracy, sensitivity, specificity and precision, among other metrics. The experimental analysis reports a highest classification accuracy of 99.1%.
Keywords: Sentiment Analysis; Organic Foods; Tweets; CROA; Three-Tier Voter Network.
Introduction
Analysing user-generated social media content helps identify public attitudes towards organic food companies [1]. This involves collecting posts, comments, reviews and discussions from Twitter, Facebook, Instagram and specialised forums. Sentiment-analysis techniques classify the attitudes expressed in these texts [2]. Organisations and other stakeholders can use this analysis to understand perceptions of their brands [3], adapt marketing plans, strengthen their reputation and communicate with target consumers [4]. Social media use has grown substantially: the cited estimate for 2020 was approximately 3.6 billion users worldwide [5]. This widespread use provides a rich source of data for research across academic disciplines [6].
Social media data can improve understanding of societal issues and create opportunities for businesses to gain a competitive advantage [7]. The manuscript describes growing demand for organic food over the past two centuries and global sales exceeding USD 90 billion. Social platforms provide quantifiable data for analysts and marketers [8], supporting the evaluation of behavioural targeting, brand loyalty and marketing effectiveness. Clear marketing objectives and performance measures are essential [9]. Without them, analysts may struggle to turn social media data into useful organisational insights.
Deep learning uses neural network architectures to analyse perceptions of organic food brands. These models support the automated interpretation and classification of sentiment in user-generated content [10]. The process involves acquiring and analysing posts, comments and reviews. Recurrent neural networks, convolutional neural networks and transformer-based models such as BERT or GPT can be trained on preprocessed data to recognise textual patterns and emotional content. These capabilities help distinguish positive, negative and neutral opinions about organic food companies [11].
The main contributions of the paper are as follows:
The introduction of Chicken Royale Optimization Algorithm (CROA), which combines Battle Royale Optimization (BRO) and Chicken Swarm Optimization (CSO).
The development of a three-tier voter network combining CNN, RNN and TSRLSTM models through a voting classifier.
The literature review examines existing sentiment-analysis techniques. The methodology section describes the proposed approach, followed by the results, discussion and conclusion.
Literature Review
In 2018, Seo and Park [12] examined the impact of social media advertising on brand equity and customer response within the aviation sector. A survey was undertaken including a sample size of 302 individuals who utilised social media platforms administered by several airlines. The data were subjected to analysis using structural equation modelling. The most crucial aspect of social media marketing was found to be the detection of trendiness. The utilisation of social media marketing by airlines has had a notable impact on the levels of brand awareness and brand image. The level of brand awareness has been found to have an impact on consumer commitment, while the perception of brand image has been found to influence both online word-of-mouth and consumer commitment. The findings can be utilised for the formulation of social media marketing strategies in the airline industry.
In 2018, Bilgin [13] examined how social media marketing influences brand recognition, perception and loyalty. The study also investigated relationships among brand awareness, image and loyalty. Quantitative data were collected through online questionnaires from 547 consumers who followed five leading brands on platforms including Facebook, Twitter and Instagram. The findings indicated that brand awareness had a partial effect on brand image.
In 2019, Drus and Khalid [14] reviewed sentiment-analysis approaches, social media platforms and applications. Their systematic review used trusted databases covering 2014 to 2019. Of 77 articles, 24 were selected according to the study’s objectives. Most used opinion-lexicon techniques to assess social media sentiment, particularly on Twitter. Applications included global events, healthcare, politics and business.
In 2020, Rajeswari et al. [15] compared characteristics, lengths and sentiment scores in reviews of organic and regular food products. ANOVA was used to compare mean sentiment scores and review lengths, while further analysis examined differences across review length and product period. Regular food products received shorter reviews and lower sentiment scores than organic products. Scores differed between ghee and honey, with organic honey and regular ghee receiving higher scores. Longer reviews of regular ghee had lower sentiment scores, whereas longer reviews of regular and organic honey had higher scores.
In 2021, Masih [16] examined social media data from Talkwalker and Google Trends to identify positive, negative and neutral perceptions of health foods. The research was intended to help organic and gluten-free food manufacturers improve their marketing return on investment.
In 2021, Pilar et al. [17] conducted a communication analysis on Twitter data. The data consisted of 666,178 messages from 168,134 users. The analysis focused on tweets utilized #healthyfood hashtag in 2019, 2020. Findings showed, healthy food was usually associated with a healthy lifestyle, diet, and fitness. The hashtag was also linked to vegan, homemade, and organic foods. These findings have implications for understanding how social networks sway perceptions of healthful food.
In 2021, Boobalan et al. [18] investigated the Theory of Planned Behaviour, specifically focusing on consumer attitudes and intentions to buy in the setting of eating organic food. In doing so, the study omitted the consideration of pleasant glow and self-expressive benefits as supplementary elements that may influence these attitudes and intentions. An alternative modelling technique was employed, utilising Smart PLS 3.0, to examine the associations between various psychological characteristics and the constructs outlined in the Theory of Planned Behaviour. The findings of the study provide empirical evidence supporting the importance of warm glow and self-expressive benefits in the context of organic consumerism across both marketplaces.
In 2022, Khan and Shafie [19] investigated factors influencing academics’ intentions to purchase organic food in Bangladesh. The quantitative study gathered data through an online questionnaire. Every examined factor had a positive, significant relationship with purchase intention, with trustworthiness having the strongest influence. These findings may inform organic food producers, marketers and policymakers seeking to increase sales and support Sustainable Development Goals.
Research Gaps
Sentiment analysis, or opinion mining, uses natural language processing and analytical techniques to identify attitudes expressed in text. In this study, the objective is to understand public sentiment about organic food companies from social media content. Machine learning often requires substantial annotated datasets, but producing labelled data can be expensive and time-consuming. Deep learning can learn complex feature representations from raw data, reducing reliance on manual feature engineering. This capability can help capture subtle patterns in social media language.
Proposed Methodology
Overall architecture
This research introduces a three-tier voter network for analysing social media sentiment about organic food brands. Figure 1 presents the overall architecture. The main steps are described below.
Tweets are collected during the data-acquisition stage.
The raw tweets are preprocessed through tokenization, stop-word removal, stemming and URL removal.
PoS tagging, BoW, Improved TF-IDF and N-gram features are extracted from the preprocessed tweets.
BRO and CSO are combined in CROA to select the most informative features.
CNN, RNN and TSRLSTM models use the selected features, and their outputs are combined through voting classification.
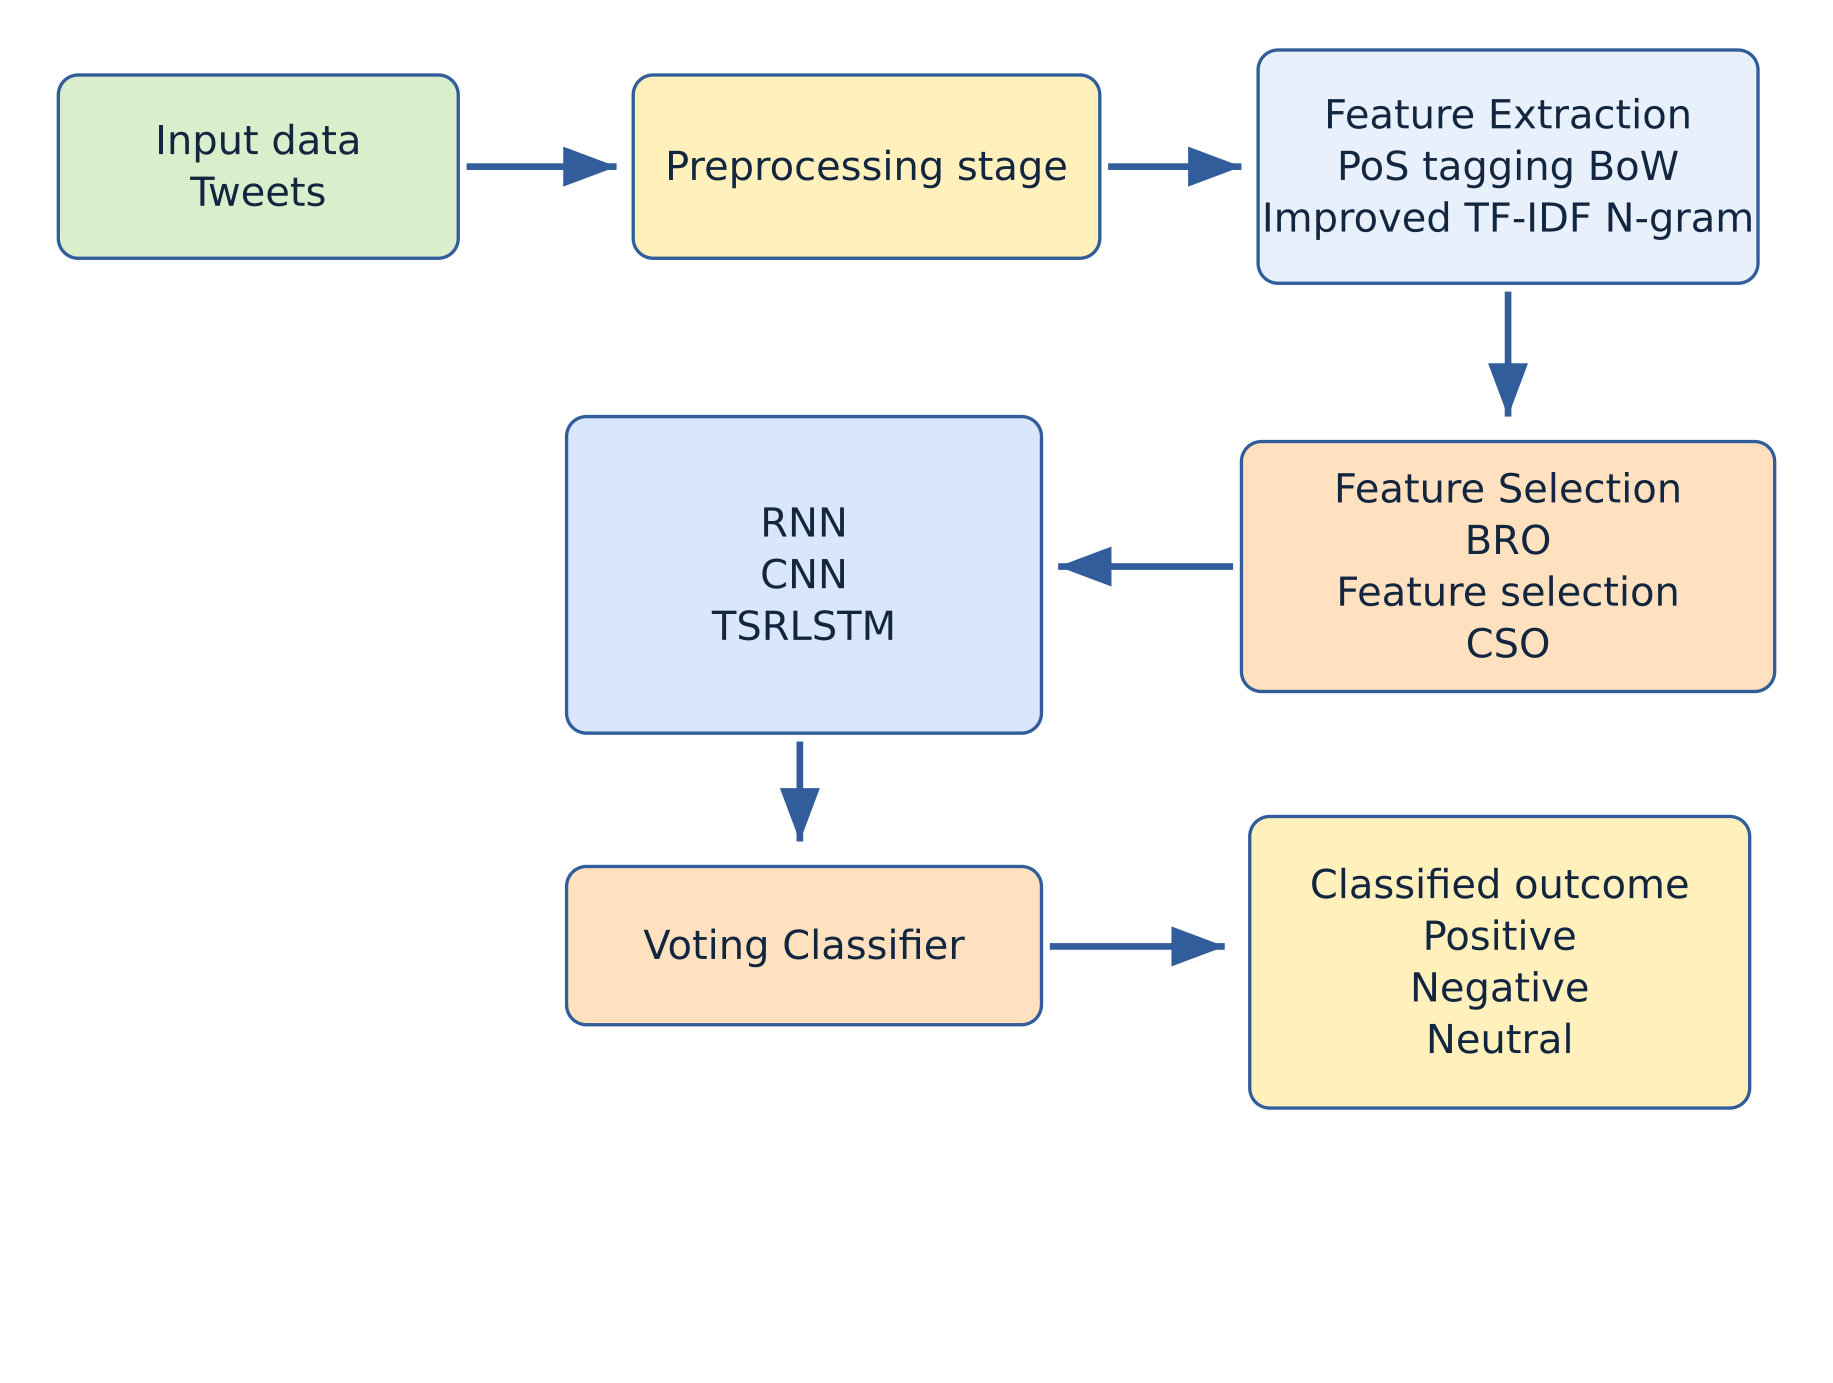
Figure 1: Overall architecture of the proposed methodology
Pre-processing
The preprocessing stage prepares the collected tweets for analysis. It includes tokenization, stop-word removal, stemming and URL removal, as shown in Figure 2.
Tokenization
Tokenization divides raw text into discrete units called tokens, such as words or phrases. These units help natural language processing systems analyse textual content and identify patterns. Tokenization supports tasks including sentiment analysis, named entity recognition, PoS tagging, text classification, question answering, translation and summarisation. It also provides the units used in subsequent stemming or lemmatization, which reduce inflected words to their stems or base forms.
Stop word removal
Stop-word removal eliminates frequently occurring words such as ‘the’, ‘and’ and ‘a’. These terms may provide limited information for particular natural language processing tasks, including sentiment analysis, classification and topic modelling. Removing them can reduce dataset size and processing costs.
Stemming
Stemming is a common text-preprocessing technique in natural language processing. It reduces a word to its stem; for example, ‘running’ may be reduced to ‘run’. Stemming algorithms apply rules to remove prefixes and suffixes. This computationally efficient technique can process large volumes of text.
URL removal
URL removal excludes web addresses from the collected tweet text before subsequent analysis.
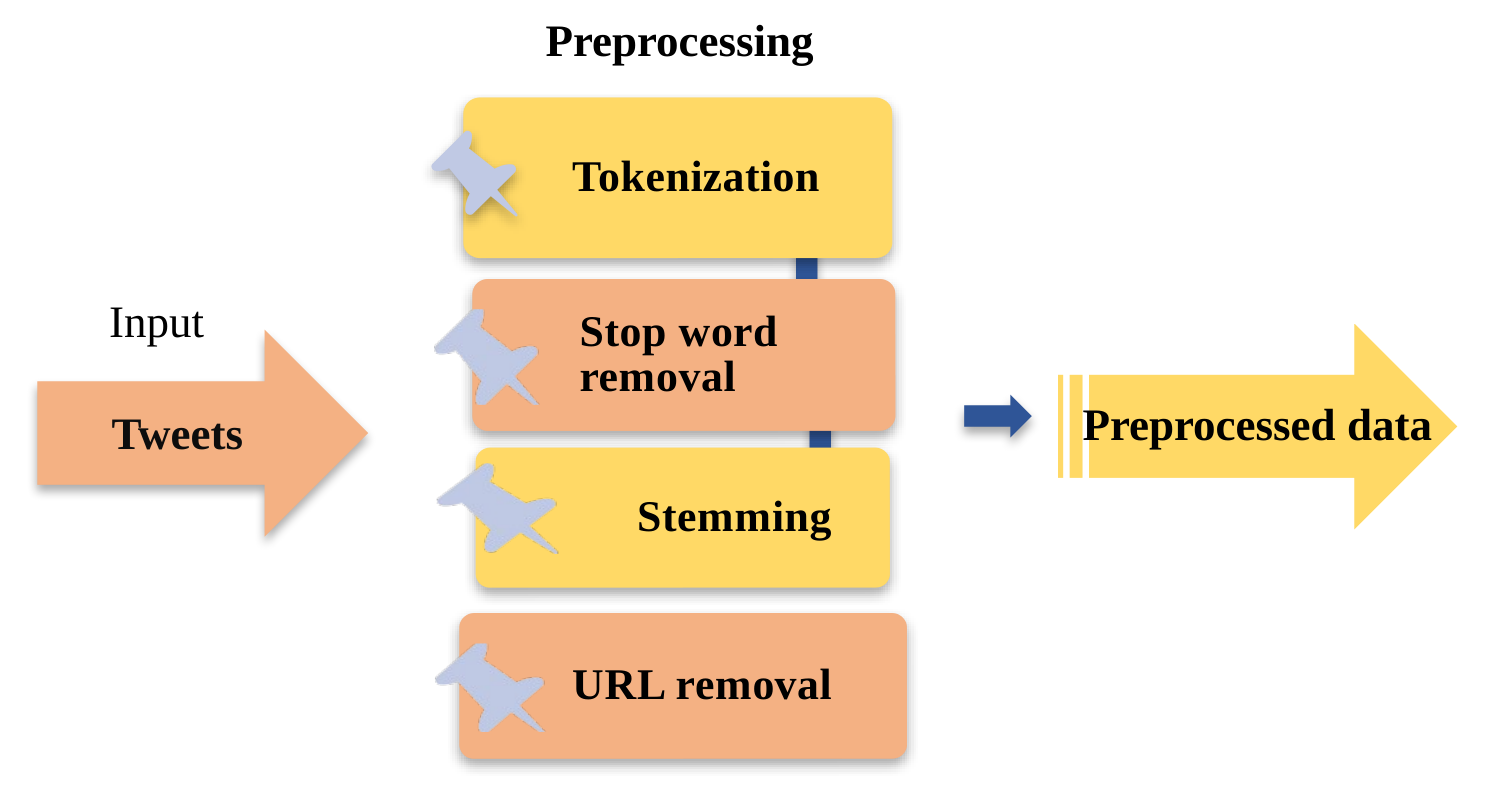
Figure 2: Preprocessed stage in proposed methodology
Feature Extraction
The preprocessed data enter the feature-extraction stage. PoS tagging, Bag of Words, Improved TF-IDF and N-gram techniques produce features intended to improve prediction. Figure 3 illustrates this process.
PoS tagging
Part-of-speech tagging assigns grammatical labels, such as noun, verb, adjective or adverb, to words in context. It supports natural language processing tasks including translation, word-sense disambiguation, question answering and parsing. Because words can have different grammatical roles in different contexts, manually assigning these labels is laborious and costly. Automated tagging addresses this difficulty.
Improved TF-IDF
TF-IDF is a numerical technique for assessing a term’s importance within a document and a collection of documents. A term that occurs frequently in one document but rarely in others can help distinguish that document. The weighting approach combines term frequency (TF), which measures occurrences within a document, and inverse document frequency (IDF), which reflects a term’s wider distribution. The source formulation begins with Equation (1).
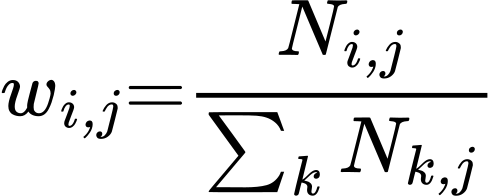 (1)
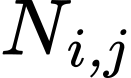 is number of incidences of the word w in file
 ,
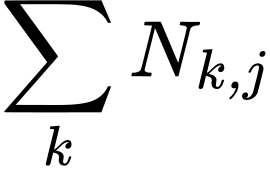 is sum of incidences of all terms in the document
 is expressed in Eq.(2)
 (2)
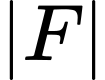 is total number of files in body,
 is number of documents comprising text
 . If a word is not present in body, it will result in a dividend of zero. So, in over-all use
 , the mathematical expression is exposed in Eq.(3)
 (3)
 is weight of word
 . The generation of high-weight TF-IDF can be attributed to the observation of a high word frequency in a specific file and a low file frequency of the word throughout the entire file set. However, upon analysis of Equation 3, it becomes evident that the TF-IDF measure fails to accurately represent the distribution of individual words across categories and their respective distributions within each category. The following assumptions can be identified: The terms
 and
 exhibit equivalent frequencies within the document file
 Specifically, the term
 is prevalent in a certain type of text set, whereas the term
 is present in all text sets. Consequently, the final computation reveals that the TF-IDF (Term Frequency-Inverse Document Frequency) values for both terms are same. However, the term
 exhibits a higher degree of concentration inside a specific category and encompasses a greater amount of information within that category. Consequently, it is advisable to provide a greater weight to this term. Regarding the term
 , it is ubiquitously present across all categories and possesses a somewhat diminished amount of category-specific information. Consequently, it is advisable to assign it a reduced weight. In other words, a greater weight ought to be allocated to a word that has a larger degree of unequal distribution across classes. The method for calculating the weighting factor is mathematically represented by Equation (4).
 (4)
The notation 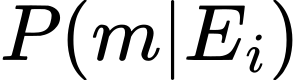 represents the likelihood of the feature word m occurring given the presence of category
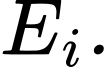 The expression
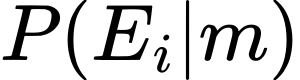 represents the conditional probability that the feature word m is associated with category
 when it is observed. This probability captures the extent to which feature words exhibit both inter-class concentration and intra-class dispersion. The expression
 squared is the measure of connection between the feature word
 and the category
 . The factor is ultimately utilised to assign weight to the TF-IDF formula, resulting in the refined TF-IDF formula as presented in Equation (5).
 (5)
BoW
Bag of Words (BoW) converts text into numerical representations by identifying words and recording their frequencies within a document. It provides features for computational analysis without requiring the original word order. The paper relates the name to the word game Scrabble and its use of letter frequencies, noting that tile values were based on letters appearing on the front page of the New York Times in 1938.
N-gram
N-grams are sequences of adjacent words used in text mining and natural language processing. They are typically generated by moving through a sentence one word at a time. Unigrams, bigrams and trigrams represent sequences of one, two and three words respectively. The manuscript’s mathematical formulation is given in Equation (6).
 (6)
 , number of words in given sentence.
 , number of n-grams for sentence
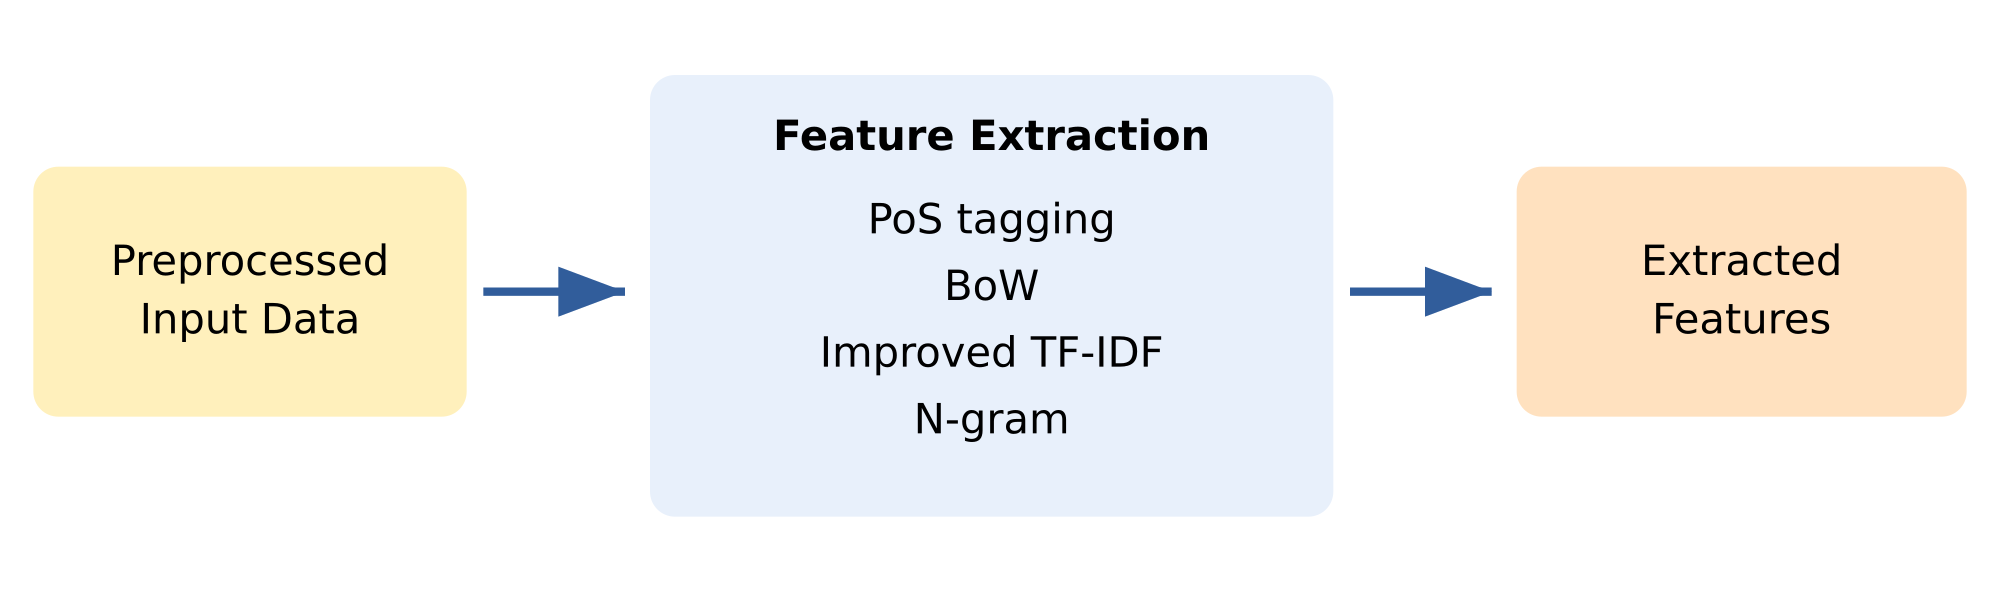
Figure 3: Feature Extraction process in proposed methodology
Optimal Feature Selection
Feature selection identifies a relevant subset of extracted features for model development. In the proposed framework, BRO and CSO are combined to select informative features for sentiment classification. Figure 4 illustrates the feature-selection process.
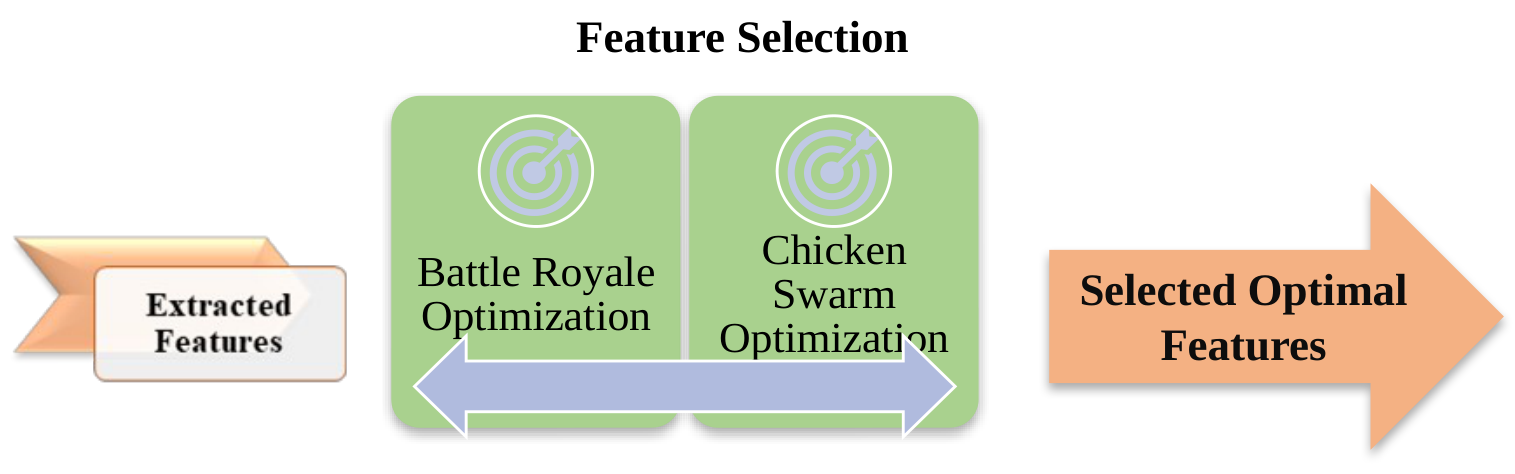
Figure 4: Feature selection process in proposed methodology
Battle Royale Optimization AlgorithmStep 3.4.1: Battle Royale Optimization Algorithm
Certain iterations of battle royale games commence with players initiating the game by leaping from an aircraft and thereafter descending to the designated map area with the use of a parachute. Furthermore, similar to other algorithms that utilise swarm intelligence, the BRO algorithm initiates by generating a random population that is uniformly dispersed across the whole issue space. Subsequently, each individual participant (soldier/player) endeavours to inflict harm upon the closest soldier through the discharge of a firearm. Soldiers situated in more advantageous places consequently inflict harm against their proximate counterparts. When a soldier gets wounded by another soldier, its level of damage increases by one. These connections are accurately intended per  where
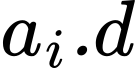 is harm stage of ith soldier amongst population. Furthermore, it is observed that soldiers have a strong inclination to promptly alter their positioning subsequent to sustaining injury, thereby strategizing to engage adversaries from an alternative direction. Therefore, in order to prioritise the act of exploitation, the soldier that has been affected advances towards a point that lies between its former location and the best position that has been discovered thus far. These connections are exactly expressed in Eq.(7)
 (7)
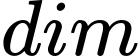
Where, g is the randomly produced number consistently distributed in range [0,1] and 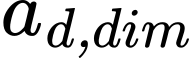 is location of injured soldier in dimension
 . Furthermore, in the subsequent iteration, it is possible for injured warriors to inflict harm upon their adversaries,
 will be reset to zero. In addition, in order to prioritise exploration, when a soldier’s damage level exceeds the predetermined threshold value, the soldier will perish and thereafter reappear at a random location within the viable problem space. Furthermore, the variable
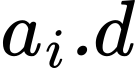 will be rearrange to zero. After conducting a series of experiments, it was decided that a threshold value of 3 was deemed suitable. This step effectively mitigates the issue of premature convergence and enhances the level of investigation. The reintegration of a deceased soldier into the problem space is expressed in Eq.(8)
 (8)
Where  and
 are the upper bound and lower bound of dimension
 , correspondingly. Also, in each
 iteration feasible search space of the problem starts to reduce down to finest answer. Original value was
 but then
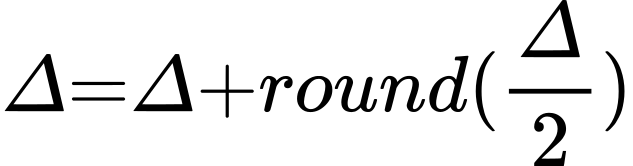 . Here
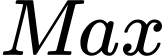 is maximum number of iterations. Lower and upper bounds changed in the following manner. The upper and lower bounds are shown in Eq.(9) and Eq.(10) respectively.
 (9)
 (10)
Here 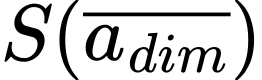 is standard deviation of entire population in dimension
 and
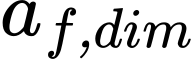 is location of the best solution found so far. Henceforth, if the
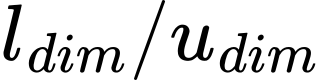 surpasses original “lower/upper bound”, before its groups to innovative
 . Moreover, in order to emphasise the concept of elitism, the most exceptional player or soldier identified in each iteration is retained and regarded as an elite. In addition to considering the many aspects of the issue in question, the computational complexity of the proposed method is contingent upon factors such as extent of populace and the maximum number of iterations. In order to calculate the average distance of each of the responses and all other solutions, it is necessary to compare each solution with each subsequent solution. Therefore, the computationally complex nature of this process, given a population size of
 , is

Chicken Swarm OptimizationStep 3.4.2: Chicken Swarm Optimization
In Chicken Swarm Optimization, roosters with better fitness values receive priority when accessing food. This behaviour is represented by allowing higher-fitness roosters to explore a wider range of potential food sources. Equations (11) and (12) describe the corresponding update rules.
 (11)
 (12)
where 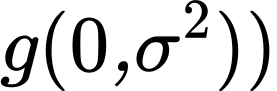 is a gaussian distribution with mean 0 and standard deviation
 .
 , which is utilized to avoid zero-division-error, is minimum continuous in computer.
 a rooster’s index, is randomly selected from rooster’s group,
 is suitability value of corresponding
 . Furthermore, these chickens would exhibit opportunistic behaviour by engaging in the random pilfering of high-quality sustenance procured by their counterparts. It is worth noting that their assertive nature grants them a competitive edge in the pursuit of nourishment when compared to their more compliant counterparts. These behaviours can be expressed exactly as follows in Eq.(13), Eq.(14), and Eq.(15) respectively.
 (13)
 (14)
 (15)
where g is a uniformly distributed random number over [0,1]. 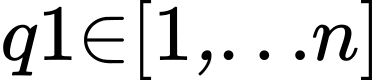 is the index of a rooster, which is ith hen’s group-mate, although
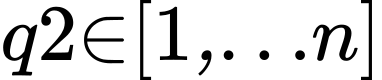 is an index of chicken (rooster or hen), which is arbitrarily selected from swarm.
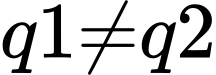 .
Obviously,  , thus
 . Assume
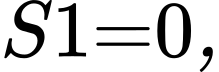 ith hen would feed for food tracked by other chickens. As disparity in fitness values between the two hens increases, the magnitude of S2 decreases and the disparity in their positions increases. Consequently, the hens exhibited a reduced propensity to appropriate food discovered by their fellow birds. The disparity between the formulaic representations of
 and
 can be attributed to the presence of intra-group contests. To facilitate ease of analysis, the relative fitness values of chickens with respect to rooster are simulated through inter-chicken competitions within a group. Assuming that
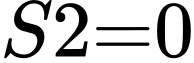 , each individual hen, denoted by the variable ith would engage in foraging activities only inside its respective region. Best value of rooster is distinct within particular group. Therefore, when the fitness value of the ith hen decreases, the approximation of
 to 1 becomes closer and distance between positions of ith hen and its group-mate rooster decreases. Therefore, it is anticipated that hens with higher dominance levels will have a higher probability of devouring the available food compared to their more submissive colleagues.
Chicks move around their mothers while searching for food. Equation (16) models this movement.
 (16)
where 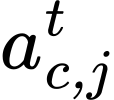 represents the position of ith chick’s mother
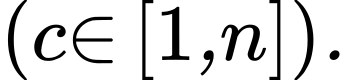
 is a limit, chick would pursue its mother to feed for food. Assume separate changes,
 of every chick would randomly choose amid 0 and 2.
Three tier voter networks
The selected features enter the voting-classifier stage. Predictions from RNN, TSRLSTM and CNN models are combined to determine the final classification. Figure 5 shows the source classification diagram.
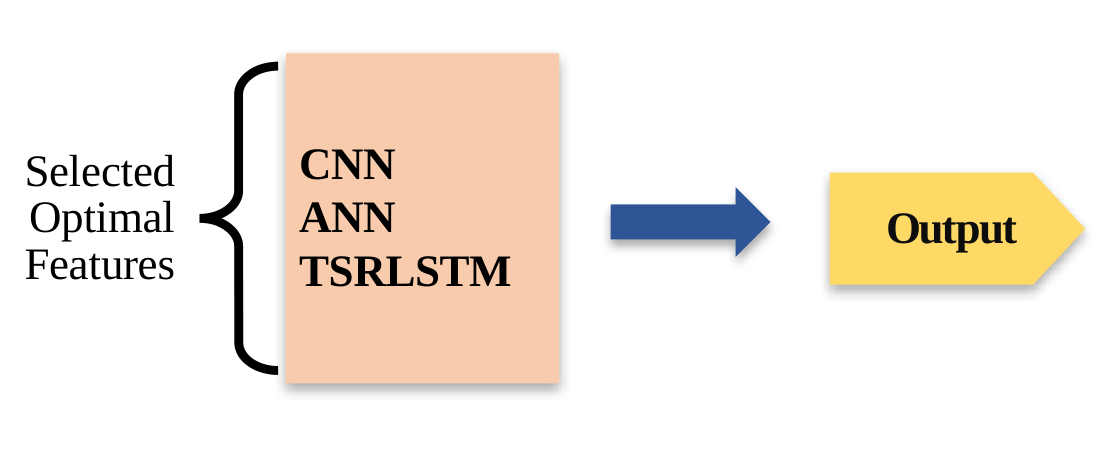
Figure 5: Three tier voting network classification in Proposed methodology
RNN
The Recurrent Neural Network architecture is specifically built to process sequential data by incorporating information from preceding inputs inside the sequence. In contrast with standard feedforward neural networks, recurring neural networks (RNNs) contain loops which allow the retention of information. Recurrent connections are distinguished by their capacity to establish self-referential connections, facilitating the exchange of information between consecutive stages within a specified sequence. The notion of a hidden state holds significant importance within the domain of Recurrent Neural Networks (RNNs). The hidden state functions as a mechanism for retaining and storing information derived from previous inputs, hence exerting an impact on subsequent predictions. Weight sharing is a technique employed by RNN whereby the weights are shared across all temporal steps. This enables the model to effectively learn and generalise patterns from sequences of varying durations.
CNN
CNNs are prevalent form of Artificial Neural Network that are commonly used in the field of Deep Learning. Convolutional layers are composed of filters, commonly referred to as kernels, which are employed for analysing the input information by combining mechanisms. Filters play a crucial part in the process of finding and discerning patterns and distinctive qualities within the input data. They have demonstrated significant efficacy in tasks related to the recognition of images and data. Pooling layers are employed in neural networks for the purpose of reducing the geographic extent of the input data via a collection of outputs from many neurons within an established input region. Fully connected layers, also known to be dense layers, are an essential part of neural networks. They facilitate connections between every neuron in a given layer and every neuron in the subsequent layer. This architectural arrangement closely resembles the structure of traditional neural networks. Activation functions are used in neural networks to provide non-linear characteristics, henceforth allowing network to acquire knowledge of intricate patterns and enhance the model’s expressive capabilities. Artificial neural networks demonstrate the ability to gather on their own and extract special characteristics from raw data, which renders them highly effective in various applications which demand an in-depth awareness of spatial relationships within the input data.
TSRLSTM
Two-Stage Residual Long Short-Term Memory (TSRLSTM) combines Long Short-Term Memory with residual learning.
LSTM
It is a specific form of RNN structure that has been developed to effectively mitigate the issue of the vanishing or exploding gradient, which is frequently observed in conventional RNNs. This framework is particularly suitable for the analysis and manipulation of data sequences, including but not limited to time series and natural language data. LSTM networks possess distinctive gating mechanisms that enable them to preserve information through extended sequences, rendering them highly proficient in tasks that necessitate the modelling of long-term dependencies.
Residual Learning
Residual Learning, introduced by the ResNet architecture, involves using shortcut connections to skip one or more layers in a neural network. This helps in easier training and addresses the vanishing gradient problem, allowing the network to learn residuals (differences) instead of complete transformations. The idea is that the network learns to refine the identity mapping, making it easier to optimize deep networks. These two stages LSTM and Residual Learning combine to form a TSRLSTM.
Results and Discussion
Performance Metrics
Accuracy
To determine a test’s accuracy, the results from all the cases are examined and the percentage of true positives and negatives are determined.
 (17)
Precision
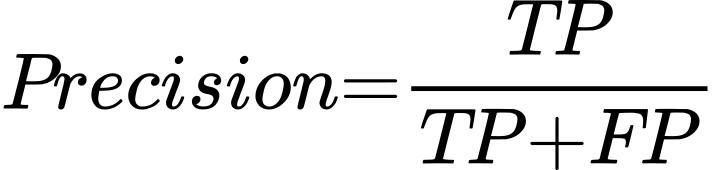
Precision is the proportion of predicted positive instances that are true positives.
 (18)
Recall
Recall is the proportion of actual positive instances that are correctly identified.
 (19)
F-score
The F-score combines precision and recall to express a balance between the two measures.
 (20)
Specificity
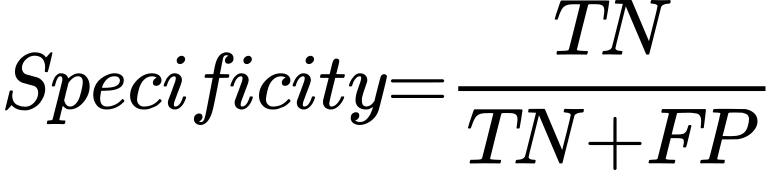
Specificity is the proportion of actual negative instances that are correctly classified.
 (21)
FDR
FDR is the “False Discovery Rate”. It is a statistical measure that quantifies the ratio of falsely identified positive data points to the overall count of positively identified data points
 (22)
FNR
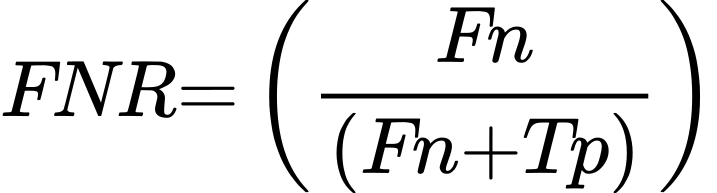
FNR denotes the “False-Negative Rate”. It can be described as the proportion of misclassified instances that are falsely labelled as negative, relative to the total number of positive instances.
 (23)
FPR
FPR denotes the “False-Positive Rate”. It can be defined as the proportion of incorrectly classified positive data to the total number of negative data.
 (24)
MCC
MCC denotes Matthews correlation coefficient. It evaluates binary classification using true positives  , true negatives
 , false positives
 and false negatives
 .
 (25)
NPV
Negative predictive value is the proportion of predicted negative instances that are true negatives.
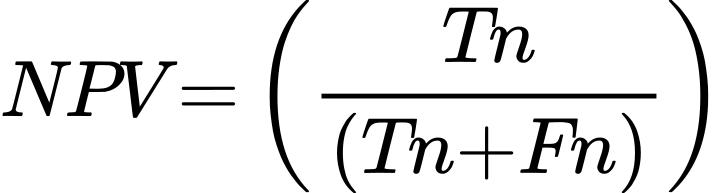 (26)
Table 2: Comparative analysis of performance metrics
LSTM | BiLSTM | LeNet-5 | ResNet | GRU | Proposed | |
Sensitivity | 0.822 | 0.827 | 0.89 | 0.912 | 0.925 | 0.971 |
Specificity | 0.976 | 0.976 | 0.994 | 0.994 | 0.994 | 0.997 |
Accuracy | 0.955 | 0.954 | 0.975 | 0.984 | 0.987 | 0.991 |
Precision | 0.815 | 0.818 | 0.879 | 0.906 | 0.914 | 0.968 |
Recall | 0.824 | 0.822 | 0.887 | 0.899 | 0.918 | 0.967 |
FMeasure | 0.826 | 0.828 | 0.88 | 0.905 | 0.92 | 0.97 |
NPV | 0.976 | 0.986 | 0.988 | 0.995 | 0.994 | 0.994 |
FPR | 0.042 | 0.049 | 0.023 | 0.023 | 0.019 | 0.019 |
FNR | 0.198 | 0.205 | 0.138 | 0.119 | 0.097 | 0.054 |
MCC | 0.796 | 0.799 | 0.861 | 0.893 | 0.904 | 0.955 |
Table 1 presents evaluation metrics for several models, including LSTM, BiLSTM, LeNet-5, ResNet, GRU, and a model that has been developed. The performance metrics are “Sensitivity, specificity, accuracy, precision, recall, F1 score, NPV, FPR, FNR, and MCC. Sensitivity measures the proportion of actual positives correctly identified, while specificity measures the proportion of actual negatives correctly identified. The proposed model of Sensitivity and Specificity are 97.1%, and 99.7%, indicating its ability to detect positives and negatives effectively. The proposed model achieves an accuracy of 99.1% indicating it is the highest accuracy overall classification performance. Precision signifies number of true positives amid completely predicted positives, though recall actions number of true positives among all actual positives. The proposed model exhibits high precision of 96.8% and recall of 96.7%, indicating a good balance between avoiding false positives and capturing true positives. The F1 score combines “precision” and “recall” into a single measure. The proposed method has an F1 score of 97%, indicating strong overall performance in terms of both “precision” and “recall”. NPV represents the proportion of true negatives among all predicted negatives. Proposed model shows high NPV of 0.994, represents a low rate of false negatives. Both FPR and FNR are important in evaluating the model’s performance. The proposed model has a very low FPR of 0.019 and FNR of 0.054, demonstrates a good ability to minimize false positives and false negatives. The proposed model achieves the highest MCC of 0.955, represents strong predictive performance and good balance between the classes.
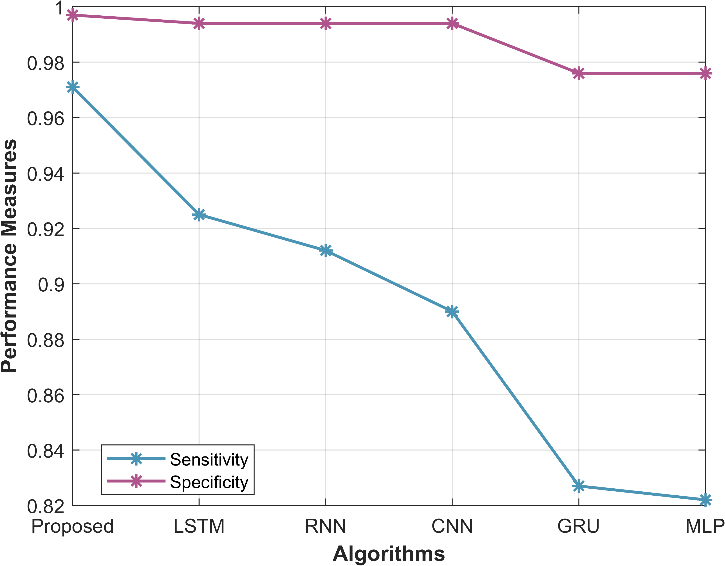
Figure 6: Graphical representation of Sensitivity and Specificity
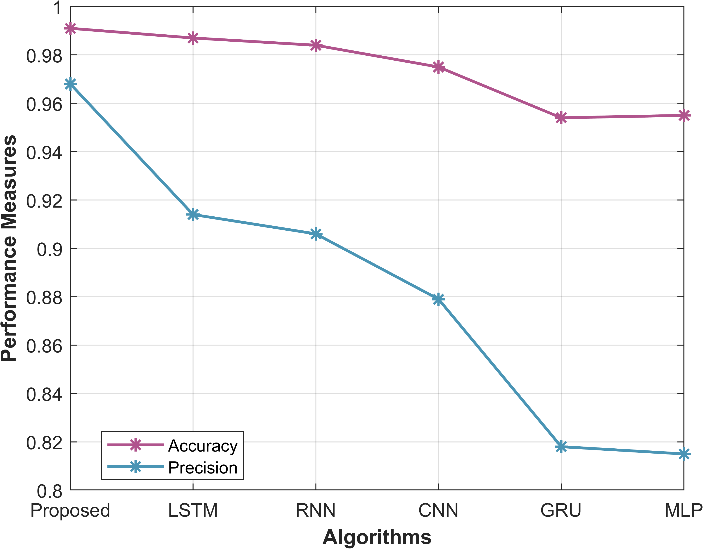
Figure 7: Graphical representation of Accuracy and Precision
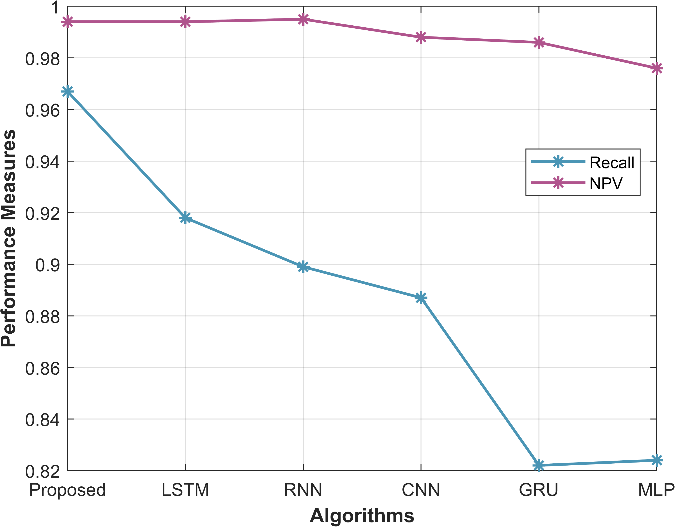
Figure 8: Graphical representation of Recall and NPV
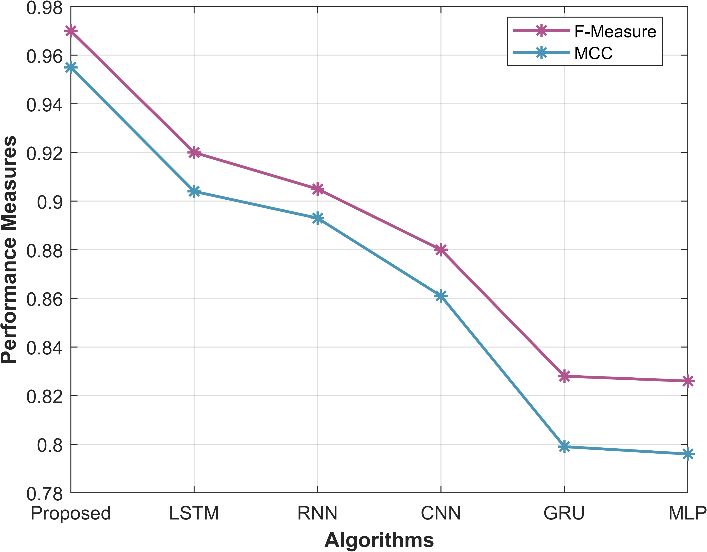
Figure 9: Graphical representation of F-Measure and MCC
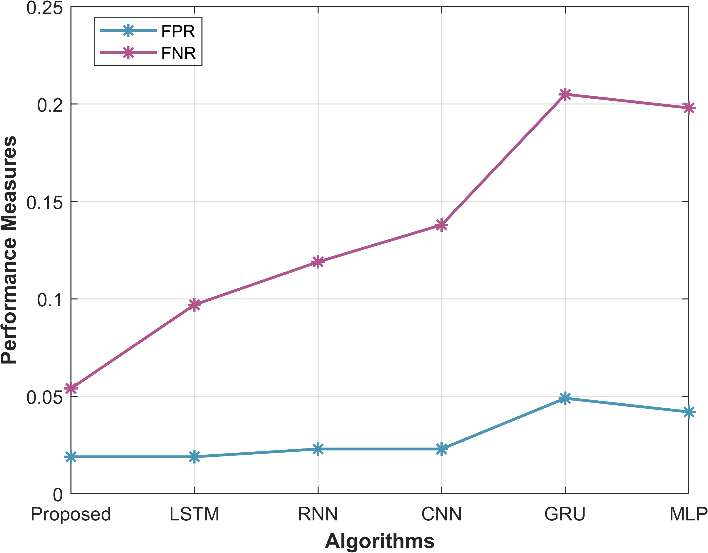
Figure 10: Graphical representation of FPR and FNR
The five result charts show sensitivity and specificity, accuracy and precision, recall and NPV, F-measure and MCC, and FPR and FNR respectively.
Conclusion
The paper conducted an examination of sentiment analysis on social media data pertaining to organic food brands, employing a hybrid deep learning methodology. A range of deep learning models, namely TSRLSTM, CNN, and RNN were assessed using diverse performance criteria. The three-tier voter network (CROA) as proposed, exhibited improved performance across all criteria in comparison to the other models. The achieved performance metrics for the system were as follows: sensitivity (97.1%), specificity (99.7%), accuracy (99.1%), precision (96.8%), recall (96.7%), F1 score (97.0%), negative predictive value (99.4%), and MCC (95.5%). Furthermore, it exhibited a low rate of false positives (1.9%) and false negatives (5.4%). Additional investigation could be conducted to examine the integration of advanced deep learning architectures, thereby leveraging the respective advantages of diverse models in order to get enhanced levels of accuracy and robustness. In future, the use of image and video analysis pertaining to organic food companies on social media, in combination with textual research, has the potential to yield an additional complete understanding of public mood.
References
Zachlod, C., Samuel, O., Ochsner, A. and Werthmüller, S., 2022. Analytics of social media data–State of characteristics and application. Journal of Business Research, 144, pp.1064-1076.
Tandon, A., Dhir, A., Kaur, P., Kushwah, S. and Salo, J., 2020. Why do people buy organic food? The moderating role of environmental concerns and trust. Journal of Retailing and Consumer Services, 57, p.102247.
Borghoff, L.M., Strassner, C. and Herzig, C., 2023. Processors’ understanding of process quality: a qualitative interview study with employees of organic dairies in Germany and Switzerland. British Food Journal, (ahead-of-print).
Hansen, N., Kupfer, A.K. and Hennig-Thurau, T., 2018. Brand crises in the digital age: The short-and long-term effects of social media firestorms on consumers and brands. International Journal of Research in Marketing, 35(4), pp.557-574.
Bhowmick, S.S., 2023. A Healthy lifestyle is a new paradigm shift of today’s Consumers-A comprehensive study on Consumer Perception on Organic Food Consumption in Mumbai, India.
Liu, L., Dzyabura, D. and Mizik, N., 2020. Visual listening in: Extracting brand image portrayed on social media. Marketing Science, 39(4), pp.669-686.
Pocol, C.B., ŠEDÍK, P. and Ristovski, D., 2017. Tendencies and characteristics of organic food consumption in Romania. Geographica Timisiensis, 26(1-2), pp.5-14.
Misirlis, N. and Vlachopoulou, M., 2018. Social media metrics and analytics in marketing–S3M: A mapping literature review. International Journal of Information Management, 38(1), pp.270-276.
Chu, K.M., 2018. Mediating influences of attitude on internal and external factors influencing consumers’ intention to purchase organic foods in China. Sustainability, 10(12), p.4690.
Cheng, S.J., Jia, H.X., Weng, W.P.P. and Wang, L., 2023. Factors influencing consumers’ purchase intention on organic foods via a Theory of Planned Behaviour approach. JOURNAL OF TOURISM, CULINARY AND ENTREPRENEURSHIP (JTCE), 3(1), pp.98-116.
Ahmed, N., Li, C., Khan, A., Qalati, S.A., Naz, S. and Rana, F., 2021. Purchase intention toward organic food among young consumers using theory of planned behavior: role of environmental concerns and environmental awareness. Journal of Environmental Planning and Management, 64(5), pp.796-822.
Seo, E.J. and Park, J.W., 2018. A study on the effects of social media marketing activities on brand equity and customer response in the airline industry. Journal of Air Transport Management, 66, pp.36-41.
Bilgin, Y., 2018. The effect of social media marketing activities on brand awareness, brand image and brand loyalty. Business & management studies: an international journal, 6(1), pp.128-148.
Drus, Z. and Khalid, H., 2019. Sentiment analysis in social media and its application: Systematic literature review. Procedia Computer Science, 161, pp.707-714.
Rajeswari, B., Madhavan, S., Venkatesakumar, R. and Riasudeen, S., 2020. Sentiment analysis of consumer reviews–a comparison of organic and regular food products usage. Rajagiri Management Journal, 14(2), pp.155-167.
Masih, J., 2021. Understanding health-foods consumer perception using big data analytics. Journal of Management Information and Decision Sciences, 24, pp.1-15.
Pilař, L., Kvasničková Stanislavská, L. and Kvasnička, R., 2021. Healthy food on the twitter social network: Vegan, homemade, and organic food. International journal of environmental research and public health, 18(7), p.3815.
Boobalan, K., Nachimuthu, G.S. and Sivakumaran, B., 2021. Understanding the psychological benefits in organic consumerism: An empirical exploration. Food Quality and Preference, 87, p.104070.
Khan, R.K. and Shafie, R., 2022. DETERMINANTS OF PURCHASE INTENTION OF ORGANIC FOOD FROM THE PERSPECTIVE OF ACADEMICS IN BANGLADESH. International Journal of Social Science Research, 4(3), pp.154-167.
Cite This Work
To export a reference to this article please select a referencing stye below:

Academic Master Education Team is a group of academic editors and subject specialists responsible for producing structured, research-backed essays across multiple disciplines. Each article is developed following Academic Master’s Editorial Policy and supported by credible academic references. The team ensures clarity, citation accuracy, and adherence to ethical academic writing standards
Content reviewed under Academic Master Editorial Policy.