
Authors Nur Haziqah Syazni Mohd Hatta, Tze Mei Kuan, Azrul Mohd Ariffin, Nik Hakimi Nik Ali and Wong Jee Keen Raymond
Abstract
This paper examines a proposed combination of partial discharge (PD) diagnostics, particularly phase-resolved partial discharge (PRPD), and time domain reflectometry (TDR) for power cable fault detection. PRPD patterns help distinguish discharge mechanisms, while reflected pulses provide information about impedance discontinuities and their locations. A 300 m XLPE cable model in MATLAB Simulink provides the setting for discussing the combined approach. Principal component analysis (PCA), artificial neural networks (ANNs) and other classifiers are considered as tools for analysing PD measurements. The paper brings together a proposed simulation arrangement and illustrative findings from cited studies; it does not establish an independently validated hybrid diagnostic system. The intended benefits are faster fault investigation, more targeted cable replacement and lower maintenance costs. These benefits require further experimental evaluation.
Keywords Cable fault detection, partial discharge, time domain reflectometry, insulation degradation, XLPE
1. Introduction
Power cable insulation is essential to the performance of an electrical distribution system. Deterioration can affect both network reliability and consumers, particularly when a developing defect leads to a major breakdown. Detecting insulation problems early can support maintenance planning and reduce the disruption associated with cable repair. A useful diagnostic method must therefore provide information that helps engineers distinguish a developing defect from normal cable behaviour and identify where further investigation is needed.
Partial discharge measurement is one approach to assessing insulation condition [1–5]. PD activity provides information about discharge behaviour and the defects that may produce it [6–10]. Phase-resolved partial discharge analysis relates the phase angle φ, apparent charge q and number of pulses n. The resulting φ–q–n patterns can help distinguish discharge geometries and mechanisms [11,12]. Interpretation depends on the measurement arrangement, noise level and quality of the data; a pattern alone does not establish every aspect of a cable fault.
Time domain reflectometry examines wave propagation and reflections associated with impedance changes [13–17]. A transmitted pulse can be reflected by a cable end, joint or discontinuity. Its travel time helps estimate the location of the reflecting feature when the propagation velocity is known. Changes in reflection magnitude may also indicate degradation, but require comparison with a suitable baseline. TDR is useful for locating discontinuities, although a reflection does not uniquely identify the physical defect or prove that every joint is faulty.
These capabilities suggest a complementary diagnostic approach. PD measurements can support the identification of discharge behaviour, while TDR can help locate the associated cable section. Combining the information could shorten fault investigation and improve maintenance decisions. The proposed hybrid approach must nevertheless distinguish intentional impedance changes, such as sound joints, from changes associated with deterioration.
This paper discusses that combination using a MATLAB Simulink cable model and findings from earlier investigations. Surface, void and corona discharge patterns illustrate the classification problem. Pulse reflections and TDR traces illustrate the localisation problem. The discussion identifies how these elements could contribute to a common diagnostic workflow, while recognising that a complete experimental validation of the integrated system remains future work.
2. Literature Review
IEC 60270 provides a framework for conventional partial discharge measurement; it should not be treated as approval of a particular localisation method. Research has extended PD measurement through different sensors, signal processing techniques and localisation arrangements. Such developments are relevant to utilities seeking to identify insulation deterioration before it results in an interruption of supply.
Mor et al. [18] investigated localisation at cable ends in off-line, single-sided PD cable measurements. Their work provides relevant pulse-reflection examples for the proposed combination. Raymond et al. [19] compared PD classification under different levels of noise contamination, including feature extraction and intelligent classification. PCA is a dimensionality-reduction and feature-extraction method, whereas SVM, ANN and adaptive neuro-fuzzy inference systems (ANFIS) can act as classifiers. Their roles should be distinguished when interpreting the comparison or implementing a diagnostic workflow in MATLAB.
TDR has also been investigated for cable fault detection, impedance discontinuities and insulation degradation [13–17]. Cheng et al. [20] used random reflections in TDR signals for distributed temperature sensing with an unmodified coaxial cable. This demonstrates another use of reflected signals, rather than showing that TDR is unaffected by temperature or environmental conditions. Cable type, temperature and propagation characteristics remain relevant when interpreting a trace.
The literature therefore supports investigating PD and TDR together. PD classification could help describe the discharge mechanism, while TDR could indicate the location of a change in cable condition. A combined study should evaluate both the advantages and limitations of the individual techniques. It should also use a defined test sequence, consistent calibration and appropriate reference measurements to avoid interpreting measurement artefacts as defects.
3. Methodology
Figure 1 outlines the proposed process for combining PD and TDR in a cable fault investigation. The sequence links the collection of diagnostic signals with their analysis and interpretation.
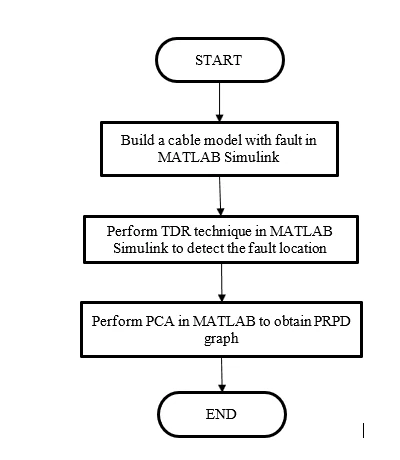
Figure 1. Proposed PD and TDR combination process.
Figure 2 shows the MATLAB Simulink cable-system model discussed in this paper. The model represents a 300 m, single-core, 240 mm², 11 kV XLPE cable. The localisation concept examines PD pulses associated with the near and far ends of the cable, drawing on the pulse discrimination approach in [18]. A broadband capacitive coupler is considered at the near end to sense pulses with limited waveform distortion. The coupler discussion draws on [21], with a reported bandwidth from 3.5 kHz to 100 MHz. These specifications describe the proposed measurement arrangement and should be distinguished from independently verified performance of a completed hybrid system.
The reflection coefficient ρ depends on the impedance presented to the cable and on angular frequency ω, written as w in the original equation. Equation (1) gives the resonant-impedance expression used in the model, where j is the imaginary unit and Z₀ is the cable characteristic impedance.

Equation (1). Frequency-dependent reflection coefficient.
The equivalent resonant RLC component values considered are R = 14 Ω, L = 40 μH and C = 333 pF. Z₀ denotes the cable characteristic impedance; it is distinct from the impedance of the added resonant RLC network. The reflection behaviour depends on the relationship between these impedances.
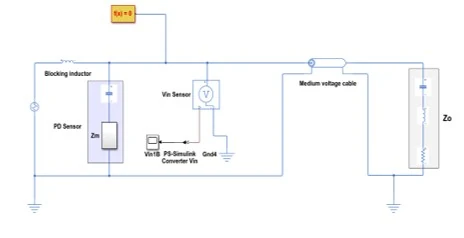
Figure 2. Cable-system model in MATLAB Simulink.
Figure 3 shows a broadband coupler circuit with a high-pass response. Equation (2) gives the transfer-function expression used in the source model. Vin and Vout are the input and output voltages; R, R₁, C and C₁ denote circuit components.

Equation (2). Coupler transfer function.
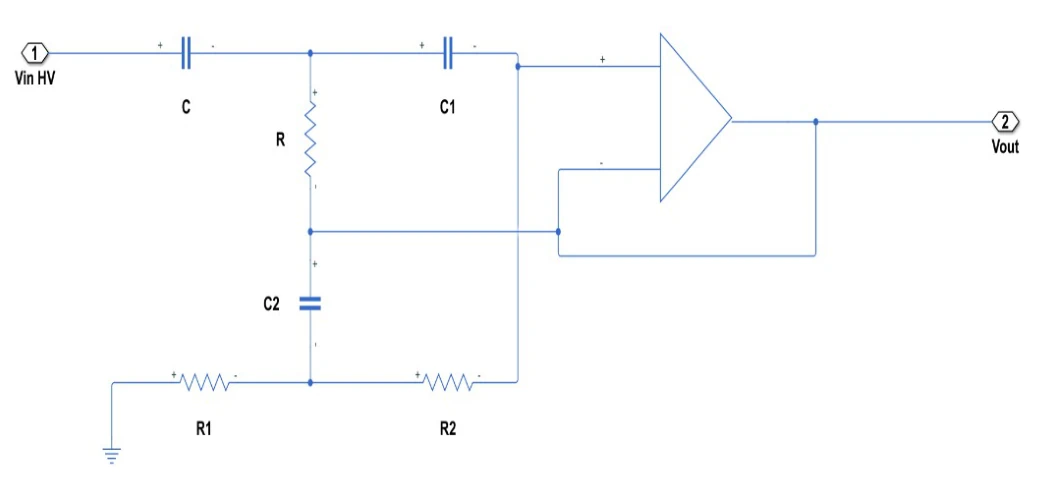
Figure 3. Single high-pass double-T filter circuit.
The filtering arrangement is intended to pass the frequency components needed for PD detection while limiting unwanted components. Sensor and filter selection must also account for voltage requirements, pulse fidelity and component ratings. A high-pass response alone does not establish that a complete measurement system is safe or accurately calibrated.
The initial cable-model discussion considers a single cable without joints. Table 1 summarises discharge arrangements described in [1] and used to explain the three defect categories. These are illustrative defect-generation arrangements, rather than unique diagnostic definitions for all cable installations.
Table 1. Discharge types and illustrative defect arrangements [1].
No | Type of defect | Recognizable defects |
1 | Surface discharges | A long copper strip attached to the termination |
2 | Void discharges | Epoxy resin as sample of defects |
3 | Corona discharges | Metal connected to HV source and plane electrode connected to ground |
The proposed analysis uses PD data to extract features for classification. PCA can reduce the dimensionality of the measurements before a classifier is applied. SVM, ANN and ANFIS provide alternative classification approaches for comparison; PCA itself is not a separate supervised classifier. In parallel, TDR provides information about reflection timing and impedance changes. Combining the outputs would allow a proposed defect classification to be considered alongside a likely cable location.
4. Results and Discussion
The examples in this section illustrate the proposed approach using discharge-pattern and reflection behaviour discussed in the cited literature. Raymond et al. [19] show why noise contamination matters when classifying PD measurements. Their comparisons support considering PCA-derived features with classifiers such as SVM and ANN. They do not establish a universally superior classifier for every cable, sensor or noise environment.
Figure 4 illustrates a surface-discharge PRPD pattern. In this type of arrangement, charge magnitude depends partly on electrode geometry. The distribution over the positive and negative voltage half-cycles may be asymmetric. Such features are useful for comparison with other patterns, but should be interpreted in the context of the measurement setup [1,19].
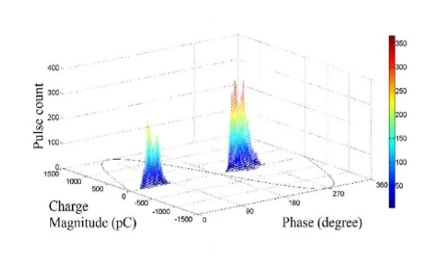
Figure 4. Illustrative surface-discharge PRPD pattern.
Figure 5 illustrates a void-discharge pattern. The cavity geometry and depth affect the recorded charge. The example shows activity on both voltage half-cycles, approximately within phase ranges 330°–90° and 150°–270°. These ranges describe the illustration and should not be treated as fixed limits that apply to every internal discharge.
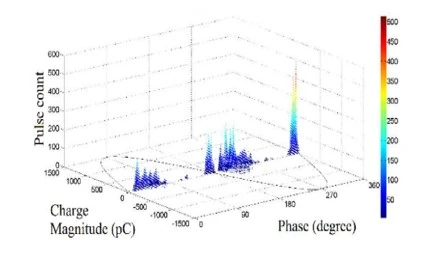
Figure 5. Illustrative void-discharge PRPD pattern.
Figure 6 illustrates corona discharge. Positive and negative corona can differ in magnitude and repetition rate. In the example discussed here, positive activity is concentrated near 90° and negative activity near 270°, with a larger positive-cycle charge magnitude. Applied voltage and electrode arrangement influence these patterns, so their asymmetry must be considered together with the test conditions.
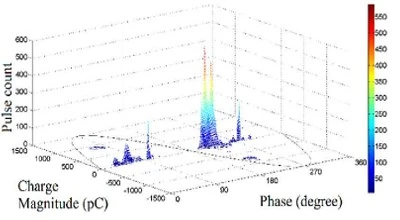
Figure 6. Illustrative corona-discharge PRPD pattern.
Visual inspection alone may be insufficient when patterns overlap or contain substantial noise. In [19], PCA-based features used with ANN and SVM supported effective classification under the investigated conditions. ANFIS performance depended on the selected features and classifier configuration. Training, normalisation and validation therefore matter alongside the choice of algorithm. A future integrated diagnostic system should test its selected classifier with independent data rather than infer its accuracy from these example patterns.
Figures 7–9 illustrate pulse-reflection behaviour relevant to near-end and far-end discrimination [18]. P1 denotes the direct pulse and P2 its reflection. Surface discharges can be generated using a copper strip attached to an indoor termination. The resonant measurement impedance affects the pulse shape and frequency spectrum, allowing differences between direct and reflected signals to be examined.
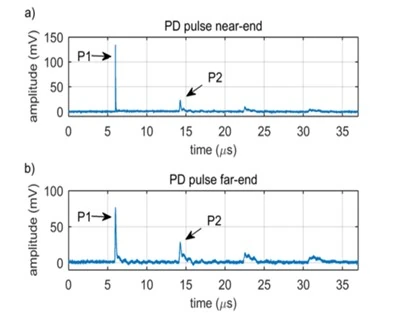
Figure 7. PD pulses with multiple reflections originating at (a) the near end and (b) the far end; examples discussed in relation to [18].
Figures 8 and 9 compare direct and reflected pulses and their frequency spectra. Panels (a) and (c) show pulse waveforms, while panels (b) and (d) show the corresponding spectra. In the near-end example, the reflected pulse exhibits a frequency notch that helps distinguish it from the direct pulse. The diagnostic feature is the relationship between the two spectra, rather than a general assumption that every decrease in amplitude indicates a fault.
In the far-end example, both pulse spectra exhibit a notch at a similar frequency. This provides a different signature from the near-end case and can assist pulse-origin discrimination [18]. Applying this principle to another cable requires consideration of attenuation, bandwidth, propagation and the measurement impedance. The examples illustrate a mechanism for discrimination rather than a measured success rate for the proposed combined system.
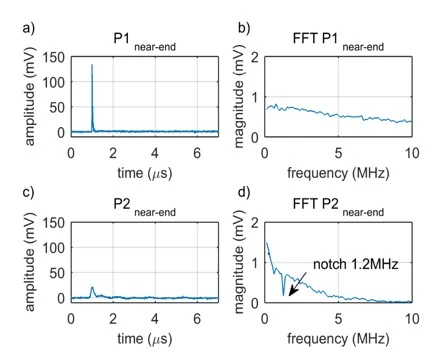
Figure 8. Near-end example: P1 direct pulse (a) and spectrum (b); P2 reflected pulse (c) and spectrum (d) [18].
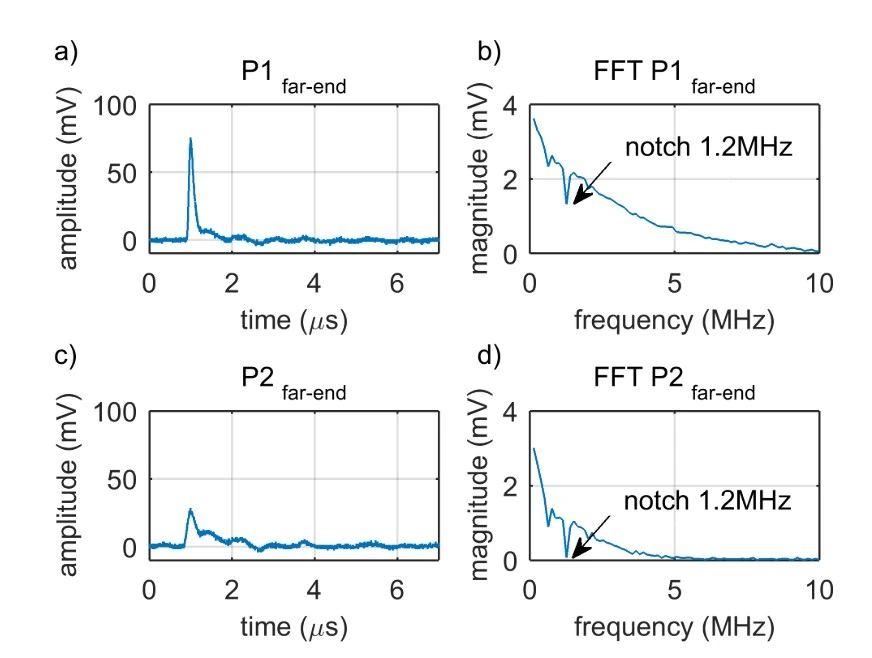
Figure 9. Far-end example: P1 direct pulse (a) and spectrum (b); P2 reflected pulse (c) and spectrum (d) [18].
TDR traces provide a complementary view of cable discontinuities. Figures 10 and 11 illustrate 300 m cable arrangements with joints, considered in relation to the modelling and degradation studies in [16,17]. Such traces can be analysed in MATLAB Simulink to compare reflection locations and changes in magnitude.
In Figure 10, a response occurs near the joint at 100 m. Figure 11 considers joints at approximately 100 m and 200 m. These locations show how known impedance changes appear along the cable. Because a sound joint can also produce a reflection, the presence of a peak does not by itself prove degradation. Identifying a damaged section requires comparison with a healthy reference or a validated model, together with the other available diagnostic evidence.
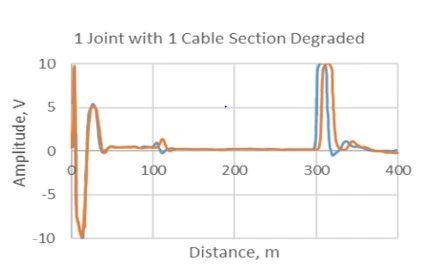
Figure 10. Illustrative TDR response for a 300 m cable with one joint and a degraded section [16,17].
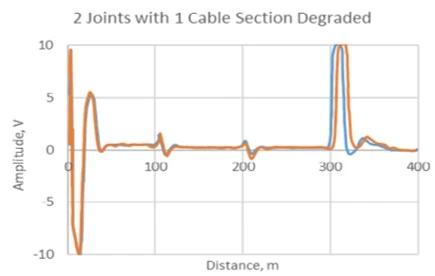
Figure 11. Illustrative TDR response for a 300 m cable with two joints [16,17].
Taken together, the examples support the rationale for combining discharge classification with reflection-based localisation. They do not quantify the time saved, the maintenance cost reduction or the probability of preventing a breakdown. Demonstrating those outcomes would require an integrated implementation, a defined set of healthy and defective cables, and comparison with the individual techniques under equivalent conditions.
5. Conclusion
This paper presents a proposed hybrid approach using PD diagnostics and TDR for power cable fault detection. The MATLAB Simulink arrangement provides a framework for discussing a 300 m XLPE cable, a PD coupler and reflected signals. Surface, void and corona PRPD patterns illustrate discharge classification, while pulse spectra and TDR traces illustrate the localisation information that could complement it. PCA can support feature extraction, with ANN or other suitable algorithms providing classification.
A combined workflow could help utilities interpret the nature and likely location of a developing insulation problem. The value lies in considering the two types of evidence together, while accounting for noise, sound joints and other sources of reflection. Neither a PRPD pattern nor a TDR peak should be treated as a complete diagnosis in isolation.
Further work should implement and validate the full arrangement using controlled defects and independent test data. It should measure localisation error, classification accuracy, robustness to noise and the time required for diagnosis. Only then can the proposed reductions in repair time, cable replacement cost and supply interruptions be assessed reliably.
References
[1] M. R. Rahimi, R. Javadinezhad, and M. Vakilian, “DC Partial Discharge Characteristics for Corona, Surface and Void Discharges,” pp. 260–263, 2015.
[2] E. Manzoor and A. Khan, “Measurement Of Partial Discharge ( PD ) In High Voltage Power Equipment,” vol. 2014, pp. 1–8, 2014.
[3] D. Kavitha, N. Alex, and T. N. P. Nambiar, “Classification and study on factors affecting partial discharge in cable insulation,” J. Electr. Syst., vol. 9, no. 3, pp. 346–354, 2013.
[4] A. Villa, L. Barbieri, and R. Malgesini, “Precise Partial Discharge Localization in Axisymmetric Geometries,” pp. 606–612, 2019.
[5] H. D. Ilkhechi, M. H. Samimi, and R. Yousefvand, “Generation of acoustic phase-resolved partial discharge patterns by utilizing UHF signals,” Electr. Power Energy Syst., vol. 113, no. April, pp. 906–915, 2019.
[6] L. Stastny and R. Mego, “Selectivity of inductive coupling for partial discharge measurement in MV cables,” Diagnostika, pp. 1–4, 2020.
[7] N. H. N. Ali, “Partial Discharges Identification and Localisation within Transformer Windings,” vol. 27, no. 6, pp. 2095–2103, 2020.
[8] A.M. Gataullin, “High Voltage Electrical Insulators Diagnostics by Partial Discharges Characteristics,” no. Cd, pp. 426–430, 2020.
[9] J. V. Klüss and A. Elg, “Challenges Associated with Implementation of HFCTs for Partial Discharge Measurements,” 2020.
[10] Y. Zhou, “A Study on the Propagation Characteristics of Partial Discharge in Cable Joints Based on the FDTD Method,” vol. 8, 2020.
[11] M. Karimi, M. Majidi, H. Mirsaeedi, M. M. Arefi and M. Oskuoee, “A Novel Application of Deep Belief Networks in Learning Partial Discharge Patterns for Classifying Corona, Surface, and Internal Discharges,” IEEE Transactions on Industrial Electronics, 67(4), pp. 3277–3287, 2020. DOI: 10.1109/TIE.2019.2908580.
[12] M. Zhou and Z. Tang, “Research on Failure Identification of Partial Discharge Ultrasonic Signal Based on GFCC,” IEEE Electrical Insulation Conference, pp. 412–416, 2020. DOI: 10.1109/EIC47619.2020.9158683.
[13] D. Kameyama, K. Iokibe, and Y. Toyota, “Preliminary Investigation of Impedance Discontinuity Detection on Wire Network Using Sequence Time Domain Reflectometry,” Proc. 2020 Int. Symp. Electromagn. Compat. – EMC Eur. EMC Eur. 2020, 2020.
[14] F. Auzanneau, “Multiple Soft Defect Signature Magnification in Electrical Cables with Binary Time-Domain Reflectometry,” IEEE Sensors Letters, 4(7), 2020.
[15] T. M. Kuan, S. Sulaiman, A. M. Ariffin, and W. M. S. Wan Shamsuddin, “Verification of MATLAB/simulink power cable modelling with experimental analysis,” Indones. J. Electr. Eng. Comput. Sci., vol. 11, no. 2, pp. 622–629, 2018.
[16] T. M. Kuan, A. M. Ariffin, and M. M. B. Sedau, “Advancement of TDR technique for locating power cable insulation degradation,” Int. J. Adv. Sci. Eng. Inf. Technol., vol. 7, no. 6, pp. 1976–1982, 2017. DOI: 10.18517/ijaseit.7.6.2315.
[17] T. M. Kuan, A. M. Ariffin, and W. J. K. Raymond, “Detection of multiple degradations within polymeric cable with multiple joints,” Int. J. Emerg. Trends Eng. Res., vol. 8, no. 1 Special Issue 1, pp. 120–128, 2020.
[18] A. R. Mor, P. H. F. Morshuis, P. Llovera, V. Fuster and A. Quijano, “Localization techniques of partial discharges at cable ends in off-line single-sided partial discharge cable measurements,” IEEE Transactions on Dielectrics and Electrical Insulation, 23(1), pp. 428–434, 2016. DOI: 10.1109/TDEI.2015.005395.
[19] W. J. K. Raymond, H. A. Illias and A. H. A. Bakar, “Classification of partial discharge measured under different levels of noise contamination,” PLOS ONE, 12(1), e0170111, 2017. DOI: 10.1371/journal.pone.0170111.
[20] B. Cheng, L. Hua, W. Zhu, Q. Zhang, J. Lei, and H. Xiao, “Distributed temperature sensing with unmodified coaxial cable based on random reflections in TDR signal,” Meas. Sci. Technol., vol. 30, no. 1, 2019.
[21] A.Rodrigo, P. Llovera, V. Fuster, and A. Quijano, “High performance broadband capacitive coupler for partial discharge cable tests,” IEEE Trans. Dielectr. Electr. Insul., vol. 20, no. 2, pp. 479–487, 2013.
Cite This Work
To export a reference to this article please select a referencing stye below:

Academic Master Education Team is a group of academic editors and subject specialists responsible for producing structured, research-backed essays across multiple disciplines. Each article is developed following Academic Master’s Editorial Policy and supported by credible academic references. The team ensures clarity, citation accuracy, and adherence to ethical academic writing standards
Content reviewed under Academic Master Editorial Policy.