
INTRODUCTION
Background of the Study
Change is bound to happen if growth is desired, and of course, it is not an exception with marketing. Better ways to do things or go about things are being found daily with so many accolades to technology. Technology is ever-evolving, and it has come to stay. To this end, various businesses need to move at the nearest pace with technology to maintain and sustain relevance.
Technology has altered marketing, allowing for more customised and immersive consumer experiences as well as more integrated and targeted marketing efforts. In addition, changes have been made in more ways than just how people and businesses interact. New marketing technologies have been thoroughly included in the architecture and business operations, adding value to procurement and increasing revenues. According to Francesca (2019), 56% of marketers will decide where and how they will engage with their clients in 2022 using creativity and technology equally. 30% will give technology more weight than originality.
One of the examples of advanced technologies that are being deployed in recent times by brands or businesses for marketing to aid business expansion is Augmented Reality. Augmented Reality can be said to be ‘proven as imagined’. Disruptive technology, augmented reality (AR), improves the user experience while transforming marketing (Zhao D., Jun L. and Tianjiao W., 2022). There is a fundamental conflict between the amount of digital information available and the context in which it is used. Even though the reality is three-dimensional, the rich data that is currently available to inform decisions and actions is still limited to two-dimensional pages and displays. The quantity of information and insights produced by the billions of connected smart products (SCPs) in use today cannot be completely utilised because of the chasm between the physical and digital worlds (Michael & James, 2017). Through simulation, virtual reality (VR), a crucial immersive technology, creates a three-dimensional virtual environment with which users can interact. However, augmented reality (AR) technology addresses the lack of contact with real space.
It introduces a new visualisation approach that can add computer-generated content to the physical world, providing an interactive augmented reality for users (Yi & Eun, 2022). Existing studies have only sporadically described the broader scope of AR marketing. A recent and perhaps revolutionary marketing subdiscipline is AR Marketing. Similar to how the advent of the internet was accompanied by online marketing, search engine optimisation, and social media, AR-infused marketing activities can be categorised as a subset of AR Marketing (Philipp et al., 2022).
Today, augmented reality marketing is considered the lifeblood of start-up companies because it generates memorable and human experiences instead of typical promotional content. The widespread use of such ground-breaking technologies allows businesses to transition from providing conventional services to intelligent ones. Leading businesses are increasingly embracing AR technology because it provides a dynamic approach to communicating with customers (Riham, 2022).
Statement of the Problem
According to Yi & Eun (2022), the acceptance and continued use of these devices for shopping assistance by consumers must be examined to determine whether new technologies in marketing will succeed. While little research has been done on the technical aspects of AR, the majority of earlier studies have centered on understanding how AR technology is deployed. Furthermore, there has been some debate about a feature-centric view of technology, which underlines that choices made after adoption are affected by reflective processing by users who have preconceived beliefs and mindfully acknowledge and assess the features of the technology. Technology characteristics have a significant impact on user pleasure and perceived benefits, both of which are favourable for usage intentions and recurrent use. However, there is a dearth of studies on the influences of many elements and their consequences on users’ attitudes toward and intentions to use AR in the future.
Moreover, it is asserted that augmentation quality is essential to developing a favourable user experience, gauged by the perceived benefit of AR. However, several academics have emphasised the significance of user privacy control. They contend that the amount of data consumers are ready to divulge depends on the value they hope to obtain (Riham, 2022).
Research Aim
The aim of this research is to examine the effects of infusing enhanced technologies into marketing, Augmented Reality as a case study, such as Google products. This study will evaluate both sides, benefits, and challenges of how AR has helped Google to expand and grow over the years through quantitative analysis, creating awareness, educating other brands, and giving necessary recommendations on enhancing marketing operations. The study also seeks to define the distinctions between augmented reality and virtual reality and create more awareness about the success of AR in the business world.
Research Questions
The following research inquiries or questions will be addressed in this project:
RQ1: Are there effects of introducing enhanced technologies in marketing? How does AR stand out from modern marketing and media strategies?
RQ2: How can Augmented Reality solutions be integrated into marketing seamlessly optimising users’ usage of the technology?
RQ3: What are the various ways to manage these enhanced technologies in businesses so brands and users can fully utilise them?
Research Objectives
To significantly inform this study, the following are the objectives:
To evaluate and inform studies or the literature in the topic area determining the success rate of using Augmented Reality for marketing.
To investigate how users or customers perceive or are satisfied with using or adopting these technologies.
To recommend the use of advanced technologies such as AR among brands and business owners for marketing while discussing the challenges and possible remedies associated with these technologies.
Significance of the Study
It has been realised that many business owners and potential customers need to be made aware of using fast-evolving technologies such as AR, not to mention its integration into the business world. It has also been discovered that several brands have shied away from this topic of discussion because of the challenges that come with implementing and integrating these technologies to fit into brands’ business systems. This study would encourage brands to dive into tweaking marketing strategies with advanced technology solutions by relaying possible measures to the challenges that come with the use of advanced technologies such as AR. The results of this research would provide ideas and avenues for expanding various businesses with the use of advanced technologies for marketing. As a result of this research study, policymakers, and regulatory bodies could create and inspire conscious awareness on this topic while supporting brands to adopt these technologies. Furthermore, this study is expected to make room for further research and increased knowledge in marketing and technology.
Methodology Outline
For this thesis, the author uses both primary and secondary sources of information. The literature review only uses secondary data, which implies that it draws on previously gathered material to provide readers with a more comprehensive grasp of the topic. The conclusions and discussion, meanwhile, are supported by both primary and secondary evidence.
The main data was gathered through a poll using Facebook and Twitter, among other platforms, and Google Forms. Users made up the majority of the target group. For this purpose, a series of questions were put forth to ascertain the target groups’ attitudes towards the subject of the research as well as how augmented reality would be received if used for marketing. There were no location restrictions, as any customer could complete the online form.
The research method, in this case, is Correlational/Regression Analysis. This was done with the use of SPSS. The software was used to analyse, visualise and present the outcome of the analysis. Data were presented in tables and charts.
Structure of the Dissertation
There are five chapters in this dissertation.
The introduction is the first chapter and provides background information and an overview of the overall research study, as well as problem statements, aims, research questions, and objectives, as well as a description of the methodology and the research’s contributions, scope, and limitations.
The literature review, which summarises the theoretical, conceptual, and empirical underpinnings of the study, is covered in the second chapter.
The third chapter is the methodology section of the study shows the research approach and designs used, means of data collection and analysis, and description of data validity.
The fourth chapter discusses the results and findings of the data analysis.
The study ends with a concluding chapter which is the fifth chapter. A summary of the entire research study and recommendations is stated here.
LITERATURE REVIEW
This section of the research study gives a general overview of the research’s conceptual, theoretical and empirical frameworks. Several articles discuss augmented reality (AR) history, present applications, software and hardware utilised, issues and implications of using this technology in specific contexts, and recommendations for further research. Some studies of AR consider the types of deployment tools, ideas like marketing, and techniques for measuring AR performance (Villagram-Vizcarra et al., 2023).
Evolution of AR
The “ecosystem” of augmented reality (AR), which was initially systematised for 20 years, can be divided into “interfaces, tracking systems, tracking methodologies, displays, and augmented content” (Roxo & Brito, 2018). Interaction between the user and AR content is made possible by interfaces. According to Roxo & Brito (2018), these could be physical, group-based, hybrid, or multimodal. Tangibles interact with virtual content using tangible tools and objects, whereas collaboration uses numerous displays to enable multiple users to work simultaneously. Multimodal mixes tangible with organic user interfaces (such as gestures), whereas hybrids integrate complementary interfaces to increase the number of interaction points on a flexible platform.
In the last ten years, AR has developed and spread throughout society more and more. Mobile devices are becoming increasingly equipped with augmented reality (AR) capabilities, and these features are now mainly prevalent in everyday activities like educational settings, workplace settings, and a variety of leisure applications, probably most notably in games (Riar et al., 2021).
Marketing with Advanced technologies such as AR
According to Davidaviciene, Raudeliuniene & Virsilaite (2020), when businesses promote their goods or products, augmented reality technology can make the experience more appealing to customers by making it more intuitive and engaging. Because augmented reality technology is so dynamic, the user experience is frequently prioritised in addition to the product or service. Users can interact with virtual and physical objects in real time using augmented reality (AR) (Baratali et al., 2016).
The use of AR in creative marketing techniques is referred to as augmented reality marketing (ARM). According to the search study conducted by Villagram-Vizcarra et al. (2023), Marketing is one of the areas where augmented reality (AR) is being deployed, among others such as entertainment, education, medicine and industry which could be more encouraging. This suggests that relatively few brands or individuals know about and adopt this advanced technology.
Key Concepts and Components of AR in Marketing
Quite several research studies have shown the various components attributed to augmented reality (AR). In order to accomplish overarching marketing objectives by adding value to the brand, its stakeholders, and society at large, while taking ethical considerations into account, AR marketing is defined as the strategic integration of AR experiences, either alone or in conjunction with other media or brand-related cues (Rauschnabel et al., 2022). The concepts behind augmented reality (AR) have grown so much over the years that augmented reality can be viewed as a major technology in the paradigm shift from desktop-based interaction to ubiquitous computing, enabling smart services “anytime, anywhere”. The rapidly developing discipline of augmenting the real environment with digital artifacts and data has the potential to dramatically change how information is presented and accessible. By combining AR with other technologies like gesture recognition, wearables, and the Internet of Things (IoT), it may be possible to emphasise a product’s innovation, improve operational efficiency, and better analyse consumer behaviour (Kumar et al., 2016).
Zhao, Jun & Tianjiao (2022) contributed by stating that the three essential components of an AR system are an image processing unit, a surface to project virtual items onto, and a geographical datum for the virtual object. Early AR systems aren’t very useful in business.They must be developed on specialised hardware, such as smart mirrors, Kinect, PCs with attached webcams, or somatosensory devices like smart glasses such as Google Glass.
Three fundamental building blocks – “tracking and registration, display technology, and real-time rendering” — form the basis of augmented reality systems (Mekni & Lemieux, 2014). According to Baratali et al. (2016), the four functions performed by the AR system are scene collection, scene identification for selecting the correct information to boost it, scene processing, and visualisation for the augmented scene.
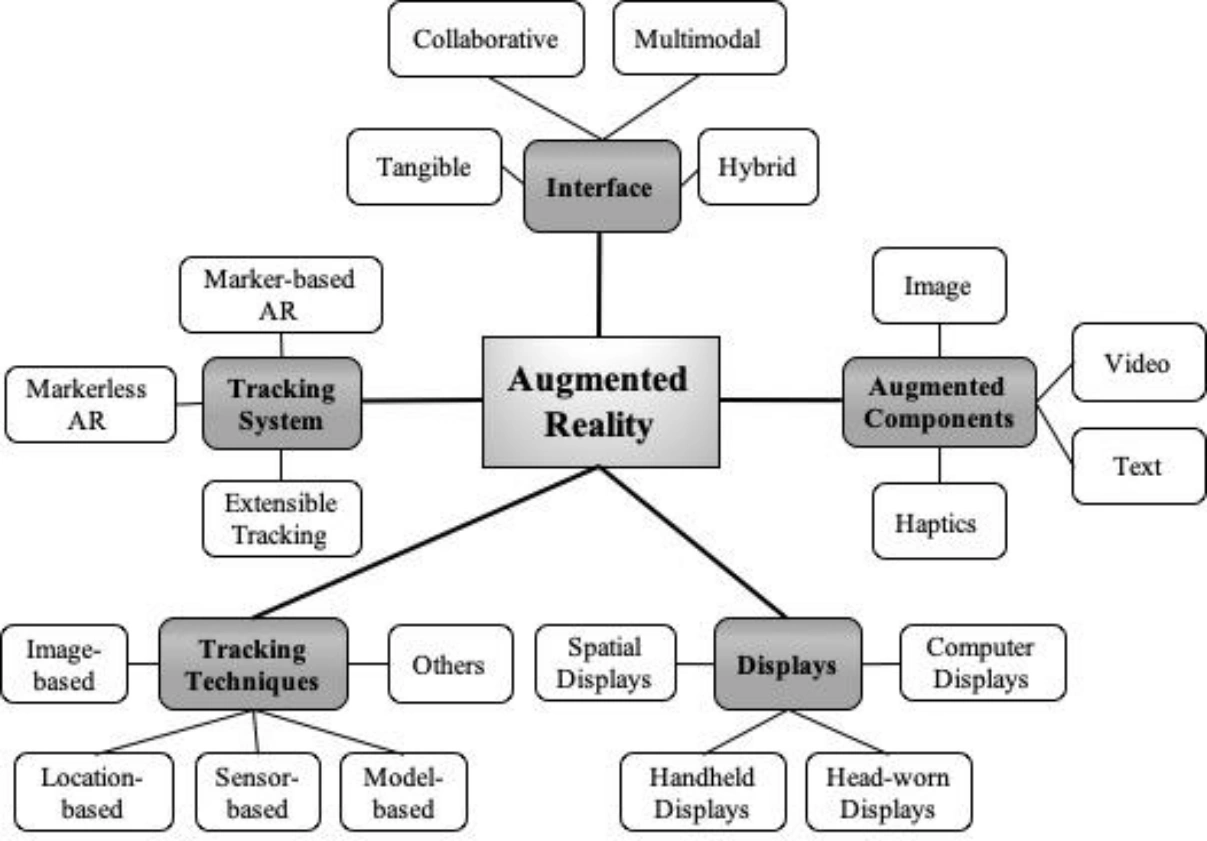
Figure 1: Components of AR. Reference: AR Ecosystem, Roxo & Brito, 2018 (Figure 1, Page 97)
User’s Interaction with Augmented Reality
When it comes to technology, especially advanced technology such as AR, the interaction between the technology, such as the device or interface and the user is important. AR can inspire user engagement; earlier studies indicated that enhancement quality and usability can motivate users by connecting psychological and behavioural motivation through reminiscence (Yi & Eun, 2022).
On the other hand, Roxo & Brito (2018) discussed the following terms regarding user interaction. Attitude is the psychological propensity to rank things from good to bad on a scale of acceptability, and with regard to affective factors (emotions and feelings elicited by a stimulus), behavioural (a propensity for action or inaction that involves concepts like intention, and referral), and cognitive factors (beliefs and opinions that subjects consciously form). The study further stated that the decision-making process considers problem recognition, information search, and evaluating the available options before making a choice. The ability to use technology is referred to as affordance and is frequently used in psychology and human-computer interaction (HCI). Risk, control, and engagement are notions that play into mediation and interfere with the interaction between people and technology. The outcome concerns ideas that help with an unbiased evaluation of technology’s anticipated/verified impact on user satisfaction, performance, and usability. Value refers to evaluating the utility, hedonic value, or experience value of AR to the user (Roxo & Brito, 2018).
In the study by Roxo & Brito (2018), these concepts or terms were investigated to measure their prevalence levels. The most prevalent subtopic (157/328), “Affordances” (technical characteristics), suggests that these traits are important for the creation of AR solutions. The subtopic “outcome” (72/328) describes what kind of results could be anticipated from AR in terms of promoting collaboration and co-creation between humans and technology. The subtopic “mediating” brings together some ideas related to the interaction between people and technology (51/328), which is followed by the user’s cognitive impact (49/328). The subtopic “value” is covered in 11.3% of the articles, followed by “behaviour” (9.1%), “attitude” (8.8%), and “decision-making” (5.5%) (Roxo & Brito, 2018).
Theoretical Foundations of AR in Marketing
The following theories were examined in the study provided by Solankey (2020). The distribution of innovation theory examines how innovations of all kinds will spread within a social system and how quickly customers will adopt new technology. The spread of the creative ideology suggests that users either support or reject innovation when making decisions. Therefore, for AR advancements in retail styles to be successful, the underlying causes that cause customers to resist a technology must be made clear. Businesses must make sure that they can maintain the technology simple while implementing AR, so the customer needs more expertise for the technology to function.
The process of customer decision-making suggests that purchasing decisions are logical and useful. However, only some spending decisions are reasonable; for instance, the decision-making approach is appropriate for pumping and buying without considering utilitarianism. However, in contrast to the diffusion of innovation theory, the technology adoption model (TAM) is applicable when choosing to incorporate and accept developing advancements. It takes important external factors that have an impact on the user’s decision-making process into account (Solankey, 2020). The majority of study relies on the TAM and its variations to analyse various TAM model structures with AR applications to examine consumer adoption of new technology and the factors driving adoption. The majority of situations involving the adoption of digital trials as non-personalized and tailored versions, as well as versions enriched with augmented reality, have been investigated in terms of consumer technology acceptance (Chen, 2020).
According to Chen (2020), TAM works with perceived usefulness and ease of use (PEOU), influencing user behaviour. The software’s perceived usefulness in boosting user activity and its perceived ease of use (PEOU) are two important considerations. TAM specifically states that consumer judgements of the technology’s usability, convenience, and general attitude towards its use will affect how well it is accepted. These components influence favourable and unfavourable results (Romano, Pallat & Sands, 2020). Huang & Liao (2014) further stated that TAM is frequently used to forecast how and when businesses or individuals will embrace new technologies.
Effects of Implementing AR in Marketing Campaigns
Unsurprisingly, given that the capacity to interact with virtual things is one of the primary benefits for technology users, interactivity is one of the key affordances investigated in AR research. The degree of real-time user modification of items in a media-rich environment is referred to as interactivity (Riar et al., 2021). According to several studies, AR has the potential to lower users’ cognitive load and increase users’ cognitive fluency, which can result in positive attitudes, increased decision comfort, willingness to pay, and purchase intentions. This is accomplished through engaging and interactive product presentations that support the mental effort of imagining a product.
According to Yi & Eun (2022), previous AR research has looked into the benefits and drawbacks of various retail applications. The enhanced user experience provided by AR devices may have an effect on consumers’ engagement, opinion of the product, support, and purchase intentions. The use of AR technology in physical stores has a beneficial effect on both the average customer stay time and the frequency of store visits. The novelty, immersion, enjoyment, and usefulness of the media are all influenced by the usage of AR in e-commerce, as are users’ perceptions of the media and consumers’ willingness to purchase (Yi & Eun, 2022). Previously, this was supported by Romano, Pallat & Sands (2020), who emphasised that AR could benefit customers in various ways as they buy. With more businesses allowing customers to choose specific components for their product designs, augmented reality serves to satisfy consumers’ growing need for customization.
The consumer’s perception of the applications’ and individuals’ benefits will determine whether AR gets adopted. These result in positive client experiences and journeys if the added value is appropriate to the purchase (Villigram-Vizcarra et al., 2023). However, according to Riar et al. (2021), results show that augmented reality (AR) can harm consumers’ cognitive effort. However, some signs of augmented reality (AR) may help lower cognitive load.
Examples and Case Studies of Successful AR Marketing Campaigns
According to Baratali et al. (2016), the superimposed 10-yard line on NFL broadcasts is one of the most prevalent examples of augmented reality utilised with television today per (Matt Szymczyk, 2014) example. The National Health Service of the UK combined interactive billboards with augmented reality to reach the target of 200,000 blood donations during the 2016 National Blood Week. Customers may digitally donate blood using their smartphone and instantly observe how it helped a recipient (Hilken et al., 2022).
Villagram-Vizcarra et al. (2023) added to the list of examples stating that high-definition 3D pictures used by ARM in premium brands provide the user with a personalised and abundant experience, encouraging the buyer to make a wise decision before purchasing the product. Chanel, Tiffany, and Swarovski are a few examples of companies that use AR. To build brand equity, ARM allows customers to quickly assess the product’s quality while remaining comfortable in their places of abode. Customers can choose to have furniture or other things delivered to their homes from retailers like IKEA and Amazon, allowing them to feel comfortable receiving assistance before making a purchase. The Sephora app’s application of augmented reality in conjunction with L’Oreal’s virtual mirror is also studied. Virtual physical control allows customers to apply makeup, encouraging involvement with the brand and a positive experience.
Google AR Products
Over the years, Google has launched products and services with certain AR features that have improved the marketing experience among various brands and users, including Google Lens and Google ARCore. A well-known company’s large and ambitious endeavour to penetrate augmented reality in a way that hasn’t usually been seen before is represented by Google Lens. Snapchat, Facebook, and Instagram (owned by Facebook) presently use augmented reality to make you smile and chuckle with filters like rainbow vomit or Iron Man masks. However, Google approaches augmented reality (AR) differently: utility (Nieva, 2017).
Google’s ARCore platform allows for creating and improving Augmented Reality (AR) experiences, bringing data and content to life just when needed. It may bring experiences to life from real-world imagery (like making a movie poster come to life) or let several people interact with the same augmented reality (AR) experience (ideal for learning, gaming, artistic expression, and more) (Google, 2021).
Trends and Gaps in Empirical Research on AR in Marketing
According to the search research methodology conducted by Rear et al. (2021), only 17% of the analysed research chose to look at in-store AR applications, out of a percentage of 69% (percentage of AR for online retail) from 29 total studies in contrast to the large number of studies that used AR in online retail scenarios. In-store solutions may draw customers to a brand, pique their interest, and give additional product information, improving the shopping experience in actual stores. Regarding the applied research approach, 76% of the articles under examination involved field work or lab testing, while the remaining 24% involved survey research. The examined studies (59% of them) mainly used hand-held mobile devices like smartphones or tablets to test AR’s effects on gadgets.
According to Kumar et al. (2016), to acquire a competitive edge, businesses are looking into and deploying cutting-edge technologies that help retain customers, drive impulsive buying among consumers, reduce expenses, and increase profit margins. Surprisingly, despite the fact that these players have looked into the opportunity offered by AR, they have not yet economically incorporated it into their value chains. More quantitative empirical research is required on augmented reality and its application to e-commerce, and the studies that already exist mainly concentrate on end-user research.
Challenges and Considerations for Conducting Empirical Studies in AR Marketing
Although augmented reality technology solutions are more prevalent in global markets, more extensive research is still required to evaluate the user experience these technologies generate. (Davidaviciene, Raudeliuniene & Virsilaite, 2020).
Meanwhile, Riar et al. (2021) mentioned that there has been a significant rise in study interest in these themes, but retailers and business experts still need to completely comprehend how augmented retail will affect business success and consumer acceptance. It is still being determined whether and how augmented reality (AR) might offer a worse or better user experience in retail settings, particularly in e-commerce, which involves buying and selling goods online.
According to Villagram-Vizcarra et al. (2023), speaking of drawbacks, it is significant to note that ARM is still in its infancy because there has yet to be much research on the advantages it can provide. Additionally, ARM can be intrusive and harmful because there are no rules to ensure that utmost security of people’s privacy is guaranteed, even if it can give an organisation a true understanding of customers’ preferences thanks to the personal information obtained. Even though certain applications may have security measures, much must be done to control the moral ramifications of AR applications that gather and track client data.
The analysis’s findings by Orus, Flavin & Sanchez (2021) demonstrate that watching actual content produces a stronger sense of presence than viewing digital content. This conclusion conflicts with that of Martnez-Navarro et al. (2019), who found no distinctions between actual and digital content in VR experiences in terms of presence. However, the research of Martinez-Navarro et al. (2019) was on virtual reality.
Integration of Augmented Reality into Marketing
AR can be integrated into mobile applications for users to interact with effectively. Holding up their phones, users of mobile augmented reality applications can view an AR image that resembles a heads-up display and contains details about their local surroundings (Baratali et al., 2016). AR needs to be created and offered using regularly used software, and it also needs to be crucial that these programmes work with frequently used user devices, in this case, mobile devices (Ruiz et al., 2019).
It was stated in the research conducted by Kumar et al. (2016) that the choice of a corporation to accept technological innovation is influenced by organisational and environmental factors in addition to the technology itself. Some organisational resources and traits, such as slack, size, and structure, are described by the organisational context and the environmental circumstances in which the company operates make up the environmental context. When considered as a whole, these three contextual elements impact a firm’s decision to accept innovation and, consequently, firm performance (Kumar et al., 2016). The tasks that are the particular actions taken by each AR system must include the organisational or social structure to which it is ultimately aimed and which will, specifically, permit the development of those strategies (Ruiz et al., 2019).
Ruiz et al. (2019) added that sales systems need to be established by the marketing settings in which they are developed and with everyday procedures. The following guidelines should be followed when designing AR-based marketing systems: A visually appealing layout, including multimedia components that allow any user to comprehend, remember, and be persuaded to buy; Easy operation of all information types.
Additionally, some fundamental technology must be used for the construction of these tools, which could be completed in the following stages for simplicity: System requirements analysis using AR; Formulate code, software development, and abstract and physical design; Create test data, locate it, and prepare the files before testing and integrating the software (Ruiz et al., 2019). The AR systems should be flexible, relatable to users, selective for the main aim it was designed for, and relevant and timely. As regards management, there is a need for constant checks, maintenance and updates to the existing systems. System manuals should also be made available to users on how to use these AR devices or software properly. Ruiz et al. (2019) also referred to the cost when integrating AR systems in marketing. The system’s cost-benefit analysis is crucial when defining the criteria because its benefits are calculated in terms of money. Factors intrinsic to these economic benefits are also considered, such as consumer preferences for retailers, novelties, and the fact that they use cutting-edge technology (Ruiz et al., 2019).
METHODOLOGY
The study’s methodology section summarises the techniques, procedures, and data collection and analysis methods. It begins with explaining the research philosophy, which is important by introducing certain research principles. Following the above, there would be close attention to the processes that were involved in aiding quality and efficient study outputs; investigation of the effectiveness of the research strategy for the study; the reasons why the research methods or designs were chosen; the instruments and tools used for collections and analysis, and the expected outcomes. Additionally, the research ethics considered for this thesis will be stated, as well as the sampling techniques. In conclusion, the chapter will summarise the entire research process to aid recommendations for future research. This study section was guided by the “Research Onion Model” by Saunders.
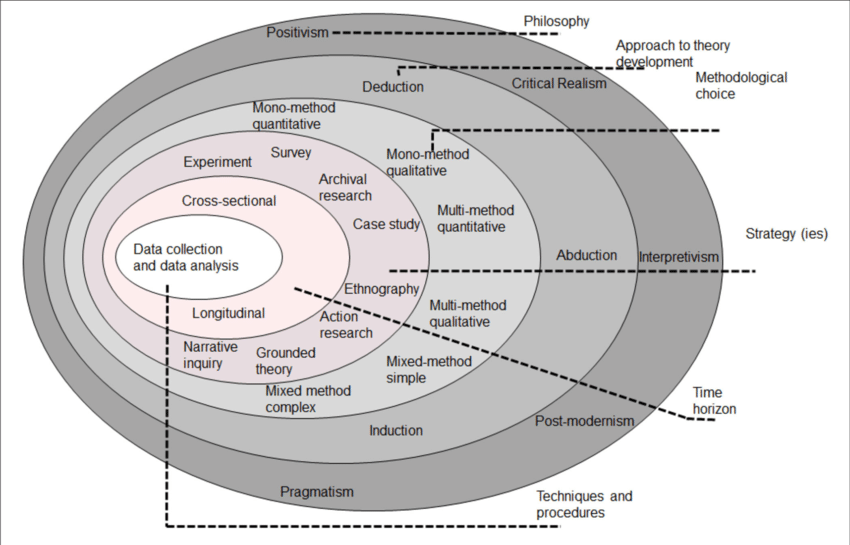
Figure 1: Research onion (Saunders et al., 2019, p. 108).
Research Philosophy
An explanation of a cause-and-effect relationship is knowledge. The several kinds of cause-and-effect connections are outlined as reasoning by deduction, induction, and inductive-deductive reasoning, which form the basis of research philosophy (Kenaphoom, 2021). The primary study of general and fundamental topics like truth, knowledge, and universal values is called philosophy. Philosophy aims to find philosophical answers to all issues, which mainly rely on logic and a critical, rigorous approach to problem-solving. Other than through direct observation, there are several ways to learn about the world, and individuals utilise these constantly. Many of the concepts related to research philosophy were introduced based on this premise (O’Gorman & MacIntosh, 2016). Dissanayake (2023) states that a paradigm is a shared set of scientific and academic beliefs, assumptions, and ideas among researchers about conceptualising and approaching problems. The frequently discussed assumptions are Ontology, Epistemology, Axiology and Methodology, as previously stated by O’Gorman & MacIntosh (2016). Together, these presumptions make up the study’s research philosophy. Dissanayake (2023) states that a researcher’s understanding of existence is based on ontology, a philosophical premise about the reality they face while conducting their research. In order to understand how knowledge might be recognised, developed, or acknowledged, epistemology explores various study methods. Assuming that the outside world is ideally impartial, epistemology can be objective (positivism) or subjective (interpretivism), which holds that the outside world is interpretable. The axiological premise examines how societal attitudes and prejudices shape the story and perception of a phenomenon in research. Axiology investigates value judgements to elucidate the values and presumptions of the researcher interested in value systems. The methodological assumption relates to what grounds we have for thinking that an interpretation is accurate or how we might defend an interpretation. This study on using augmented reality for marketing was developed based on the methodological assumption.
In the “Research Onion” by Saunders, research philosophy is categorised into the following parts: positivism, realism, interpretivism, and pragmatism (Saunders & Tosey, 2015). According to the positivist philosophy, a researcher interested in seeing and predicting findings will also be interested in generalisations resembling laws, such as cause and effect. According to Saunders & Tosey (2015), a philosophical stance related to scientific inquiry is realism. Realists contend that reality exists regardless of what a researcher’s senses and mind can discern. Where the researcher is more concerned with gaining profound insights into specific meanings than in providing generalisations that resemble laws, the interpretivism philosophy is evident. This philosophy relates to the study of social processes in their natural environments. According to pragmatism, the importance of research is in how it is used in practical contexts. It is considered that there may be many realities and that no one viewpoint can ever present the entire picture. This does not suggest that a pragmatist researcher consistently uses various data collection strategies and analytical techniques; rather, the study design should permit obtaining reliable and trustworthy facts to enhance further activities. However, postmodernism was introduced as one of the research philosophies in the study given by Dissanayake (2023). One of the traits of postmodernism is the blurring of the barriers between high and low culture. Postmodernism is concerned with democratising collective consciousness and is seen as the triumph of individualism (Farhan, 2019).
Further explained in research by Multani (2020), it was stated that in both quantitative and qualitative research, individual-created opinions based on time and context either align with or deviate from others in the cultural or social group under study and replace the validity and reliability of contemporary language. To represent information and make it accessible to the reader, the researcher is proficient in postmodernism. In postmodernity, the emphasis on demonstrating the attainment of the truth of the matter (qualitative) or the precision of measurement of the designated region (quantitative) cannot be generalised.
The research philosophy employed in this research is pragmatism because it “asserts that concepts are only relevant where they support action” (Saunders, Lewis & Thornhill, 2015). It tries to reconcile objectivism and subjectivism, principles and knowledge, accurate and reliable data, and numerous contextualised experiences. It does this by considering theories, concepts, ideas, hypotheses, and research findings in terms of how they serve as instruments for thought and action and how they may be applied practically in various contexts. Based on the methodological assumption, this philosophy entails the following research questions and problems; various methodologies are utilised, emphasising practical outcomes and solutions, including mixed, multiple, qualitative, quantitative, and action research.
Research Approach
According to Kenaphoom (2021), all research questions based on fundamental philosophical concepts are answered using research data. At every stage of research, consciously or unconsciously, assumptions are made. The science of reasoning can be improved using deductive reasoning, whereas inductive thinking starts with observation rather than belief. Actual data must support the authority. In other words, information for testing a hypothesis is provided by empirical evidence (Kenaphoom, 2021). The inductive method collects data by observation, experimentation, or other methods depending on the circumstance. The data will be categorised according to similarities, differences, and relationships. Analysing the data allows for the creation of new knowledge.
The inductive-deductive thinking technique is suited for testing hypotheses with empirical data to come to factual conclusions, which involve identifying problems, constructing hypotheses, data collection, data analysis and concluding (Kenaphoom, 2021). Kenaphoom (2021) further explained that the guiding principle for a quantitative research methodology known as postpositivism highlights reality and uses data to reach conclusions. An objective tool is used to collect data. Phases of the research methodology are separated. Sampling is done based on theories and the possibility of data collection through surveys, observation logs, tests, interview logs, and experiments. The equipment is objective and contains numerical data.
Meanwhile, the phenomenological research paradigm is an idea that has something to do with both social science research and scientific methodology. The objective is to research human behaviour in knowledge, feeling, and abstract notions, which are difficult to quantify precisely. The foundation of qualitative research is phenomenology, which uses an inductive reasoning approach to uncover reality. According to Fleming & Zegwaard (2018), A case study that focuses on just one incident provides a complete analysis and interpretation to understand that only one instance is known as an intrinsic case study. Alternatively, a case study can clarify a particular subject or problem. Google is being used as a case study in this thesis to examine and investigate the effects of augmented reality in marketing to support business expansion. Individuals are asked questions from a user’s perspective to draw opinions and insights regarding how advanced technologies have affected marketing.
According to Saunders, Lewis & Thornhill (2015), based on each approach for developing theories, A deductive technique is used when a research method is created to test the hypothesis after constructing a theory, which is typically the outcome of reading academic literature. Contrarily, using an inductive approach, data is first gathered to analyse a phenomenon before a theory is built (usually in a conceptual framework). An abductive technique is used when data is obtained to explore a phenomenon, identify themes, and explain patterns to establish a new theory or modify an existing one. The theory is then tested through additional data collection. In the case of this research, an abductive approach was used to bring facts in agreement with theories with the collection of substantial data for verification.
Research Strategy
The research philosophies bound together the research strategies. As researchers plan how to approach addressing or answering a research question, the strategy layer of the research onion underlines right away that they can apply one or more strategies within their study design (Saunders & Tosey, 2013). According to Saunders & Tosey (2013), realism and interpretivism are linked to ethnography. Realist and pragmatic researchers regularly use experiment and survey research methodologies, although they are traditionally associated with positivism. Additionally, case studies are used in positivistic research, however, they are frequently associated with interpretivism and may involve individual organisations. This research used a survey strategy to gather structured data from a sizable sample of respondents.
Research Design/Method Choice
When selecting a research design or method for a study, the study’s goal and the format of the research questions should guide the choice of methodology (Fleming & Zegwaard, 2018). The research design determines the research’s structure, which acts as the adhesive holding together all of the project’s primary components. Measurements, treatments, programmes, assignment techniques, and samples or groups all contribute to addressing the central research concerns (Odoh & Chinedum, 2014). Drawing connections between theories and arguments and guiding data collection and analysis in research are both important functions of research design. By selecting and organising the evidence, a researcher can more easily collect and organise data for analysis. The research method or design used for this study is a Quantitative method. Primary data were collected and analysed using quantitative means and procedures.
Research Time Horizon
When research is done to solve a problem or provide an answer at a certain time, this “snapshot” is cross-sectional and will probably use methods like a survey or case study. In contrast, longitudinal research is utilised for grounded theories and archival research. It is performed when answering a question or solving a problem calls for gathering data over a lengthy period (Saunders & Tosey, 2013). This study used a cross-sectional time horizon because it is limited to a specific time.
Research Techniques and Procedures
For this research, a cross-sectional survey, administered through the questionnaire, was used to gather data via the internet using the online Google Forms because of the reasons; less expensive (no expenditures for paper, postage, shipping, or data entry), capable of reaching populations around the world considering the topic is not region-based, Implementation time was reduced, sample size can be increased, complex skip patterns can be programmed (Owens, 2002). Even though it may seem obvious, a questionnaire is the best tool for gathering data that is out of the observer’s physical range (Odoh & Chinedum, 2014). Hence, this instrument was used to administer the survey. According to Odoh & Chnedum (2014), a questionnaire is more than a simple list of questions or forms to complete. It serves primarily as a scientific tool for measuring and gathering certain data. It must be specifically developed per a specified specification and with a specific goal in mind, and the data it produces is prone to inaccuracy, like all such instruments.
With bigger random samples, the likelihood that the responses will properly reflect the population increases. (Ponto, 2015). This research study used a random sampling technique with a sample size of 70 participants, to which the questionnaire was administered. In this instance, correlational/regression analysis was used as a method of data analysis using the SPSS software. The analysis, visualisation, and presentation of the study’s findings took place using the software. Tables and charts were used to present the data.
Ethical Considerations
The emphasis on ethical behaviour (the actions made while conducting research) has grown and broadened in response to society’s expectation of more accountability. Along with selecting an appropriate study methodology and procedures, ethical considerations regarding the research’s conduct are essential (Fleming & Zegwaard, 2018). To ensure that the research ethics were strictly followed regarding this study while collecting data, the aim and purpose of administering the questionnaire were stated; confidentiality and anonymity of respondents were guaranteed; questions were clear with unbiased options; and the conduction of pre-test.
Summary
Ponto (2015) asserts that survey research is a suitable and efficient tool for identifying and analysing important variables and constructs. Designing research to solve an issue or problem is constantly bound by what is ethical and practical, which is equally important (Saunders & Tosey, 2015). In this chapter, the research philosophy, potential methodological options, tactics, and time horizon, as well as how these factors relate to one another for this research study, have been given, which includes a philosophy of pragmatism based on the methodological assumption, an abductive approach using a survey strategy, a quantitative design or research method and the data collection and analysis instruments. These ensure that the fundamental methods for gathering data and conducting analysis utilised in the research are both suitable and cohesive.
FINDINGS AND DISCUSSION
Chapter Overview
This chapter of the dissertation presents findings and results from the data collection techniques and analysis. As earlier stated, the data collection technique was a survey administered through the questionnaire (Google Forms), and the SPSS software was used for data analysis. This part will critically analyse the data survey findings used to carry out the study’s goals and objectives; it will present the reasoning for each survey question, its relationship to supporting literature data, and significant research study findings. It would focus on the basic components and attributes responsible for using Google AR products. It would also present the analysis from users’ perspectives on how the infusion of AR in marketing has improved the Company. The opportunities AR in marketing has presented to users, the challenges that users encounter, and the awareness rate will be discussed. In addition, critical evaluation of the effectiveness and adoption of these Google AR products will be presented and discussed regarding earlier theories in the literature. Hence, this study section discusses these results concerning the research questions and objectives.
Overview of the Industry or Company
Augmented reality (AR) is an advanced technology, and Google, as a multi-national company, has infused this technology into many of its products. Google is dedicated to substantially enhancing as many people’s lives as possible (Google, 2023). Through the variety of the company’s products, the company has helped most individuals make valuable decisions. For this research study, only a few of Google’s products would be considered and used to collect data while drawing inferences. Google has released several AR-enhanced products and services, including Google Lens, Google Maps AR, Google Swirl and Google ARCore, that have enhanced the marketing experience for various businesses and users. Aside from the fact that Google has used these AR products to create a buzz around the brand itself, the company has assisted other brands in utilising these AR products for seamless activities fully. The data collected and analysed would reveal how Google AR products are being used, the challenges, suggested solutions and their spread across different demographics.
Google Lens is an example of a well-known company’s massive and ambitious effort to enter augmented reality in a way that has not typically been seen before. With filters like rainbow vomit or Iron Man masks, Snapchat, Facebook, and Instagram (owned by Facebook) currently use augmented reality to make you smile and laugh. However, Google has a different augmented reality (AR) strategy: usefulness (Nieva, 2017).
With the help of Google’s ARCore platform, augmented reality (AR) experiences can be developed and improved, bringing data and content to life as needed. One or more individuals may be able to interact with the same augmented reality (AR) experience, which is perfect for learning, gaming, artistic expression, and more (Google, 2021). It may also bring experiences to life using real-world imagery, such as making a movie poster come to life.
Before becoming more widely available in August 2019, Google Maps AR navigation was initially demonstrated at Google I/O in 2018. It then received a tease in early 2019. The system, which was once known as Google Maps AR, is now known as Live View on compatible devices, but it performs the same general purpose and is listed under that name in Google Maps on mobile devices. Augmented reality can be used for guidance while strolling with Google Maps AR or Live View (Hall, 2023). According to Hall (2023), the GPS positions an individual on the map while AI detects what can be seen. In the end, Google Maps Live View aids in overcoming the difficulty of not knowing which way to walk because the AR can point in the appropriate direction so that travelling in the proper path is ensured. This feature of Google Maps AR relies also on Google ARCore.
As it struggles to emerge from the mire of disappointment, one area of hope for AR is advertising. According to predictions from ARtillery Intelligence, brand expenditure on AR advertisements is expected to reach $1.41 billion this year, making it one of the most successful AR subsectors.
To future-proof its main search business, Google has been promoting a variety of augmented reality (AR) technologies. These include visual search, which uses AR to contextualise objects you point your phone towards, and search results that employ 3D visualization (Boland, 2020). Customers may see, zoom, and rotate 3D models in search results or on websites thanks to Swirl’s interactive 3D ad style. This occurs on the screen or occasionally with a camera-activated overlay in a specific area. Both solutions allow AR to “ease in” as a purchasing method. As stated by Boland (2020), given the size of Google, 3D representations in search might accustom and hook customers on immersive online purchasing. Brands will be encouraged to invest. As a result, encourages startups in AR advertising to meet the need.
Presentation, Description and Evaluation of Findings
The survey ended with a total of 55 respondents across different demographics. All of the data collected from the respondents were categorical data. Hence, the data were cleaned and transformed using Microsoft Excel before transferring the data to SPSS for better and more elaborate analysis. Variables were analysed using models such as descriptive statistics, cross-tabulation, correlation, and charts.
Figure 1: Frequency Distribution of Gender
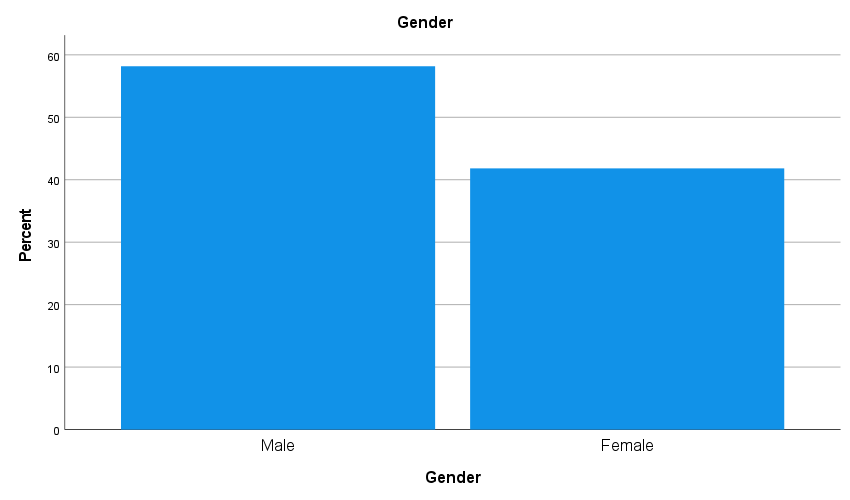
Figure 2: Frequency Distribution of Age Group
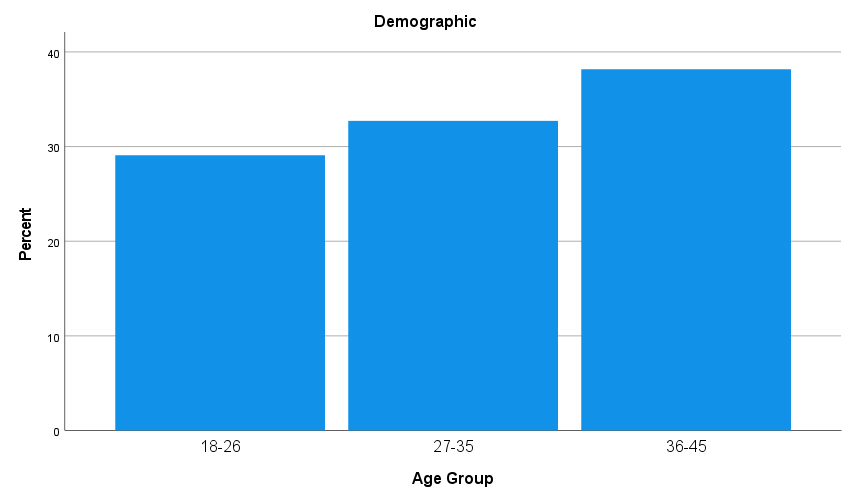
Table 1: Frequency Distribution of Social Status
Social Status Frequencies | ||||
Responses | Percent of Cases | |||
N | Percent | |||
Social Status | Student | 13 | 19.1% | 23.6% |
Unemployed | 1 | 1.5% | 1.8% | |
Employed | 43 | 63.2% | 78.2% | |
Self-Employed | 11 | 16.2% | 20.0% | |
Total | 68 | 100.0% | 123.6% | |
The above shows the statistics of both the gender, age group (demographic) and social status of the respondents of the collected data in tables and bar charts.
Use of Google AR Products across the Demographics
The tables in the images below show a crosstabulation of the three demographics used, which includes social status, age group and gender, against the responses of the usage of Google AR products. From the tables below, out of 55 respondents, 76.4%, equal to 42 respondents, indicated they have used Google AR products, while 23.6%, which means 13 respondents, stated they have not. From Fig. 3, four categories of social status can be seen: student, unemployed, employed and self-employed. The percentage and count of those who indicated that they were ’employed’ and have used Google AR products are greater than other groups (58.2%, 32 respondents). This indicates a high tendency to use Google AR products in the workspace.
Figure 3: Cross-tabulation of the Usage of Google AR Products and Social Status
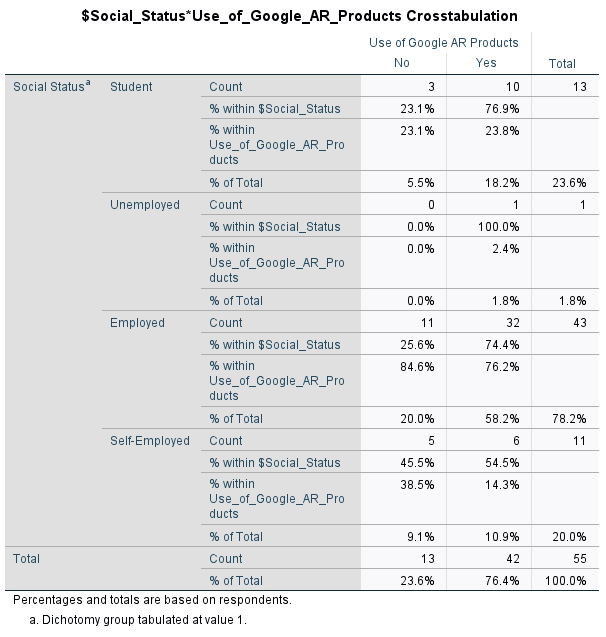
Figure 4: Cross-tabulation of the Usage of Google AR Products and Gender
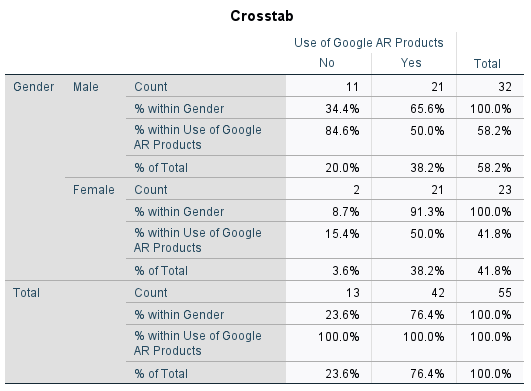
Figure 5: Bar Charts showing the frequency distribution of the Use of Google AR products across Gender
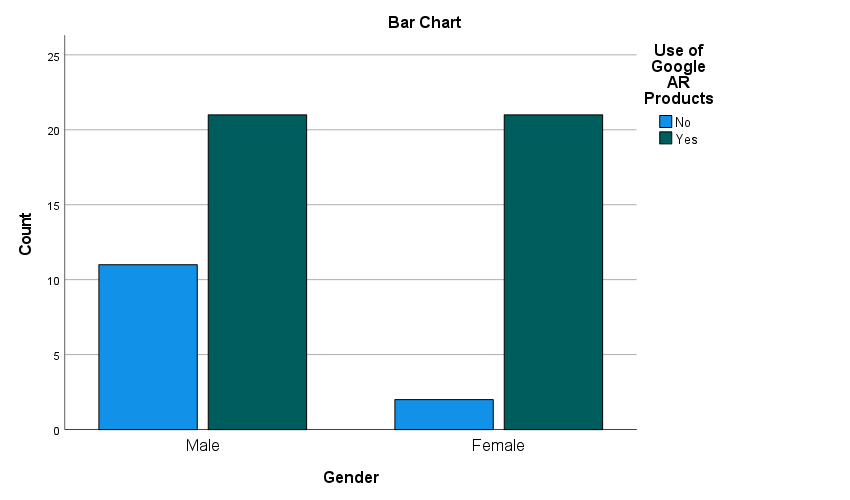
From the above figures (Fig. 4 & 5), the percentage of female respondents recorded to have used Google AR products (38.2%, 21 respondents) is the same as the percentage of male respondents to have used the products (38.2%, 21 respondents). The summation of both percentages gives 76.4% (42 respondents) the total percentage of respondents who have used Google AR products.
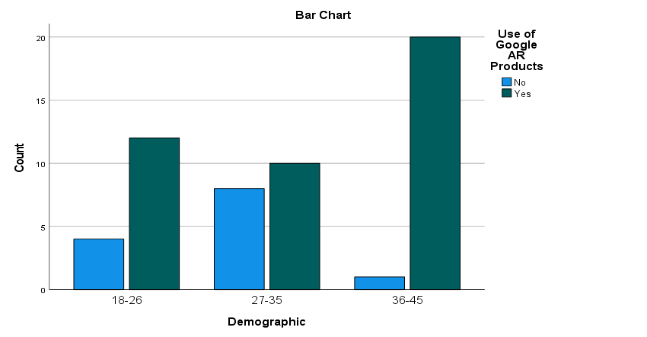
Figure 6 shows that a greater proportion of those between the age range of 36 – 45 indicated that they had used Google AR products compared to other age groups in this research. This is quite alarming that the closest generation (18 – 26, Generation Z) to these advanced technologies is unfamiliar with Google AR products. However, it can be seen that this same set of respondents has the greatest proportion of those who responded or answered the questionnaire.
Figure 6: Bar Chart Illustration of Age Groups against Usage of Google AR products
Most Familiar Google AR Products among Respondents
According to the results given below, Google Maps AR (65.0%) is seen to have taken the lead in the most familiar Google AR products asked about by the researcher, among others which include Google Lens (31.7%), Google Swirl (3.3%) and Google ARCore. All of the respondents indicated needing to be more familiar with Google ARCore.
Table 2: Frequencies of the Familiarity of Google AR products among respondents.
Responses | |||
N | Percent | ||
Google Products | Google Lens | 19 | 31.7% |
Google Swirl | 2 | 3.3% | |
Google Maps AR | 39 | 65.0% | |
Total | 60 | 100.0% | |
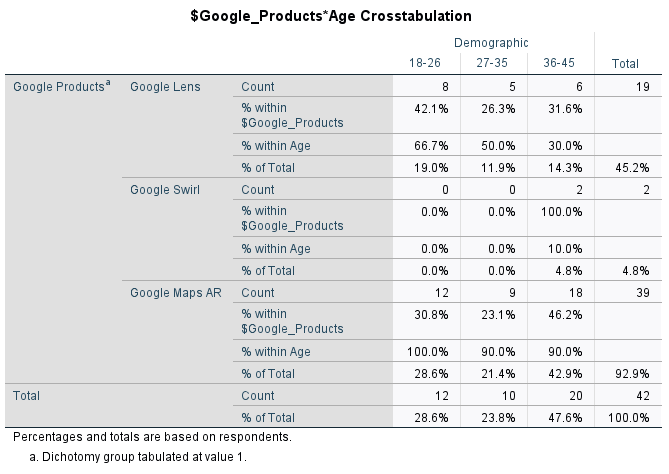
Further analysis was made to reveal if there were reasons as regards why each demographic are familiar with the product they selected, but no significant correlation was noticed; for each demographic, a greater proportion of each group is most familiar with Google Maps AR as seen in the cross-tabulations below.
Figure 7: Google Products Familiarity Rate among Social Status Groups
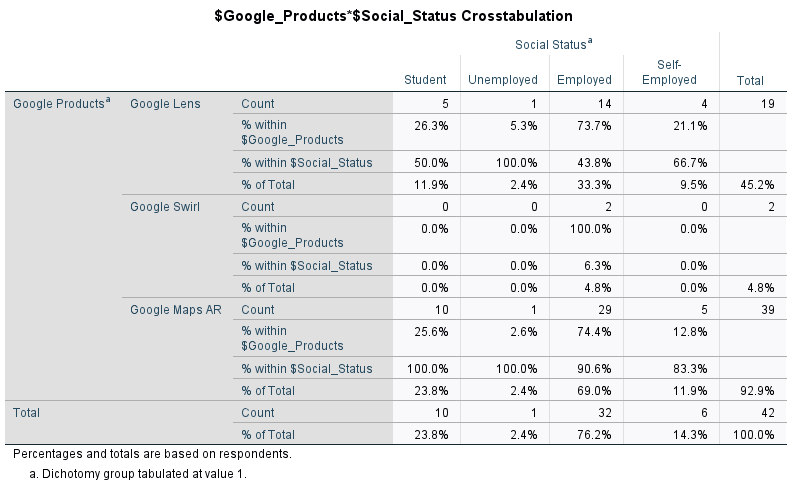
Figure 8: Google Products Familiarity Rate among Gender
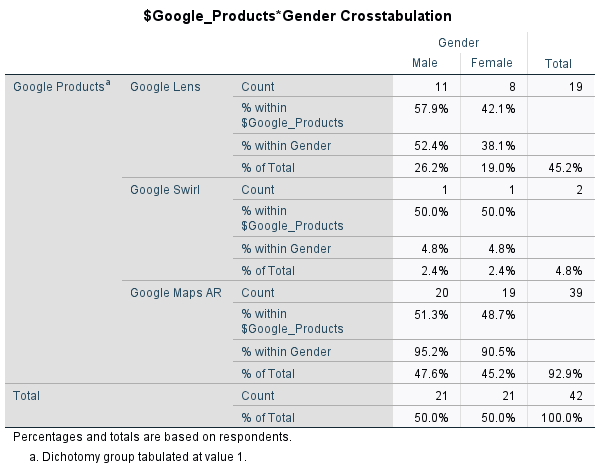
Figure 9: Google Products Familiarity Rate among Age Groups
Effects of Google AR Products
RQ1: Are there effects of introducing enhanced technologies in marketing? How does AR stand out from modern marketing and media strategies?
Null Hypothesis: There are significant effects to using AR in marketing.
Alternative Hypothesis: There are no significant effects to using AR in marketing.
To answer the above research question, some factors were drawn out of the results of the data collection, which includes asking the respondents if they ever at any point intended or decided to purchase customers while using these Google AR products; if these Google AR products either enhance or detract from their online experience; and their satisfaction levels about these products. Results from the responses to these questions showed if truly AR being infused in marketing has any significant effect. Once a user intends or decides to make a purchase, that is an effect and when a user is satisfied with these products, the products can be seen to be effective.
Below are the descriptives for Purchase Intention, Effects and Satisfaction levels individually. It is revealed from the tables below that only 40.5% have made purchases or have intended to purchase Google AR products, against 59.5% who indicated they have never made purchases or intended to; 73.8% indicated that these Google AR products have effects on their online experience against 26.2% and a higher percentage, 52.4% indicated a moderate satisfaction level. More details can be seen in the tables as follows.
Table 3: Frequencies of Purchase Intention
Frequency | Percent (%) | Valid Percent (%) | ||
Valid | No | 25 | 45.5 | 59.5 |
Yes | 17 | 30.9 | 40.5 | |
Total | 42 | 76.4 | 100.0 | |
Following a company’s adoption of cutting-edge, novel technologies, potential customers frequently experience a startling “wow”-effect. As a result, an organisation will benefit from the proper application of new technology since inventiveness has positively impacted users’ purchase intentions. According to Rommerdan (2019), the term “purchase intention” itself describes “consumers’ subjective judgement that is reflected after the general evaluation to buy a product or services.” However, from the table 3 above, a greater part of the respondents indicated that they have not had the intention to make purchase while using Google AR products.
Table 4: Effects (Enhances or Detracts) of Google AR Products.
Frequency | Percent (%) | Valid Percent (%) | ||
Valid | No | 11 | 20.0 | 26.2 |
Yes | 31 | 56.4 | 73.8 | |
Total | 42 | 76.4 | 100.0 | |
Table 5: Satisfaction Levels
Frequency | Percent (%) | Valid Percent (%) | ||
Valid | Very Low | 2 | 3.6 | 4.8 |
Low | 3 | 5.5 | 7.1 | |
Moderate | 22 | 40.0 | 52.4 | |
High | 14 | 25.5 | 33.3 | |
Very High | 1 | 1.8 | 2.4 | |
Total | 42 | 76.4 | 100.0 |
Figure 10: Bar Charts of the various Google AR Products against Purchase Intention.
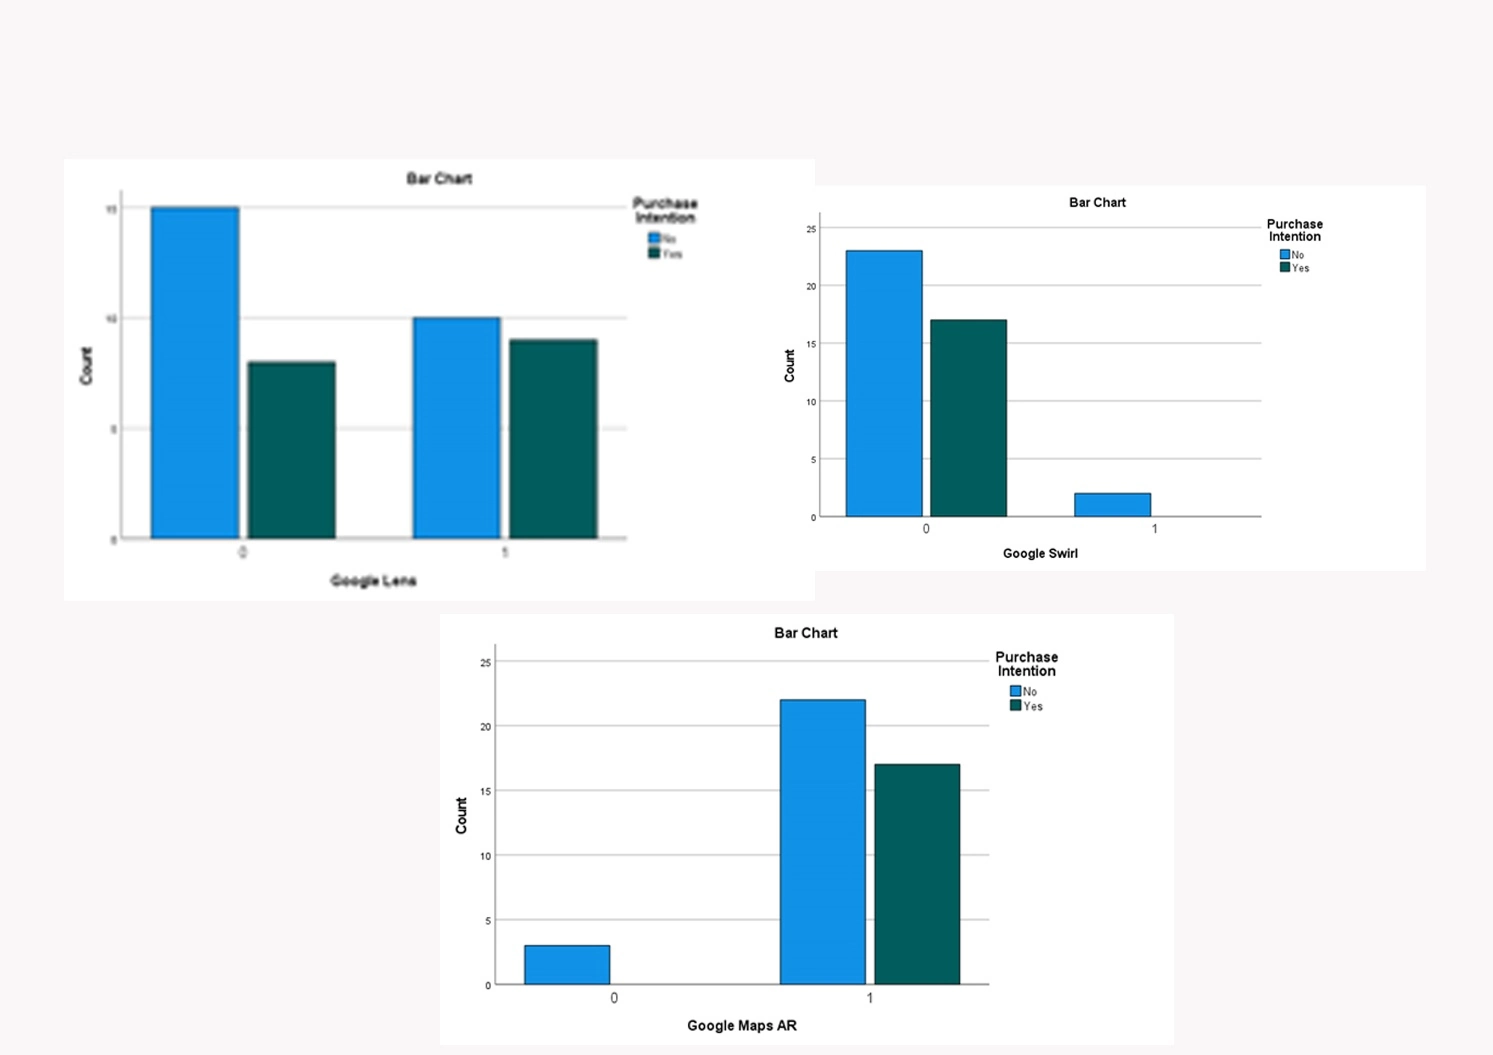
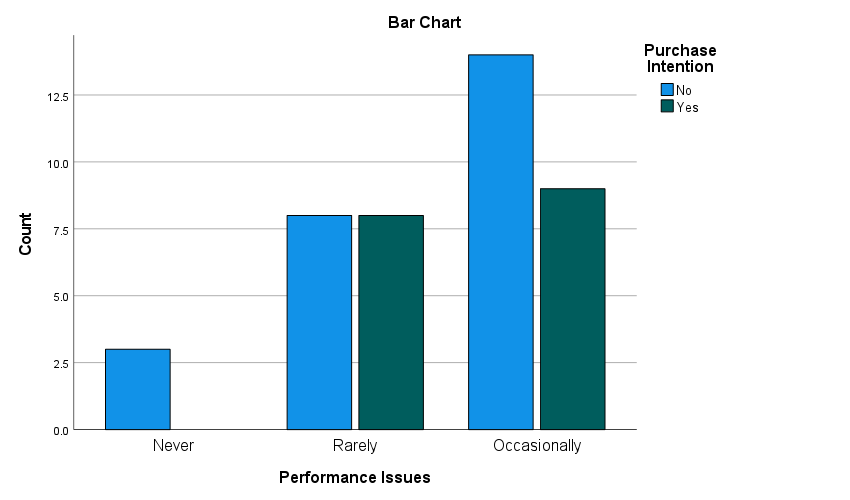
From Fig. 10, no relevant correlation is seen regarding the familiarity of each product and the intention to purchase. For each product, a greater proportion have not purchased or intended to. Similarly, Fig. 11 shows a negative or inverse relationship between how often users encounter performance issues and their purchase intention. It shows that both factors do not affect each other.
Figure 11: Performance Issues and Purchase Intentions
For further understanding, respondents were asked how likely they would recommend Google AR products to others. For an individual to recommend a particular product, it must have proven effective, which is why this factor matters. The technology acceptance model states that consumer judgements of the technology’s usability, convenience, and general attitude towards its use will affect how well it is accepted. Together, these components influence both favourable and unfavourable results. According to situated cognition, customers’ information processing is embodied through physical simulations and actions and is embedded in their physical environment (Romano). Cross-tabulation was made for Recommendation levels against Satisfaction levels, and the rates at which the Google AR products capture the users’ attention.
Figure 12: Bar Chart showing the rate at which Google AR products capture users’ attention.
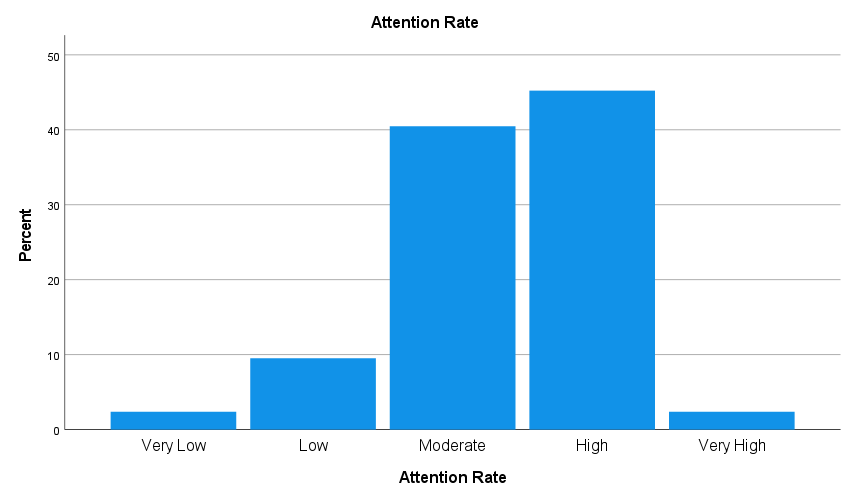
Figure 13: Bar Chart showing the Satisfaction levels of Users.
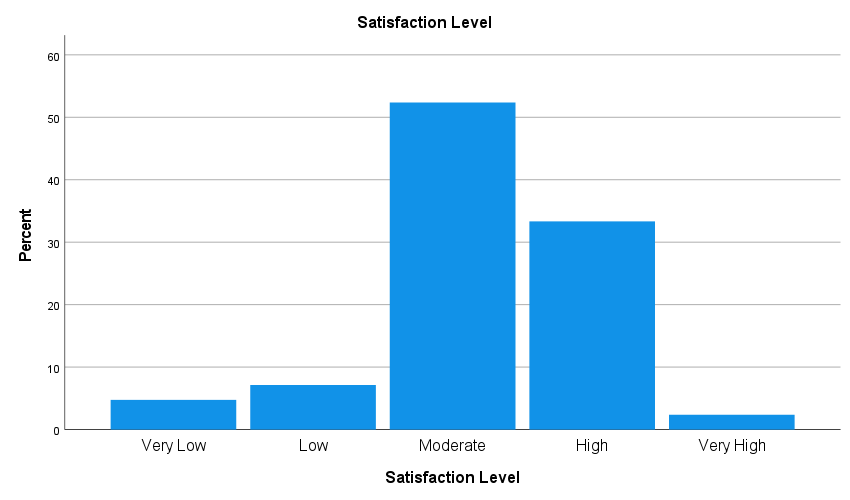
Table 6: Frequency table showing recommendation rates among users.
Recommendation Rate | |||||
Frequency | Percent | Valid Percent | Cumulative Percent | ||
Valid | Low | 3 | 5.5 | 7.1 | 7.1 |
Moderate | 14 | 25.5 | 33.3 | 40.5 | |
High | 17 | 30.9 | 40.5 | 81.0 | |
Very High | 8 | 14.5 | 19.0 | 100.0 | |
Total | 42 | 76.4 | 100.0 | ||
Null hypothesis: A positive relationship exists between the satisfaction levels of users and their recommendation rates.
Alternative Hypothesis: No relationship exists between the satisfaction levels of users and their recommendation rates.
Table 7: Chi-Square Test of Satisfaction Level against Recommendation Rates
Chi-Square Tests | |||
Value | df | Asymptotic Significance (2-sided) | |
Pearson Chi-Square | 34.661 | 12 | .001 |
Likelihood Ratio | 26.651 | 12 | .009 |
Linear-by-Linear Association | 15.296 | 1 | .000 |
N of Valid Cases | 42 | ||
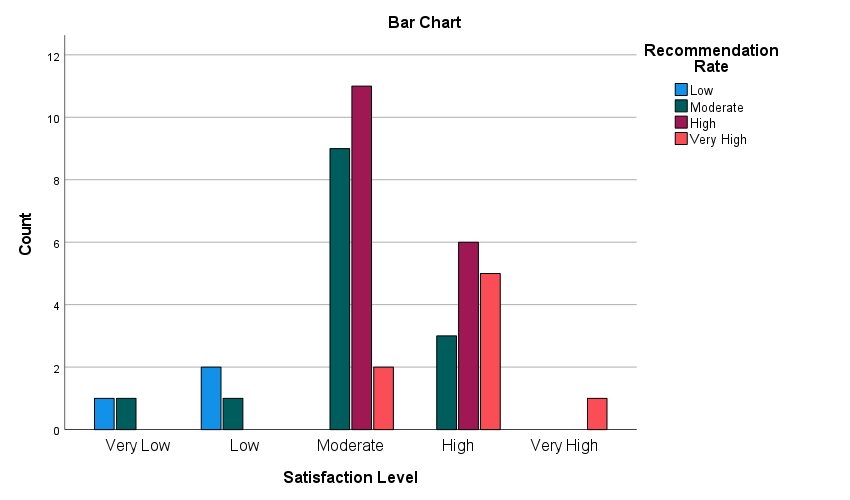
The Pearson chi-square value or the test statistic calculated is 34.661at 12 degrees of freedom. The asymptotic significance value or the p-value is 0.001 which is less than the significance level of 0.01, this indicates that the null hypothesis is accepted. There is a 99% confidence that there is a positive relationship existing between satisfaction levels and recommendation rates. The bar chart is displayed below in Figure.
Figure 14: Bar chart showing the relationship between Satisfaction Level and Recommendation Rate
Attention Rate and Recommendation Level
Null hypothesis: A relationship exists between the rates which Google AR products capture users’ attention and their recommendation rates.
Alternative Hypothesis: No relationship exists between the rates which Google AR products capture users’ attention and their recommendation rates.
Table 8: Chi-Square Tests of Attention Rate and Recommendation Rate
Chi-Square Tests | |||
Value | df | Asymptotic Significance (2-sided) | |
Pearson Chi-Square | 34.576 | 12 | .001 |
Likelihood Ratio | 30.203 | 12 | .003 |
Linear-by-Linear Association | 15.627 | 1 | .000 |
N of Valid Cases | 42 | ||
The test statistic, or Pearson chi-square value, is 34.576 at 12 degrees of freedom. The null hypothesis is accepted since the asymptotic significance value, or p-value, is 0.001 and less than the significance level of 0.01. Hence, the confidence that there is a correlation between customer satisfaction scores and referral rates is 99%.
Continuity Rate of the Use of Google AR Products among Users
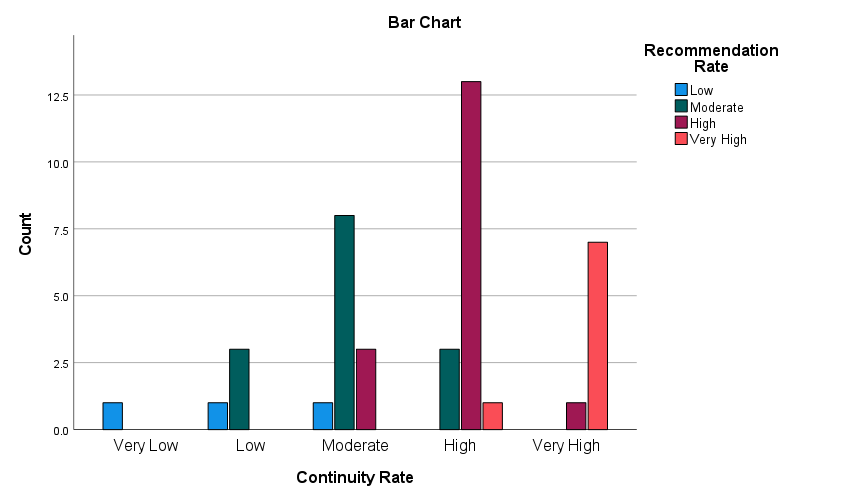
Using the chi-square test, in Table 9 below, the rate at which users are willing to continue with the use of Google AR products affects the rate at which they would recommend the products to others. This is justified with a p-value of 0.00 which is less than 0.01 at 99% confidence level.
Figure 15: Bar Chart showing the rate at which users are willing to continue with the usage of Google AR products.
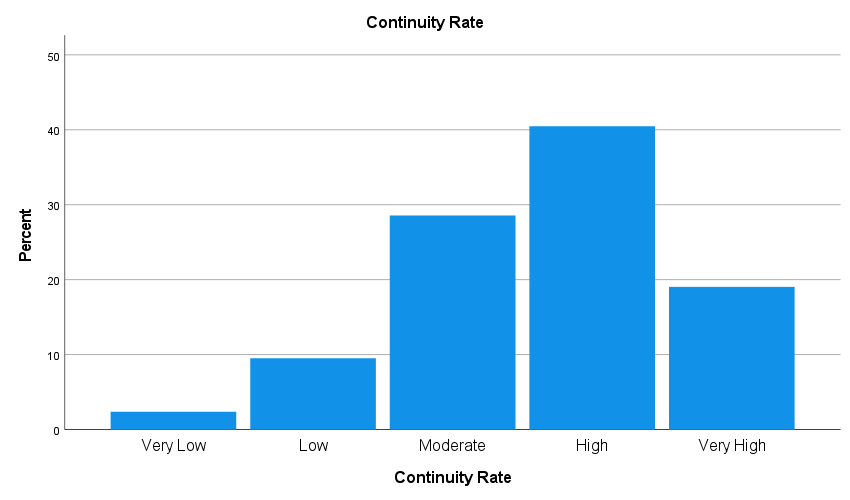
Table 9: Chi-Square Tests showing relationship between Continuity Rate and Recommendation Rate
Chi-Square Tests | |||
Value | df | Asymptotic Significance (2-sided) | |
Pearson Chi-Square | 60.192a | 12 | .000 |
Likelihood Ratio | 50.528 | 12 | .000 |
Linear-by-Linear Association | 27.893 | 1 | .000 |
N of Valid Cases | 42 | ||
Figure 15: Bar Charts showing relationship between Continuity Rate and Recommendation Rate
Engaging Google AR Products as Users
Respondents were also asked how likely they would engage with a product or brand that utilizes Google AR products for marketing. When clients can interact with a product, they feel more at ease making decisions. Consumers may make more confident decisions because of AR. It has been discovered that AR can help consumers make better decisions by saving them time and effort (Romano, Pallat & Sands, 2020).
The descriptive statistics were obtained from the analysis conducted and the analysis to determine the factors responsible for the answers given by respondents.
Null Hypothesis: If users are well satisfied with Google AR products, they would engage with them for marketing.
Alternative Hypothesis: Even if users are well satisfied with Google AR products, they would not engage with it for marketing.
Table 10: Chi-Square Test Table showing relationship between the Satisfaction Level variable and the Engagement Rate.
Chi-Square Tests | |||
Value | df | Asymptotic Significance (2-sided) | |
Pearson Chi-Square | 31.414 | 12 | .002 |
Likelihood Ratio | 22.422 | 12 | .033 |
Linear-by-Linear Association | 11.525 | 1 | .001 |
N of Valid Cases | 42 | ||
The test statistic, or Pearson chi-square value, was calculated at 12 degrees of freedom and is 341.414. The null hypothesis is accepted since the asymptotic significance value, also known as the p-value, is smaller than the significance level of 0.01, which is 0.002. It is 99% certain that if users are well satisfied with Google AR products, they would engage with them for marketing; hence, the null hypothesis is accepted.
Google AR Solutions and Integrations into Marketing
RQ2: How can Augmented Reality solutions seamlessly integrate into marketing, optimising users’ technology usage?
Google has shown examples by which AR can be integrated into marketing that other brands can maximise and use better. At each stage of the purchasing process, consumers have certain informational needs, and reality-enhancing technology must be set up to meet these needs. Existing research suggests that different augmented reality (AR) aspects, such as embodiment and environmental embedding, have varying degrees of utility for attaining certain marketing goals (Hilken et al., 2022).
Respondents were asked what components of Google AR products most stood out for them as a user, and the results are seen below.
Table 11: Frequency Distribution of Most Appealing Component
Most Appealing Component | |||||
Frequency | Percent | Valid Percent | Cumulative Percent | ||
Valid | Product Visualisation | 5 | 9.1 | 11.9 | 11.9 |
Interactive Features | 8 | 14.5 | 19.0 | 31.0 | |
Gamification | 1 | 1.8 | 2.4 | 33.3 | |
Logistics | 28 | 50.9 | 66.7 | 100.0 | |
Total | 42 | 76.4 | 100.0 | ||
Figure 16: Bar Charts Representation of Frequency Distribution of Most Appealing Component
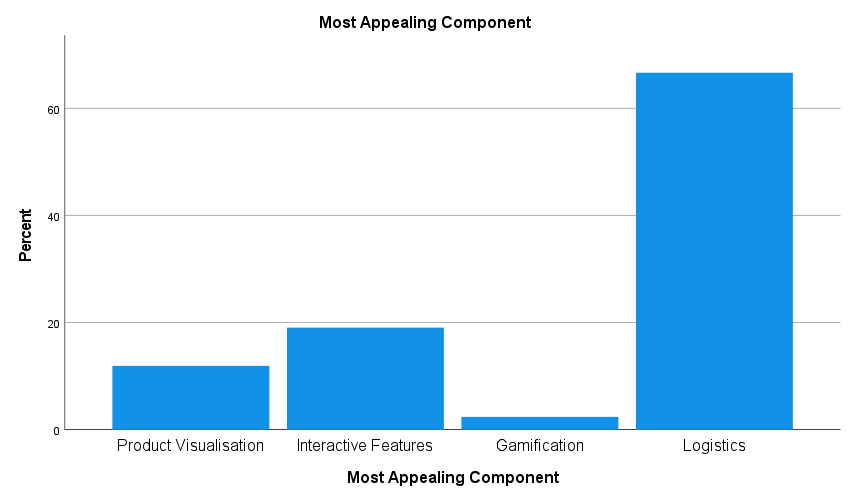
It can be seen from the illustrations above that the most appealing component selected by most users (66.7%) was Logistics which is linked to Google Maps AR in the questionnaire administered (See Appendix).
Furthermore, satisfaction level as a variable was also considered here because the integration of technologies determines how users are satisfied with it. In addition, factors affecting the responses regarding a user’s satisfaction level were considered, such as how comfortable users were when it came to privacy. Moreover, the responses and their percentages to if psychological stress was usually encountered was also recorded.
Table 12: Users’ Privacy Comfortability Rate
Frequency | Percent (%) | Valid Percent | ||
Valid | Low | 9 | 16.4 | 21.4 |
Moderate | 20 | 36.4 | 47.6 | |
High | 12 | 21.8 | 28.6 | |
Very High | 1 | 1.8 | 2.4 | |
Total | 42 | 76.4 | 100.0 | |
Privacy concerns include the fragmented regulatory environment governing reality-enhancing technologies and privacy protection measures (Hilken et al., 2022).
Null Hypothesis: There’s a relationship between how comfortable a user is with their privacy and how satisfied they are.
Alternative Hypothesis: There’s no relationship between how comfortable a user is with their privacy and how satisfied they are.
Table 13: Chi-Square Tests showing the relationship between Users’ Privacy Comfortability Rate and Satisfaction Level
Chi-Square Tests | |||
Value | df | Asymptotic Significance (2-sided) | |
Pearson Chi-Square | 51.315 | 12 | .000 |
Likelihood Ratio | 19.026 | 12 | .088 |
Linear-by-Linear Association | 10.373 | 1 | .001 |
N of Valid Cases | 42 | ||
The test statistic, or Pearson chi-square value, is 51.315 at 12 degrees of freedom. The null hypothesis is accepted since the asymptotic significance value, or p-value, is 0.000 and less than the significance level of 0.01. Hence, the confidence that there is a relationship between how comfortable a user is with their privacy and how satisfied they are. The bar chart is displayed below.
Figure 17: Bar Chart showing the relationship between Users’ Privacy Comfortability Rate and Satisfaction Level
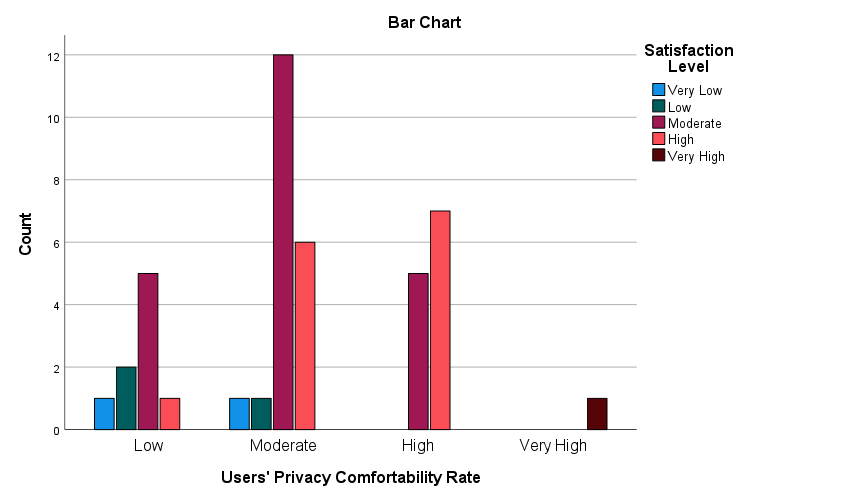
Table 14: Psychological Stress
Frequency | Percent | Valid Percent | ||
Valid | No | 38 | 69.1 | 90.5 |
Yes | 4 | 7.3 | 9.5 | |
Total | 42 | 76.4 | 100.0 | |
From the above table, it is seen that 69.1% indicated that they don’t encounter psychological stress against 7.3% who indicated that they do. This proves that Google has well-integrated their products that it doesn’t encourage stress for the users.
Google AR Products Management
RQ3: What are the various ways to manage these enhanced technologies in businesses so brands and users can fully utilise them?
The amount of information in reality that an AR system must handle is enormous. As a result, the gear should be easy to transport, lightweight, and quick enough to display graphics. Another restriction on the uses of AR is the battery life that these sophisticated AR gadgets require. In order to supply accurate markers for AR tracking, system hardware like GPS is required. As such, ask them to be sufficiently accurate and dependable. For real AR applications, certain hardware issues must be resolved (Mekni & Lemieux). As obtained from the responses, frequencies to describe the challenges often encountered, the challenging components of Google AR products and the suggested solutions to ensure proper management of these advanced technologies for marketing are displayed below.
Table 15: Frequency Distribution of Challenges
Challenges Frequencies | ||||
Responses | Percent of Cases | |||
N | Percent | |||
Challenges | Technical difficulties or glitches | 18 | 27.7% | 42.9% |
Limited compatibility with certain devices or operating systems | 7 | 10.8% | 16.7% | |
Lack of clear instructions or user guidance | 11 | 16.9% | 26.2% | |
Slow loading or performance issues | 8 | 12.3% | 19.0% | |
Insufficient available AR content | 10 | 15.4% | 23.8% | |
Inaccuracy of information provided/Misinformation | 11 | 16.9% | 26.2% | |
Total | 65 | 100.0% | 154.8% | |
Table 16: Frequency Distribution of Challenging components
Challenging Components Frequencies | ||||
Responses | Percent of Cases | |||
N | Percent | |||
Challenging Components | Ease of Use | 3 | 6.1% | 7.7% |
Hardware Requirements | 3 | 6.1% | 7.7% | |
Privacy and Security | 11 | 22.4% | 28.2% | |
Content Quality and Variety | 10 | 20.4% | 25.6% | |
Physical Discomfort | 2 | 4.1% | 5.1% | |
Cost | 9 | 18.4% | 23.1% | |
Real-world Integration Challenges | 11 | 22.4% | 28.2% | |
Total | 49 | 100.0% | 125.6% | |
The table below shows the suggested solutions to manage the challenges often encountered by users when using Google AR products. The highest percentage 25.0%, were the proportion of those that indicated the need for clearer instructions and user guides. 20.5% selected high level of information accuracy as misinformation has been indicated as one of the challenges encountered while using these advanced technologies in the tables above. 14.8% indicated the need for improved compatibility across devices and operating systems; 13.6% indicated more diverse and engaging AR content options; another 13.6% indicated enhanced stability and performance of the AR products and 12.5% selected the option of integration with popular social media platforms.
Table 17: Frequency Distribution of Suggested Solutions
Suggested Solutions Frequencies | ||||
Responses | Percent of Cases | |||
N | Percent | |||
Suggested Solutions | More diverse and engaging AR content options | 12 | 13.6% | 28.6% |
Enhanced stability and performance of the AR products | 12 | 13.6% | 28.6% | |
Clearer instructions and user guides | 22 | 25.0% | 52.4% | |
Integration with popular social media platforms | 11 | 12.5% | 26.2% | |
Improved compatibility across devices and operating systems | 13 | 14.8% | 31.0% | |
High level of information accuracy | 18 | 20.5% | 42.9% | |
Total | 88 | 100.0% | 209.5% | |
There is limited research on whether consumers are motivated to engage with businesses through reality-enhancing technologies in meaningful ways, repeatedly and in the form of positive cognitive, emotional, and behavioural responses. The literature highlights that consumers are willing to try AR due to its ease of use and hedonic features (Hilken et al., 2022). This is further buttressed by the results shown below of those who have not used Google AR products.
Table 18: Frequency Distribution of Reasons for Non-Usage.
Reasons for Non-Usage | |||||
Frequency | Percent | Valid Percent (%) | Cumulative Percent (%) | ||
Valid | Not Heard | 9 | 16.4 | 69.2 | 69.2 |
Trust Issues | 1 | 1.8 | 7.7 | 76.9 | |
Hardware Incompatibility | 1 | 1.8 | 7.7 | 84.6 | |
No Reason for Use | 1 | 1.8 | 7.7 | 92.3 | |
May not Understand | 1 | 1.8 | 7.7 | 100.0 | |
Total | 13 | 23.6 | 100.0 | ||
Missing | System | 42 | 76.4 | ||
Total | 55 | 100.0 | |||
Table 19: Frequency Distribution of Adoption Willingness.
Adoption Willingness | |||||
Frequency | Percent | Valid Percent (%) | Cumulative Percent (%) | ||
Valid | No | 1 | 1.8 | 7.7 | 7.7 |
Yes | 12 | 21.8 | 92.3 | 100.0 | |
Total | 13 | 23.6 | 100.0 | ||
Missing | System | 42 | 76.4 | ||
Total | 55 | 100.0 | |||
From table 19, it can be seen that 92.3% of those who have not used Google AR products are willing to use and adopt the technology if educated. Table 18 reveals that 69.2% of them indicated that they haven’t heard of this technology at all.
Chapter Summary
The above results were generated from data analysis using Microsoft Excel and SPSS. Critical evaluations have been done, proving the research study’s importance. In addition, Google as a company has been seen to be at the forefront of utilising augmented reality for marketing and how this has created more buzz around the brand.
According to Huang and Liao (2020), a customer’s requirements and wishes can be met in various ways and through various channels. An efficient and effective strategy, although not the only one that makes sense, is to appeal to a user’s emotions. An alternative strategy is to focus on the rational rather than the emotional parts of the customer. To be more precise, it is important to make a product as useful as possible in order for it to fulfil its intended functions and, as a result, please a consumer. Usefulness affects a technology’s user acceptance in addition to its successful purpose. This chapter provided results and discussions from the analysis of the primary data collected, giving room for further research, recommendations and contributions. This has successfully met the research objectives to inform the literature in the field of augmented reality, evaluate how users perceive and are satisfied with the technology and to create more awareness by recommending augmented reality to other brands.
A summary of the entire project is provided in this chapter. Conclusions from the findings and discussions concerning the literature review are given. Recommendations for further research work and the action plan are also stated. The limitations of the methodology processes are also discussed in this section.
Conclusions and Recommendations
Summary of the Research Study
This research study investigated, analysed and evaluated the effects of retrofitting marketing to aid business expansion using augmented reality (AR) as case study – an example of Google using Google AR products and how users perceive them as case study. The study collected responses from 55 respondents to analyse and evaluate the effectiveness of retrofitting marketing on business expansion from customers’ point of view. The thesis gives information on the use of augmented reality (AR) for marketing evaluating its opportunities and challenges.
To ensure proper and effective research work, the following objectives were developed.
RO1: To evaluate and inform studies or the literature in the topic area determining the success rate of using Augmented Reality for marketing.
RO2: To investigate how users or customers perceive or are satisfied with using or adopting these technologies.
RO3: To recommend the use of advanced technologies such as AR among brands and business owners for marketing while discussing the challenges and possible remedies associated with these technologies.
In line with the proposed aims of the study the first objective was to evaluate and inform studies or the literature in the topic area determining the success rate of using Augmented Reality for marketing which has been successfully done with the help of this research work.
Moreover, investigating how users or customers perceive or are satisfied with using or adopting these technologies has been done using Google AR products as interventions. It was observed that most users of these products are quite satisfied with the usage, judging from the responses that were given and the analysis presented in chapter 4.
With the aid of this study, recommending the use of advanced technologies such as AR among brands and business owners for marketing while discussing the challenges and possible remedies associated with these technologies have been made possible. The study presented the challenges users encounter and the possible solutions to tackle them.
AR offers a richer user experience and promotes participation and interactivity. According to research, augmented reality improves consumers’ perceptions of the value of brands and products. Effective augmented reality marketing demonstrates the creativity and reactivity of a cutting-edge brand (Ni, 2022).
The distributions for a group of conceptually related variables with the same response categories are shown together in a combined frequency display under common headers for the responses in the results and analysis chapter. Compressed frequency displays can convey cross-tabular data and summary statistics more effectively by eliminating extraneous percentages (like those corresponding to a dichotomous variable’s second value) and the requirement for repetitious labels just as seen in the previous chapter.
According to Huang and Liao (2020), Technology Acceptance Model (TAM) is suitable for anticipating the most important benefits in motivating customers to continue using interactive technologies. The TAM contends that the information system’s perceived utility and usability significantly impact customers’ intentions to utilise interactive technology. Perceived simplicity of use suggests that a user will not have to engage all of their cognitive abilities to operate a technology. According to the relationship marketing paradigm, consumers will uphold a devoted relationship and engage in sustainable relationship behaviour with interactive technology to reap its benefits, assessed by perceived usefulness and perceived ease of use (Huang and Liao, 2020).
Conclusions
The research project has been able to answer the research questions presented. Indeed, as presented by the analysis there are significant effects that augmented reality poses on marketing which answers RQ1. Secondly, AR can be integrated seamlessly, using Google AR products as examples, when users’ comfortability and the usefulness of the product is considered which gives an answer to RQ2. Finally, constant management is needed after integration which can be seen from the responses given by respondents. A lot of challenges are still being encountered and this study has presented suggested solutions as inquired by RQ3.
Using mobile devices, mobile augmented reality (AR) expands the physical world with virtual items and information. Technical AR and mobile device aspects, such as the AR technology’s marketability and the devices’ capability to produce a fluid AR experience, drive the adoption of mobile AR. Mobile AR is more widely used for creative, commercial, and cognitive objectives. UE studies are increasingly being conducted to tailor mobile AR technologies to end-users. In order to evaluate the created experience of mobile AR users, surveys are frequently employed in conjunction with a variety of evaluation techniques, such as usage questionnaires by the Technology Acceptance model has been displayed in this research study (Davidaviciene, Raudeliuniene, & Virsilaite, 2020)). Google has made almost all its AR products available for mobile usage (Google, 2023), which is quite comfortable for customers or users.
Recommendations and Action Plan
The following are recommendations and action plans to be taken, noted at the completion of this research study.
Education, training and guides should be provided to ensure that the awareness gap among individuals be bridged. From the results of the data analysis, the rate at which individuals who do not know about Google AR products are willing to use them if educated leaves an awareness gap that needs to be addressed.
More awareness should be made to inform people about these advanced technologies; training and mentorship programmes can be organised in schools and communities for effective utilisation. These technologies should be used publicly by countries like their national usage in the UK. The National Health Service of the UK combined interactive billboards with augmented reality to reach the target of 200,000 blood donations during the 2016 National Blood Week (Hilken et al., 2022).
Timely updates should be done to constantly improve users’ interaction with AR technologies which includes a better UI/UX.
Limitations of the Study
This study purposed to analyse how marketing infused with advanced technologies such as AR can foster business expansion, considering Google as a case study brand. However, being a premium brand, results and findings may not be suitable or applicable to upcoming brands in remote regions. This study focuses only on Augmented Reality as an advanced technology. Not many individuals or users are familiar with or understand this technology used for marketing. Random sampling was used to get samples for analysis; only available samples were obtained. Respondents were users; hence, detailed information was not provided from the brand management end.
Moreover, while collecting the data, the locations of users answering the questionnaire were not asked, and as a result, respondents may need to be more widely dispersed. Location as a demographic may have been an important factor in segregating positive responses from negative responses regarding using Google AR products. The period wherein the questionnaire was made available was also short. Hence, more responses were needed for a study with fewer criteria. In addition, during analysis, the question enhances or detract would have best been separated to analyse what weighs more – enhancement or detraction properly?
This research study also did not look at the mode of technical integrations, the process of integration from the developer or manager’s end and the cost of financing; modes and types of devices which users employ to make use of Google AR products were not asked. Additionally, only four examples of Google AR products were emphasised in this study.
Considerations for Future work
Technologies that enhance reality have the power to both create and destroy value for consumers. Future research must therefore adopt a comprehensive approach to evaluate what, when, and how much to present to consumers through reality-enhancing technologies in a setting that is becoming more digitally cluttered, with growing privacy challenges and concerns about consumer well-being due to sensory overload, distorted perceptions of reality, and amplified social dynamics on social media. Additionally, if reality-improving technologies represent the next stage of the Internet’s development (i.e., the “Metaverse”), important questions about digital exclusion for those unable or unwilling to use these technologies will also become important for marketers and policymakers in particular (Hilken et al., 2022).
As stated by Hilken et al. (2022), the significance of considering a number of the inherent challenges of this innovative class of technologies when pursuing the opportunities attached is emphasised for future study. One of these is the ongoing ambiguity surrounding the conceptual and technological distinctions between the two primary classes of reality-enhancing technologies (AR and VR), making it difficult to choose when to choose. Developments in “Mixed Reality,” which aims to combine AR and VR characteristics, are exacerbating this problem by creating, for instance, virtual areas within physical ones (such as a virtually themed restaurant experience).
From the results, no respondent indicated being familiar with or having used ARCore, a significant product of Google, to help create, integrate, adopt and manage AR features (Google, 2021). Further research can be done on this Google AR product to boost its awareness and look into the space’s challenges. Moreover, devices deployed on these AR platforms or products should be thoroughly researched regarding hardware compatibility and user experience.
Future studies should use the personalisation privacy paradox as a psychological mechanism in this investigation. The underlying idea is that consumers trade off privacy concerns for personalisation’s convenience. Access to goods and services that users can co-create in a way that suits their particular preferences could reduce or increase privacy worries about reality-enhancing technologies (Hilken et al., 2022).
Contributions of the Study
The success of AR is due in part to the fact that consumers are unaware that it even exists. It provides value for the broadcast audience and is smoothly integrated into the broadcast experience (Baratali et al., 2016). Google has been seen to apply this thoroughly because a pre-test was conducted before the commencement of the data collection. This pre-test revealed that without the options indicated for the usage of Google AR products question, most respondents would have selected ‘No’ (as seen in the appendix); that is, they are using these products, but because of how seamless the integration was, it did not occur to them that AR must have been infused.
The illustration below shows the proportion of responses of those that selected ‘Yes’ and ‘No’ in the pre-test questionnaire.
Figure 1: Image showing the proportion of Yes or No Responses from the Pre-test.
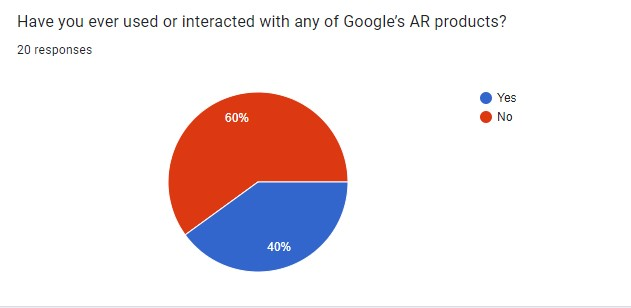
This research product has been able to inform policies, debates, and existing literature on augmented reality for marketing while focusing on Google AR products. It has substantially improved the awareness of Google products that have AR infused in them. Moreover, Hilken et al. (2022) stated that a research agenda that aids in easing current and developing privacy concerns and offers more dependable experiences is urgently needed to solve these difficulties and offer customers the safeguards and guarantees they so much need, which this research study has done.
REFERENCES
Baratali E. et al. (2016) ‘Effective of Augmented Reality (AR) in Marketing Communication; A Case Study on Brand Interactive Advertising’, International Journal of Management and Applied Science, 2 (4), pp. 133 – 137.
Boland M. (2020) ‘Will Google Swirl Unlock AR Advertising’s Next Stage?’, ARInsider Blog. Available at: https://arinsider.co/2020/07/20/will-google-swirl-unlock-ar-advertisings-next-stage/ [Figure accessed: 15th August, 2023]
Chen R. (2020) ‘The Role of Augmented Reality in Retail Settings: A Systematic Literature Review and Research Agenda’, The University of Manchester, pp. 10 – 113. Available at: https://research.manchester.ac.uk/files/162160711/FULL_TEXT.PDF
Dafnis C. V. et al. (2023) ‘Applications Analyses, Challenges and Development of Augmented Reality in Education, Industry, Marketing, Medicine, and Entertainment’, MDPI Applied Sciences, 13(5), pp. 1 – 30. Available at: https://doi.org/10.3390/app13052766
Davidaviciene V., Raudeliuniene J. & Virsilaite R. (2020) ‘Evaluation of User Experience in Augmented Reality Mobile Applications’, Journal of Business Economics and Management, 22 (2), pp. 467–481. Available at: https://doi.org/10.3846/jbem.2020.13999
Dissanayake E. V. A. (2023) ‘Research Onion: A Systematic Approach for Designing Research Methodology. Part One’, ResearchGate Publication, pp. 2 – 8. Available at: DOI: 10.13140/RG.2.2.24466.12489
Donat, B. () ‘Impact of Technology on the Business Strategy Performance Relationship in Building Core Competence in Uganda Small Medium Enterprises (SME’s)’, The Wuhan University of Technology, China, 7, pp. 39 – 43.
Erbas C. & Atherton S. (2020) ‘A Content Analysis of Augmented Reality Studies Published in 2017’, Journal of Learning and Teaching in Digital Age, 5 (1), pp. 7-15.
Farhan R. (2019) ‘Understanding Postmodernism: Philosophy and Culture of Postmodern’, International Journal Social Sciences and Education, 2 (4), pp. 22-31. Available at: DOI:10.13140/RG.2.2.33590.04165
Fleming J. & Zegwaard K. E (2018) ‘Methodologies, methods and ethical considerations for conducting research in work-integrated learning’, International Journal of Work-Integrated Learning, 19 (3), pp. 205-213.
Francesca H. (2019) ‘The Impact of New Technology on Marketing’, Digital Marketing World Forum. Available at: https://www.digitalmarketing-conference.com/the-impact-of-new-technology-on-marketing/
Google (2021) ‘Create with Google – ARCore’. Available at: https://www.thinkwithgoogle.com/future-of-marketing/creativity/arcore/
Hall C. (2023) ‘What is Google Maps AR navigation and Live View and how do you use it?’, Pocket-Lint Newsletter. Available at: https://www.pocket-lint.com/what-is-google-maps-ar-navigation-live-view/#:~:text=Well%2C%20it%20uses%20the%20camera,position%20you%20on%20the%20map.
Hilken, T. et al. (2022) ‘Disrupting marketing realities: A research agenda for investigating the psychological mechanisms of next‐generation experiences with reality‐enhancing technologies’, Psychology and Marketing, Wiley, 39, pp. 1660 – 1671. Available at: DOI: 10.1002/mar.21678
Huang T. & Liao S. (2014) ‘A model of acceptance of augmented-reality interactive technology: the moderating role of cognitive innovativeness’, Electron Commer Res, 15, pp. 269–295. Available at: DOI 10.1007/s10660-014-9163-2
Kenaphoom S. (2021) ‘Introduction to Research Philosophy’, Journal of Anthropological and Archaeological Sciences, 5 (4), pp. 657 – 663. Available at: DOI: 10.32474/JAAS.2021.05.000217
Kumar K. N. et al. (2016) ‘Factors Influencing Adoption of Augmented Reality for E-Commerce’, Pacific Asia Conference on Information Systems 16th Proceedings (PACIS), 6 (27), pp. 2 – 8.
Mekni M. & Lemieux () ‘Augmented Reality: Applications, Challenges and Future Trends’, Applied Computational Science, pp. 205 – 214.
Michael, E. P. & James, E. H. (2017) ‘Why Every Organisation Needs an Augmented Reality Strategy’, Harvard Business Review. Available at: https://hbr.org/2017/11/why-every-organization-needs-an-augmented-reality-strategy
Multani N. (2020) ‘Postmodernism: The Researcher and the Researched’, In book: Research Methodology, Publisher: Mohan Law House, pp.167-181. Available at: https://www.researchgate.net/publication/341987776_Postmodernism_The_Researcher_and_the_Researched
Nieva R. (2017) ‘Forget rainbow vomit. Google Lens is AR you can actually use’, CNET Blog. Available at: https://www.cnet.com/tech/mobile/google-lens-is-augmented-ar-you-can-actually-use-snapchat-facebook-instagram/
Ni L. B. (2022) ‘Usability of Augmented Reality Learning with Google’, Muallim Journal of Social Science and Humanities, 6 (2), pp. 20 – 30. Available at: https://doi.org/10.33306/mjssh/189
Odoh M. & Chinedum E. I. (2014) ‘Research Designs, Survey, and Case Study’, IOSR Journal of VLSI and Signal Processing (IOSR-JVSP), 4 (6), pp. 16 – 22. Available at: www.iosrjournals.org
O’Gorman K. & MacIntosh R. (2016) ‘Chapter 4 – Research Philosophy and Paradigm’, Oxford: Goodfellow Publishers, pp. 59 – 62. Available at: http://dx.doi.org/10.23912/978-1-910158-88-3-3232
Orús, C., Ib´a˜nez-S´anchez, S. & Flavi´an, C (2021) ‘Enhancing the customer experience with virtual and augmented reality: The impact of content and device type’, International Journal of Hospitality Management, 10(3), pp. 2 – 14. Available at: https://doi.org/10.1016/j.ijhm.2021.103019
Owens L. K (2002) ‘Introduction to Survey Research Design’, SRL Fall 2002 Seminar Series. Available at: http://www.srl.uic.edu
Pascuccil, F., Savelli, E. & Gistri (2023) ‘How digital technologies reshape marketing: evidence from a qualitative investigation’, Italian Journal of Marketing, pp. 27 – 58. Available at: https://doi.org/10.1007/s43039-023-00063-6
Philipp A.R et al. (2022) ‘What is augmented reality marketing? Its definition, complexity, and future’, Journal of Business Research, 142, pp. 1140 – 1150. Available at: https://doi.org/10.1016/j.jbusres.2021.12.084
Ponto J. (2015) ‘Understanding and Evaluating Survey Research’, Winona State University, Rochester, Minnesota, 6 (2) pp. 168 – 171. Available at: https://www.researchgate.net/publication/286445115_Understanding_and_Evaluating_Survey_Research
Rauschnabel, P. A. et al. (2022) ‘What is augmented reality marketing? Its definition, complexity, and future’, Journal of Business Research, 14(2), pp. 1140 -1150. Available at: https://doi.org/10.1016/j.jbusres.2021.12.084
Remmerdan L. V. (2019) ‘Putting the AR in Marketing’, Bachelor Thesis in communication Science, University of Twente, pp. 3 – 48.
Riar M. et al. (2021) ‘The Use of Augmented Reality in Retail: A Review of Literature’, Proceedings of the 54th Hawaii International Conference on System Sciences, pp. 638 – 647. Available at: https://hdl.handle.net/10125/70689
Riham, A. (2022) ‘Augmented Reality (AR) Generated Value-in-Use Experiences: Literature Review and Analysis’, Arab Journal of Administration, 44 (3), pp. 227 – 241. Available at: DOI:10.21608/aja.2021.108470.1182
Romano B., Pallat J. & Sands S. (2020) ‘Augmented Reality and the Customer Journey: An Exploratory Study’, Australian Marketing Journal (AMJ), pp. 1 – 35. Available at: DOI: 10.1016/j.ausmj.2020.06.010
Roxo M. T. & Brito P. Q (2018) ‘Augmented Reality Trends to the Field of Business and Economics: A Review of 20 years of Research’, Asian Journal of Business Research, 8 (2), pp. 94 – 117. Available at: 10.14707/ajbr.180051
Ruiz G. R. et al. (2019) ‘Augmented Reality as a Marketing Strategy for the Positioning of a Brand’, Instituto Politecnico Nacional, pp. 169 – 199. Available at: DOI: 10.4018/978-1-5225-6980-0.ch010
Saunders et al. (2019) ‘Developing and Publishing Strong Empirical Research in Sustainability Management—Addressing the Intersection of Theory, Method, and Empirical Field’, Scientific Figure on ResearchGate. Available from: https://www.researchgate.net/figure/Research-onion-Saunders-et-al-2019-p-108_fig1_349083776 [accessed 26 Jul, 2023]
Saunders M, Lewis P. &Thornhill A. (2007) ‘Research Methods for Business Students’, Fourth Edition, Pearson Education Limited, pp. 2 – 408.
Saunders M., Lewis P. &Thornhill A. (2015) ‘Understanding research philosophy and approaches to theory development’, pp. 122 – 161. Available at: https://www.researchgate.net/publication/309102603
Saunders M. & Tosey P. (2013) ‘The Layers of Research Design’, pp. 58 & 59. Available at: https://www.csd.uoc.gr/~hy109/resources/layers.pdf
Shreya, M (2022) ‘What is Augmented Reality and How can it drive Growth?’ G2 – Business Software Reviews. Available at: https://www.g2.com/articles/augmented-reality
Sirakaya M. & Sirakaya D. A. (2018) ‘Trends in Educational Augmented Reality Studies: A Systematic Review’, Malaysian Online Journal of Educational Technology, 6 (2), pp. 60 – 74. Available at: http://dx.doi.org/10.17220/mojet.2018.04.005
Solankey A. (2020) ‘The influence of Augmented Reality (AR) on marketing strategies of fashion retailing goods, the effects on consumer tastes, consumer viewpoints on AR instruments’, PalArch’s Journal of Archaeology of Egypt/Egyptology, 17 (12), pp. 530 – 551.
Vafa, S., Sappington, K. & Coombs-Richardson, R. (2018) ‘Using Augmented Reality to Increase Interaction in Online Courses’, International Journal of Educational Technology and Learning, 3(2), pp. 65 – 68. Available at: DOI: 10.20448/2003.32.65.68
Villagram-Vizcarra et al. (2023) ‘Applications Analyses, Challenges and Development of Augmented Reality in Education, Industry, Marketing, Medicine, and Entertainment’, MDPI Applied Sciences Review, 13, pp. 1 – 30. Available at: https://doi.org/10.3390/app13052766
Yi, F. W. & Eun, Y. K. (2022) ‘User’s Perceptions of Technological Features in Augmented Reality (AR) and Virtual Reality (VR) in Fashion Retailing: A Qualitative Content Analysis’, Hindawi Mobile Information Systems, pp. 1-13. Available at: https://doi.org/10.1155/2022/3080280
Yuen, S., Yaoyuneyong, G. & Johnson, E. (2011) ‘Augmented reality: An overview and five directions for AR in education’, Journal of Educational Technology Development and Exchange, 4(1), pp. 119-140.
Zhao D., Jun L. and Tianjiao W. (2022) ‘Augmented Reality Marketing: A Systematic Literature Review and an Agenda for Future Inquiry’, Business School of Sport, China, 13, pp. 104 – 456. Available at: https://doi.org/10.3389/fpsyg.2022.925963
APPENDIX
Final Questionnaire
Effectiveness of Google’s AR products
Section 1 of 3
Participation is voluntary but only open to those who are 18 years and above. Completing the questionnaire should take about 5 minutes and will be anonymous. All data will be confidential and no personal information is required.
Thank you.
(required)What is your Gender?
Male
Female
Prefer not to say
(required)Kindly choose your age range
18-26
27-35
36-45
46-60
(required)What’s your social status?
Student
Unemployed
Employed
Self-employed
(required)Have you ever used or interacted with any of Google’s Augmented Reality (AR) products (e.g Google Maps AR, Google Lens, …)
Yes
No
Section 2 of 3
SECTION TWO: QUESTIONS BASED ON OBJECTIVES
(required)How familiar are you with Google’s AR products?
Not familiar
1
2
3
4
5
Very familiar
(required)Which Google AR product have you used or are you familiar with?
Google Lens
ARCore
Google Swirl
Google Maps AR
Other…
(required)How effective do you find Google’s AR products in capturing and retaining your attention as a user?
Very Poor
1
2
3
4
5
Excellent
In what ways have you seen or experienced Google’s AR products being used?
(required)How likely would you engage with a product or service offered via Google’s AR products?
Very Unlikely
1
2
3
4
5
Very Likely
(required)Have you ever made a purchase or considered making a purchase after experiencing a product or service through Google’s AR products?
Yes
No
(required)Do you think Google’s AR products have any effect (i.e. enhance or detract) on your overall experience as a user?
Yes
No
(required)What are the main challenges you have encountered when using Google’s AR products? (Select all that apply)
Technical difficulties or glitches
Limited compatibility with certain devices or operating systems
Lack of clear instructions or user guidance
Slow loading or performance issues
Insufficient available AR content
Inaccuracy of information provided/Misinformation
Other…
(required)How satisfied are you with the overall functionality and usability of Google’s AR products?
Very dissatisfied
1
2
3
4
5
Very satisfied
(required)What aspects of Google’s AR products do you find most challenging? (Select all that apply)
Ease of Use
Hardware Requirements
Devices’ Battery-Life
Privacy and Security
Content Quality and Variety
Physical Discomfort
Cost
Real-world Integration Challenges
Other…
(required)How often do you encounter performance issues (e.g., lag, crashes) when using Google’s AR products?
Frequently
Occasionally
Rarely
Never
(required)On a scale of 1-5, how comfortable are you using Google AR Products when it comes to Users’ Data Privacy?
Very uncomfortable
1
2
3
4
5
Very comfortable
(required)Does using Google AR products encourage psychological or mental stress for you?
Yes
No
(required)Which of the following would improve your satisfaction level when using Google’s AR products for marketing? (Select all that apply)
More diverse and engaging AR content options
Enhanced stability and performance of the AR products
Clearer instructions and user guides
Integration with popular social media platforms
Improved compatibility across devices and operating systems
High level of information accuracy
Other…
(required)How likely are you to continue using Google’s AR products in the future?
Very unlikely
1
2
3
4
5
Very likely
(required)What aspects of Google’s AR products do you find most appealing?
Product visualization (e.g. Google Lens)
Interactive features (Google AI-powered voice assistant, Google Meet)
Gamification
Logistics (Google Maps AR)
Other…
(required)How likely are you to recommend the use of Google’s AR products to others?
Very unlikely
1
2
3
4
5
Very likely
Aside from Google AR products, what other brand of AR products have you used?
Section 3 of 3
NO EXPERIENCE WITH GOOGLE AR
(required)You stated that you haven’t used any of Google AR products, what could be the reason?
I just haven’t heard of it
I don’t trust such technologies
Hardware Incompatibility
I don’t see a reason to use Google AR products
I may not understand how it works
I have used other AR products that are not Google-developed
Other…
Aside from Google AR products, what other brand of AR products have you used?
(required)If you were educated on the use of Google AR products, would you adopt its usage?
Yes
No
Satisfaction Level and Recommendation Level
Symmetric Measures | |||||
Value | Asymptotic Standard Errora | Approximate Tb | Approximate Significance | ||
Nominal by Nominal | Phi | .908 | .001 | ||
Cramer’s V | .524 | .001 | |||
Interval by Interval | Pearson’s R | .611 | .098 | 4.879 | .000c |
Ordinal by Ordinal | Spearman Correlation | .558 | .121 | 4.249 | .000c |
N of Valid Cases | 42 | ||||
Performance Issues and Satisfaction Level
Symmetric Measures | |||||
Value | Asymptotic Standard Errora | Approximate Tb | Approximate Significance | ||
Nominal by Nominal | Phi | .332 | .798 | ||
Cramer’s V | .234 | .798 | |||
Interval by Interval | Pearson’s R | -.108 | .132 | -.689 | .495c |
Ordinal by Ordinal | Spearman Correlation | -.099 | .147 | -.627 | .534c |
N of Valid Cases | 42 | ||||
Satisfaction Level and Engagement Rate
Symmetric Measures | |||||
Value | Asymptotic Standard Errora | Approximate Tb | Approximate Significance | ||
Nominal by Nominal | Phi | .865 | .002 | ||
Cramer’s V | .499 | .002 | |||
Interval by Interval | Pearson’s R | .530 | .116 | 3.955 | .000c |
Ordinal by Ordinal | Spearman Correlation | .497 | .128 | 3.619 | .001c |
N of Valid Cases | 42 | ||||
The symmetric measures of User’s Privacy Comfortability Rate and its effects on determining Satisfaction Levels
Symmetric Measures | |||||
Value | Asymptotic Standard Errora | Approximate Tb | Approximate Significance | ||
Nominal by Nominal | Phi | 1.105 | .000 | ||
Cramer’s V | .638 | .000 | |||
Interval by Interval | Pearson’s R | .503 | .119 | 3.681 | .001c |
Ordinal by Ordinal | Spearman Correlation | .481 | .123 | 3.467 | .001c |
N of Valid Cases | 42 | ||||
Continuity Rate and Recommendation Rate of Users
Continuity Rate * Recommendation Rate Crosstabulation | |||||||
Recommendation Rate | Total | ||||||
Low | Moderate | High | Very High | ||||
Continuity Rate | Very Low | Count | 1 | 0 | 0 | 0 | 1 |
% of Total | 2.4% | 0.0% | 0.0% | 0.0% | 2.4% | ||
Low | Count | 1 | 3 | 0 | 0 | 4 | |
% of Total | 2.4% | 7.1% | 0.0% | 0.0% | 9.5% | ||
Moderate | Count | 1 | 8 | 3 | 0 | 12 | |
% of Total | 2.4% | 19.0% | 7.1% | 0.0% | 28.6% | ||
High | Count | 0 | 3 | 13 | 1 | 17 | |
% of Total | 0.0% | 7.1% | 31.0% | 2.4% | 40.5% | ||
Very High | Count | 0 | 0 | 1 | 7 | 8 | |
% of Total | 0.0% | 0.0% | 2.4% | 16.7% | 19.0% | ||
Total | Count | 3 | 14 | 17 | 8 | 42 | |
% of Total | 7.1% | 33.3% | 40.5% | 19.0% | 100.0% | ||
Symmetric Measures | |||||
Value | Asymptotic Standard Errora | Approximate Tb | Approximate Significance | ||
Nominal by Nominal | Phi | 1.197 | .000 | ||
Cramer’s V | .691 | .000 | |||
Interval by Interval | Pearson’s R | .825 | .050 | 9.226 | .000c |
Ordinal by Ordinal | Spearman Correlation | .827 | .059 | 9.309 | .000c |
N of Valid Cases | 42 | ||||
Recommendation Rate | Total | ||||||
Low | Moderate | High | Very High | ||||
Satisfaction Level | Very Low | Count | 1 | 1 | 0 | 0 | 2 |
% of Total | 2.4% | 2.4% | 0.0% | 0.0% | 4.8% | ||
Low | Count | 2 | 1 | 0 | 0 | 3 | |
% of Total | 4.8% | 2.4% | 0.0% | 0.0% | 7.1% | ||
Moderate | Count | 0 | 9 | 11 | 2 | 22 | |
% of Total | 0.0% | 21.4% | 26.2% | 4.8% | 52.4% | ||
High | Count | 0 | 3 | 6 | 5 | 14 | |
% of Total | 0.0% | 7.1% | 14.3% | 11.9% | 33.3% | ||
Very High | Count | 0 | 0 | 0 | 1 | 1 | |
% of Total | 0.0% | 0.0% | 0.0% | 2.4% | 2.4% | ||
Total | Count | 3 | 14 | 17 | 8 | 42 | |
% of Total | 7.1% | 33.3% | 40.5% | 19.0% | 100.0% | ||
Cross-tabulation of Satisfaction Level and Recommendation Rate
Symmetric Measures | |||||
Value | Asymptotic Standard Errora | Approximate Tb | Approximate Significance | ||
Nominal by Nominal | Phi | .907 | .001 | ||
Cramer’s V | .524 | .001 | |||
Interval by Interval | Pearson’s R | .617 | .114 | 4.963 | .000c |
Ordinal by Ordinal | Spearman Correlation | .607 | .112 | 4.836 | .000c |
N of Valid Cases | 42 | ||||
Attention Rate and Continuity Rate
Crosstab | ||||||||
Continuity Rate | Total | |||||||
Very Low | Low | Moderate | High | Very High | ||||
Attention Rate | Very Low | Count | 1 | 0 | 0 | 0 | 0 | 1 |
% of Total | 2.4% | 0.0% | 0.0% | 0.0% | 0.0% | 2.4% | ||
Low | Count | 0 | 1 | 2 | 1 | 0 | 4 | |
% of Total | 0.0% | 2.4% | 4.8% | 2.4% | 0.0% | 9.5% | ||
Moderate | Count | 0 | 2 | 9 | 5 | 1 | 17 | |
% of Total | 0.0% | 4.8% | 21.4% | 11.9% | 2.4% | 40.5% | ||
High | Count | 0 | 1 | 1 | 11 | 6 | 19 | |
% of Total | 0.0% | 2.4% | 2.4% | 26.2% | 14.3% | 45.2% | ||
Very High | Count | 0 | 0 | 0 | 0 | 1 | 1 | |
% of Total | 0.0% | 0.0% | 0.0% | 0.0% | 2.4% | 2.4% | ||
Total | Count | 1 | 4 | 12 | 17 | 8 | 42 | |
% of Total | 2.4% | 9.5% | 28.6% | 40.5% | 19.0% | 100.0% | ||
Chi-Square Tests | |||
Value | df | Asymptotic Significance (2-sided) | |
Pearson Chi-Square | 61.500a | 16 | .000 |
Likelihood Ratio | 29.772 | 16 | .019 |
Linear-by-Linear Association | 16.714 | 1 | .000 |
N of Valid Cases | 42 | ||
Symmetric Measures | |||||
Value | Asymptotic Standard Errora | Approximate Tb | Approximate Significance | ||
Nominal by Nominal | Phi | 1.210 | .000 | ||
Cramer’s V | .605 | .000 | |||
Interval by Interval | Pearson’s R | .638 | .115 | 5.247 | .000c |
Ordinal by Ordinal | Spearman Correlation | .617 | .107 | 4.958 | .000c |
N of Valid Cases | 42 | ||||
Cite This Work
To export a reference to this article please select a referencing stye below:

Academic Master Education Team is a group of academic editors and subject specialists responsible for producing structured, research-backed essays across multiple disciplines. Each article is developed following Academic Master’s Editorial Policy and supported by credible academic references. The team ensures clarity, citation accuracy, and adherence to ethical academic writing standards
Content reviewed under Academic Master Editorial Policy.