Abstract
Skin disorders have a reduced mortality rate than other diseases, but because they cause sensations like pain, discomfort, and itching, they have a bigger influence on quality of life. One of the common skin conditions that is immune-mediated and chronically inflammatory is psoriasis. According to estimates, 1.8 billion individuals worldwide have some kind of skin illness. Proper examination at the right time helps better. There are various methods in use. To overcome the drawbacks of the existing approaches, a method called the multi-level fuzzy aware denoising technique with a gradient-enhanced convolution network with a level classifier is proposed for detecting and classifying psoriasis disease. Initially, pre-processing is done by using techniques like 3-level de-noising, Image enhancement (CLAHE using Game-based optimization algorithm), Image Augmentation and Geometric transformations, and Greyscale conversion. The next step is feature extortion, in which the required features are extracted using GBO. The final step is the classification by which the result will be obtained like whether the given input is normal or abnormal using the approach called Gradient Feature Boosted Region Convolutional Neural Network (GFB-RCNN) with a Self-attention based dual Multi-Layer Perception (MLP) (SA-DMLP) is proposed. The suggested method has an Accuracy of about 98.7%. From the results, it is seen that the suggested approach has proven to be better than the methods in use.
1. Introduction
A chronic condition, psoriasis mostly affects the skin and joints. People under the age of 30 are affected by it. Patients with psoriasis have higher levels of body weight, diabetic complications, cardiovascular illness, and hypertension. Psoriasis may raise your risk of heart attack, stroke, and myocardial infarction. p40-neutralizing antibodies, a medication used to treat Alzheimer’s disease, have also been reported to be useful in treating psoriasis. This illness requires routine, disciplined care and treatment [1]. Dermatologists currently treat patients using subjective testing techniques like visual inspection and traditional testing. The severity of a difficult psoriasis condition must be assessed subjectively, depending on the skills and knowledge of a qualified medical specialist. Furthermore, it is challenging to distinguish the damage due to the range of colours in the area. Due to the possibility of inconsistent results between and among observers, the subject analysis is imprecise and time-consuming. Consequently, an objective analysis is required for a prompt, accurate, and successful diagnosis [2]. Though DL is utilized, implementing ML approaches to identify skin illnesses involves a number of challenges and limitations. Lack of sufficient data is one of the main obstacles to testing and training machine learning models for skin imaging data. The lack of exceptionally good pictures may limit machine-learning algorithms [3]. Additionally, traditional machine learning algorithms may find it challenging to manage and locate image-based data due to its high dimensionality and complexity. When treating complicated skin illnesses like eczema and psoriasis in particular, proper diagnosis is required. For such requirements, “Derma Care” is used to overcome the challenges and limitations [4].
Recently, the primary focus of biological prognostic indicators (biomarkers) has drawn more attention from those who study psoriatic disease. Research on biomarkers may help to understand the aetiology of psoriatic disease by revealing previously unrecognized delaying processes and the new disease. Most of the original biomarker research in PsA was done in a single modality, or omic, study [5]. Several studies have been associated with the diagnosis of PsA. The future of psoriatic disease biomarker research is changing in the direction of emerging technologies like metabolomics. Sugars and organic and inorganic acids are just a few examples of the diverse small molecules (1500 Da) that are carefully studied by the “omics” expanding field known as metabolomics science. The metabolome (MB) is a rapid indicator of biological health [6]. Genetic changes take longer to become apparent than changes in the metabolome, which changes and evolves constantly. As a result, MB provides insight into the physiological condition of a living entity at a specific time. The MB, in addition to genetics, reflects the environment and microbiome [7]. DL approaches can accurately predict and classify skin problems in a variety of skin diseases. Skin analysis develops algorithms by utilizing the Mask-RCNN in skin pictures to categorize frameworks for skin lesion diagnosis, such as psoriasis [8]. All these methods are used for the same kind of skin issue. The five primary types of psoriasis have not been classified using any DL techniques. As far as we are aware, the body is also frequently hurt, particularly the skin’s delicate areas. Over 3000 various ways skin disorders can manifest themselves. A sickness that detracts from one’s looks will have an important effect and may inflict excruciating pain and irreparable injury [9]. The majority of chronic skin conditions, including atopic eczema, psoriasis, vitiligo, and leg ulcers, can be categorized as substantial fitness problems, having negative effects on one’s physical, psychological, and economic well-being. Skin malignancies, on the other hand, have the potential to be lethal because of their duration and difficulty [10].
Our skin, which is the most important organ, shields us from illnesses and temperature fluctuations. Skin diseases like psoriasis affect millions of individuals globally, including Malaysians. The current study examines convolutional neural networks for psoriasis categorization in order to make an accurate diagnosis [11]. Psoriatic arthritis (PsA), a prevalent chronic skin condition that usually coexists with psoriasis (Pso), can drastically reduce a person’s standard of lifestyle. It is difficult to identify PsA in psoriasis patients in a timely manner because of the range of illness symptoms [12]. It looks into how specific immune cell profiles, analyzed by flow cytometry and machine learning, can distinguish PsA patients from those with psoriasis alone, enabling early detection and care. Medical imaging is now crucial for the detection and treatment of disorders like skin issues [13]. Skin disorders affect overall health, are frequently challenging to diagnose, and need time. Machine learning and image processing enable quicker, more precise replies. These techniques are used in this study’s analysis to detect psoriasis, cherry angiomas, melanoma, and acne [14]. Skin lesions are a common sign of psoriatic arthritis (PsA), which is frequently diagnosed in patients with psoriasis. Early detection is crucial yet challenging. Utilising genetics and machine learning, this study assesses psoriasis sufferers [15].
2. Related Works
Alenezi 2019 [16] recommended using image processing to determine skin problems. Using image analysis, this method examined a digital picture of the affected area for detection. The recommended plan of action is easy and efficient. It is done using the input pictures. The feature was classified by a multiclass SVM. Results are then displayed to the user, together with information about the disease’s type, distribution, and severity. The technology can precisely recognize three different types of skin disorders with a 100% accuracy rate.
Goceri 2021 [17] Using CNN-based lightweight architectures, the classification of five prevalent skin disorders was examined. Psoriasis, acne vulgaris, hemangiomas, rosacea, seborrheic dermatitis, and hemangiomas are among these conditions. The Mobile Net model was changed to give incredibly precise real-time illness diagnosis. The model is combined with the Cross-Entropy Loss Function and three convolution filters from the Mobile Net in the Rectified Linear Unit (ReLU). The work’s three main contributions are (i) a modified MobileNet architecture, (ii) a novel hybrid loss function, and (iii) the development and implementation of a mobile phone application. In 94.76% of cases, the suggested method may successfully detect skin disorders.
Fraiwan and Faouri 2022 [18] The application of unsupervised DL to classify skin disorders. A thorough investigation concludes both the benefits and drawbacks of this approach. Despite the fact that numerous cancer kinds were effectively and correctly categorised, the dataset imbalance resulted in an accuracy of about 83%.
Inthiyaz et al. 2023 [19] proposed an image processing, machine learning, and DL-based skin disease diagnosis tool. Tools that accurately diagnose relevant skin conditions are non-invasive and simple to use. The patient’s infected skin areas must provide feedback. A very small percentage of errors can be used to identify high-precision methods and image model training.
Wisniewski et al. 2023 [20] said that the setup uses 75 individuals with psoriasis and 75 participants without psoriasis in several training and testing groups. Every patient has a distinct quantity of clinical pictures taken of them. These images are then cropped to produce scans that are 256 by 256 pixels in size. The configuration provided to transfer the neural network weights applied to clinical photographs of dermatoses in the ImageNet non-medical domain makes use of the supplementary element of Transfer learning. The obtained levels of recall and precision were about 82% and 85%, respectively. The accuracy is about 80%, and the level of trust is 95%. Zhou et al. 2023 [21] suggested a method by correlation analyses between the chosen distinctive crosstalk genes and immune cell infiltration, which were performed using the CIBERSORT and ImmuCell AI methodologies. Significant crosstalk genes were investigated based on the psoriasis area and severity score reactions, as well as biological therapies. We identified five signature genes using two machine-learning techniques, among which NLRX1 was confirmed. Both psoriasis lesions and non-lesions have NLRX1 expression, which is associated with the invasion of many immune cells.
Sahin et al. 2022 [22] Using wound illustrations for people with monkeypox and other skin conditions, this objective has been pursued using a deep transfer learning technique and freely accessible data. Tensors were utilized to replicate and build the best system. It could be made suited for Smartphones and tablets. It was updated to add a Lite TensorFlow model for monkeypox detection. This finished the runtime that was gathered during the inference timings on three different devices.
The remaining section is as follows. Part 2 explains the Related Work; Section 3 explains the proposed part; Part 4 shows the Results and Discussions; and Part 5 gives the Conclusion.
3. Proposed System
To overcome the limitations of the current approaches, a method called the multi-level fuzzy aware denoising technique with a gradient-enhanced convolution network and a level classifier is proposed for detecting and classifying psoriasis disease. Initially, pre-processing is done by using techniques like 3-level de-noising, Image enhancement (CLAHE using Game-based optimization algorithm), Image Augmentation and Geometric transformations, and Greyscale conversion. The next step is feature extortion, in which the required features are extracted using GBO. The final step is the classification by which the result will be obtained like whether the given input is normal or abnormal using the approach called Gradient Feature Boosted Region Convolutional Neural Network (GFB-RCNN) with a Self-attention based dual Multi-Layer Perception (MLP) (SA-DMLP). Fig 1 shows the Block illustration of the recommended approach.
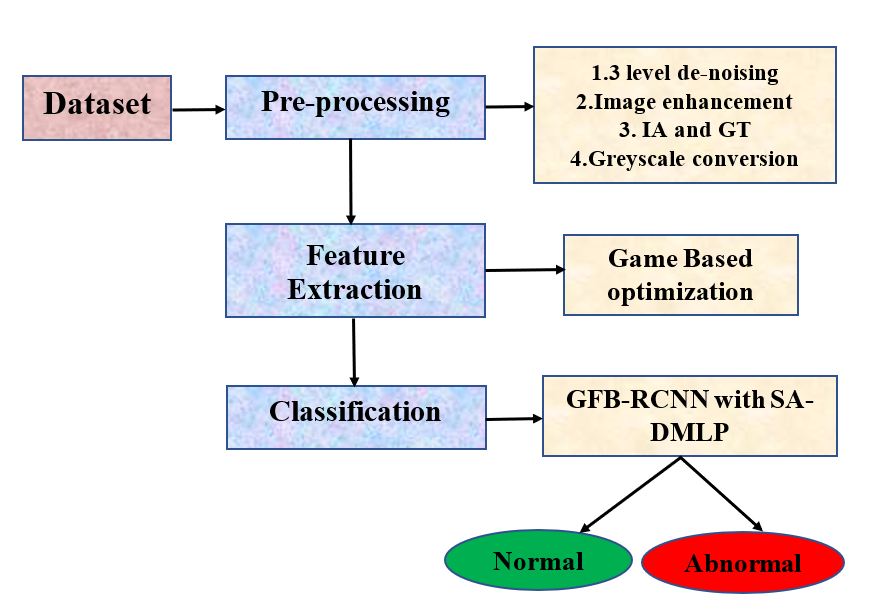
Figure 1: Block illustration of the recommended approach
3.1. Dataset Description
Pictures of 23 different skin disorders are included in the first dataset. There are around 19,500 photographs in total, and the second dataset contains data on 20 types of skin diseases.
3.2. Pre-processing
Pre-processing is the first process. A crucial step in converting the raw dataset into the best format is data pre-processing. An effective preprocessing stage primarily produces better segmentation outcomes, which result in improving classification accuracy. There may be some redundant data and noisy signals in the dataset. Consider a dataset as being. We used a few pre-processing approaches in our suggested system, which are thoroughly detailed below.
3.2.1. 3-level Image Denoising
Digital medical image quality has become a crucial problem. Medical images must be precise, noise-free, and clear in order to make the best diagnosis. Applications involving medical imaging can effectively remove noise. These are some of the methods employed in this process:
3.2.1.1. Adaptive weighted Fuzzy Guided filter (AWFGu-F)
The guided image filter outperforms the bilateral filter by preserving preferred edges regardless of the filter radius and the range of grey values through a linear transform of the guiding image. A general linear translation variation filter is the guided filter. The output picture is believed to be a linear transform (LT) of the input images used for filtering and for guidance. The filtering output at a pixel I is given as,
Where 🡪filtering output image, 🡪 filtering input image, G🡪Guidance image independent of filtering input image, 🡪normalized weights
The LT of G in a window centered at pixel i. It is represented as,
Where🡪 constants in the window, 🡪 linear coefficients, 🡪 window centred at a pixel i
The cost function is given as,
Where 🡪 the number of pixels in the window, 🡪regularization parameter penalizing a
large ai
From (3),
Where 🡪 the Mean and variance of G in the window, 🡪 the Mean of in
By (4), the coefficients of the entire image can be computed, and it is given as,
Where🡪 average coefficients of all windows
The foundation of the fuzzy filtering technique is the membership function-based grey-level projection into a fuzzy plane. By providing more weight to grey levels that are nearer to the image’s mean grey level than to those that are away from the mean, the goal is to create an image that is more contrasted than the original image. An image f of size MxN and L grey levels can be thought of as an array, with each element having a membership value that indicates how bright it is in relation to other contrast levels. For an image, it is given as,
Where 🡪 Intensity of value, 🡪membership value
A fuzzy membership value is assigned for the intensity levels (IL) using the membership function as follows:
Where 🡪 the minimum intensity level is 🡪 the maximum intensity level, The IL with the greatest membership value will be substituted in the window’s centre position.
3.2.1.2. Adaptive weighted Fuzzy Gaussian filter (AWFGa-F)
It is a low-pass filter used to blur certain areas of an image and reduce noise. A weighted average of the nearby pixels is used to replace the corrupt pixels thanks to Gaussian filtering. The weights for a neighbourhood pixel set are decided by,
Where, 🡪 Mean, 🡪 Standard deviation
3.2.1.3. Adaptive weighted Fuzzy Mean filter (AWFMF)
Simply replacing each pixel’s range in a picture with the mean of its neighbours within the filter mask, including itself, is the fundamental notion behind mean filtering. The standard mean filter, which replaces each pixel’s intensity value with the average of the intensities in its neighbourhood, is extended by this filter. Adaptive weighted fuzzy-MF, on the other hand, uses fuzzy logic to assign various weights to pixels in the neighbourhood according to how similar they are to the centre pixel. AWFMF is given as,
🡪denoised intensity range of the central pixel at coordinates (x, y),🡪🡪weight (membership value) assigned to the neighbouring pixel at position (a, b) based on its similarity to the central pixel. These weights are determined using a fuzzy membership function.
The mean value of all three filters is taken for generating a highly efficient denoised image based on considering Salt and Pepper Noise (SP noise), Poisson Noise, and Gaussian Noise.
The presence of bright and dark pixels in the poor-quality image results in noise, also known as SP noise. Typically, this noise will contain bright pixels in the image’s dim regions and dim pixels in its bright areas. This noise causes black and white dots to show up in the image.
Poisson Noise, a type of uncertainty associated with the strength of light, is an electrical noise. This happens in an image when the few energy-carrying particles, like electrons, are sufficiently small to cause observable changes.
A statistical noise with a Gaussian (normal) distribution is known as Gaussian noise. It denotes a typical Gaussian distribution of the noise levels. It appears in a picture as a result of things like electronic circuits and sensor noise brought on by insufficient lighting or a high ambient temperature.
3.2.2 Image Enhancement
This technique has been applied to improve the aesthetic appeal. In our model, a method called Contrast Limited Adaptive Histogram Equalization (CLAHE) is used. Applying this improves contrast. Essentially, CLAHE limits the contrast enhancement that conventional HE usually provides. As a result, the histogram’s slope and height are limited by the same algorithms that control contrast enhancement. The user can, therefore, define a clip limit (cl) to restrict contrast as necessary. Each tile’s histogram is computed independently. Before constructing the histogram, we must first compute the average pixels.
Where 🡪Average number of pixels, 🡪Total pixels in X,🡪Total pixels in Y, 🡪 total grey levels
To clip the histogram, cl must be calculated. It is given as,
🡪clip limit and NNCL🡪 Normalized cl ranges 0 and 1. Afterwards, for each tile, the clip limit is applied to the height of the histogram (Hi).
Ni 🡪 histogram of the ith tile and L🡪 total grey levels.
The total clipped pixels can be computed using the following formula,
🡪 Number of clipped pixels
To find out the total pixels to be redistributed, the following formula is used,
The clipped histogram is normalized using,
Until all the pixels are redistributed, the above step is repeated. The cumulative histogram is given as,
3.2.2.1. Game Based optimization (GBO)
GBO is obtained by combining Chaos Game Optimization (CGO) and Soccer Game Optimization (SGO). Finding the optimum inputs to maximize or minimize outputs at a reasonable computing cost is a technique known as optimization.
The CGO [23] algorithm’s core idea is based on the chaos game theory, and the algorithm’s general formulation is also based on the game theory. It is a heuristic algorithm that is based on the movement of points in a search space and was influenced by chaos theory and fractals. Based on the position of each seed, four are obtained for iteration. Three search space vertices are used to create the fresh seeds: and stands for the location of the suitable seed, for the mean of a sample, and for the location of the best seed. These three vertices together make up the temporary triangle and are represented as red, blue, and green. The exploration and exploitation rates of the CGO algorithm can be altered in four different ways by varying the seeds’ movement restrictions. The four different formulations are as follows:
Where 🡪 random value in the interval of [0,1]
and 🡪 integers of above range
R1 R2 Ri Rn
…. …..
G1 X1 G2 X2 Gi Xi Gn Xn
Where 🡪uniformly distributed random integer in the range [1, d]
d🡪 number of design variables
🡪 uniformly distributed random number [0,1]
and 🡪 two random integers of 1 or 2. The probability of rolling the dice is modelled using and.
Produces four unique random vectors. The optimization process is terminated after a predetermined number of iterations, and this is the terminating criterion that is taken into account. The method is carried out for each seed and during every repetition. until a termination condition is met. The CGOA includes random point selection, random mobility, and the assessment of fitness metrics. These arbitrary processes aid in searching the universe while avoiding local maxima. Finally, CGO will provide us with an updated solution. SGO is used to provide the optimum solution based on the updated solution from CGO.
By streamlining the setting and regulations, SGO is a revolutionary technique that optimizes players’ fundamental movement patterns. This model has two phases. They are moved off and move forward [24].
Phase 1: Move off:
Consider an element of a player. given as,
Where🡪the upper and lower bounds of 🡪 the function return within the range [0, a], and () will be closer to 0 as t increases.
Where T🡪 maximal iteration, 🡪non-uniformity parameter.
Phase 2: move forward
Assuming the player’s present place, the player’s best place and the ball position. Each active player is replaced by a substitute player by a probability (if the substitute player is better than the active player.
By using an optimization algorithm, we can combine the CGO and SGO. Adjust the parameters of both SGO and CGO to ensure they work well together. This may involve fine-tuning the chaos game parameters, such as the transformation rules or probability distributions, to complement the behaviour of SGO. We have to calculate the fitness function. Record the person’s greatest state and fitness value, and then evaluate it to the current target value; if the value is higher, the new optimal solution will be the target’s subsequent iteration; if not, the present target will remain unaltered.
3.2.3. Image augmentation (IA) and Geometric transformations:
It is a potent method that can be used to fictitiously expand a training dataset. When there is a lack of data to train a model, this can be useful. Additionally, IA can be utilized to increase a model’s resistance to changes in the input data. Transformed photos are added to the dataset to assist the model in learning invariant features and variations in the data, improving its ability to handle real-world circumstances. It is employed to change picture appearance while keeping its original content. Rotate, flip, scale, colour modifications, and other techniques for IA are some examples. Geometric transformation is one of the techniques used in IA.
While photographs were taken, distortions in geometry occurred that could be removed using geometric transformations. Geometric alteration could be required if two photographs of the same object are to be matched. The vector function V of a geometric transform maps a pixel (f, g) to a new position (f’, g’), for example, rotation, scaling, flip, crop and so on, and it is based on previously identified source and modified photos.
3.2.3.1. Scaling
By resizing a picture horizontally (x) and vertically (y), scaling changes the appearance of the image. This is the scaling matrix.
3.2.3.2. Rotation:
Rotation transforms an image by changing its orientation. The rotation matrix for a counterclockwise rotation by an angle θ.
3.2.4. Greyscale (GS) Conversion
The location of the pixel inside the image has no bearing on the grey scale change. A transformation T of the original brightness x from scale to y scale is represented.
3. 3. Feature Extraction (FE)
FE process is the second phase of the model. The data from the previous phase is used to do the FE. In order to obtain features that will be helpful in classifying and identifying photos, feature extraction techniques are used. In the field of image processing, features are crucial. Feature extraction is the process of turning a set of features from the preprocessed data.
3.3.1. Mean, Median and Standard deviation
By adding together each pixel’s value inside the image and dividing it by its overall pixel count, the mean is determined. It represents the image’s core tendency for intensity values. The mean is frequently employed as a fundamental attribute to describe an image’s overall brightness.
🡪 Intensity values of the pixel, N🡪 total pixels
From the collection of pixel ranges, the median is the middle value. It stands for the image’s intermediate intensity value, which divides the higher and lower values. It is frequently used to characterize the intensity distribution’s centre value since it is resistant to outliers. It can be applied to improve an image’s contrast and reduce noise. Considering the M set of values, sort the values.
The spread or dispersion of the pixel range is measured by the standard deviation. It measures the deviation of the pixel ranges from the mean. The contrast and texture of the image are evaluated using the standard deviation. Low values imply a more uniform region, whereas high values show a wide range of pixel intensities, frequently connected with texture or edges.
3.3.2. Adaptive Weighted Kurtosis (AWK)
An adaptive weighted kurtosis is a statistical technique used in signal processing to access any non-Gaussianity. It modifies the estimated Evaluation of a physical parameter using a Gaussian. The probability distribution curve of a random variable with a real value is measured by kurtosis. Data outliers are counted, and their numbers are quantified. In AWK, a weight is assigned to each data point.
3.3.3. Adaptive Weighted Skewness (AWS)
It describes a statistical measurement of the asymmetry or lack of symmetry in a dataset where the weights given to each data point are not fixed but instead change depending on certain conditions. Skewness measures how far and in which a distribution of data values is asymmetrical or out of symmetry. When particular data points may have a greater impact on the overall distribution features, adaptive weighted skewness enables flexibility in skewness assessment.
3.3.4. Information Gain
It gauges how much knowledge a characteristic imparts to the desired variable. In terms of the number of features selected and accuracy, the information gain (IG) selection technique outperforms the procedures when applied separately. Information gain is a term borrowed from information theory and machine learning to describe the reduction in entropy or uncertainty that results from segmenting a dataset according to a specific attribute. To choose the most insightful features for categorization, it is frequently utilized in feature selection approaches. Information gain is a measure of how informative a feature is. IG is an entropy-based strategy for selecting data. The IG (y, B) is represented as:
v(B)🡪possible rate of attributes B, v🡪 Value, 🡪a subset of y (in which B possess the sum of c)
Where 🡪 the ratio of conditional attribute P in a dataset,
Similarly, we can calculate for also. Calculate for each feature.
We can specify a threshold to extract the correct characteristics. The number utilized as a reference for the chosen feature in IG is called the threshold, which is nothing more than the cutoff. The information value is decreased using the association’s mean, and the results are then added to determine the data group diversity. The difference between the observed data and the average value is described using this method, which is called standard deviation.
Where 🡪 Standard deviation, x🡪 Average value of, n🡪 total number of features in a taken dataset, 🡪 Mean
The threshold is the result of calculating the standard deviation for all characteristics. All features with range threshold values ought to be chosen. Those with values below the threshold ought to be eliminated. The GBO method allows us to extract the features.
Algorithm1: Feature Extraction using GBO
| Create random variables for the initial positions of eligible points Evaluate fitness values (Fv) for each eligible point = So far, I found the best eligible point While (t<max iterations) Create Create temporary triangles with Calculate and Calculate the values If (new values exceed condition) Control the position End if Determine Fv for new values If (new values have better Fv than worst initial eligible points) Substitute the worst initial eligible points with new values Update the best solution (Z) End if By Z, perform the process of SGO Consider, Calculate, Calculate fuzzy entropy using threshold Calculate IG, If (f threshold) Consider the features Else Discard the features End if |
Thus, by using this approach, the features can be extracted more effectively, which leads to improved model performance and also reduces overfitting.
3.4. Classification
It is the final stage of the process. This is done using the feature-extracted results. In our model, a Gradient Feature Boosted Region Convolutional Neural Network (GFB-RCNN) with a Self-attention-based dual Multi-Layer Perception (MLP) (SA-DMLP) is used.
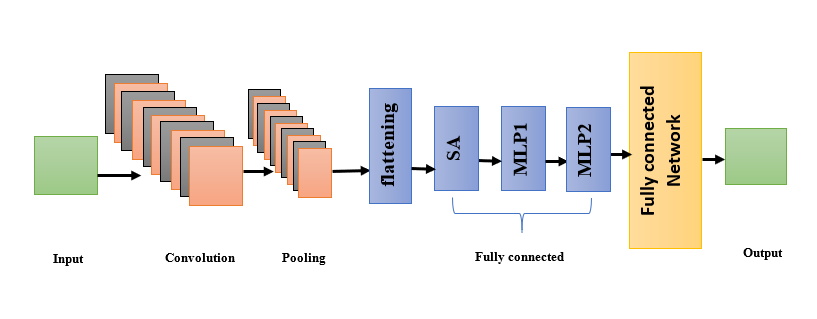 Figure 3: CNN structure with SA-DMLP
3.4.1. GFB-RCNNN with SA-DMLP
CNN is a well-liked DL classifier for predicting and identifying illnesses. The detailed explanation is given below,
For gradient boosting, we will use a random dataset with different features. The first step includes building a base model to predict the dataset.
3.4.1.1. Convolution layer (CL)
At each convolutional layer, the input (i/p) cube is convolved in a wide range of learnable filters to create a variety of feature maps. Assume, for instance, that the input cube X has the size mxnxd, where m, n stands for the spatial size of X, d for its channel count, and for the ith feature map of M. Assume k filters at this layer, and the jth filter is described using the weight w j and bias b j. The jth o/p of the CL is given as,
, j=1, 2, k (51)
f (·)🡪activation function.
3.4.1.2. Pooling layer:
They are occasionally added following multiple CLs because redundant information in images exists. The feature maps’ spatial size gradually shrinks as a result of the pooling procedure, and the network’s computation and parameter count likewise drop. The typical pooling method can be represented as, with a p × p window-size neighbour designated as S,
where F 🡪number of elements in S
🡪 activation value for the position (i, j).
3.4.1.3. Flattening
Before connecting to the MLP layer, the final o/p of the pooling layer must be flattened.
3.4.1.4. Fully connected layers
The features from the preceding stage are flattened after layer pooling and forwarded to the next stage. This layer is used to extract deeper and more abstract information.
Self-attention based Dual MLP (SA-DMLP)
It is a type of neural network architecture that blends SA and MLP components. Self-attention refers to a model’s capacity to evaluate the corresponding weights of various components in its input sequence when producing estimates. A feed-forward artificial neural network made up of numerous layers of interconnected artificial neurons is known as a multi-layer perceptron. It has an i/p layer and an o/p layer, and the hidden layers are the layers that lie in between i/p and o/p. The MLP learns by adjusting the weights of the connections between the neurons. This is done using a technique called backpropagation. It operates with the o/p layer and works its way back to the i/p layer, updating the W of each connection based on the error between the desired o/p and the actual o/p. MLP is given as:
🡪 Output, 🡪 weight matrix, has a real number that connects the neurons in the i/p layer to the hidden layer, 🡪input vector, 🡪bias, a real number added to each neuron in the hidden layer, 🡪 and an activation function. It is used to introduce non-linearity. It is used because it allows the MLP to learn the complex relationships between the input and the output layers. For binary classification, you may have one neuron with a sigmoid activation function, while for multi-class classification, you might have multiple neurons with SoftMax activation.
3.4.1.5. Output layer
This is the layer by which the network will end. This gives the final result.
4. Results And Discussions
Using the dataset taken, the results are evaluated using the performance metrics. The results are computed by comparing the suggested and existing methods CNN [25], CNN-RNN [26] and CNN-LSTM [27].
4.1. Dataset Description
Pictures of 23 different skin disorders are included in the first dataset. There are around 19,500 photographs in total, and the second dataset contains data on 20 types of skin diseases.
4.2. Evaluation metrics:
The evaluation of the suggested and the current techniques are done using the performance metrics explained in detail below.
4.2.1. Accuracy:
It is the proportion of true forecasts to all i/p Observations.
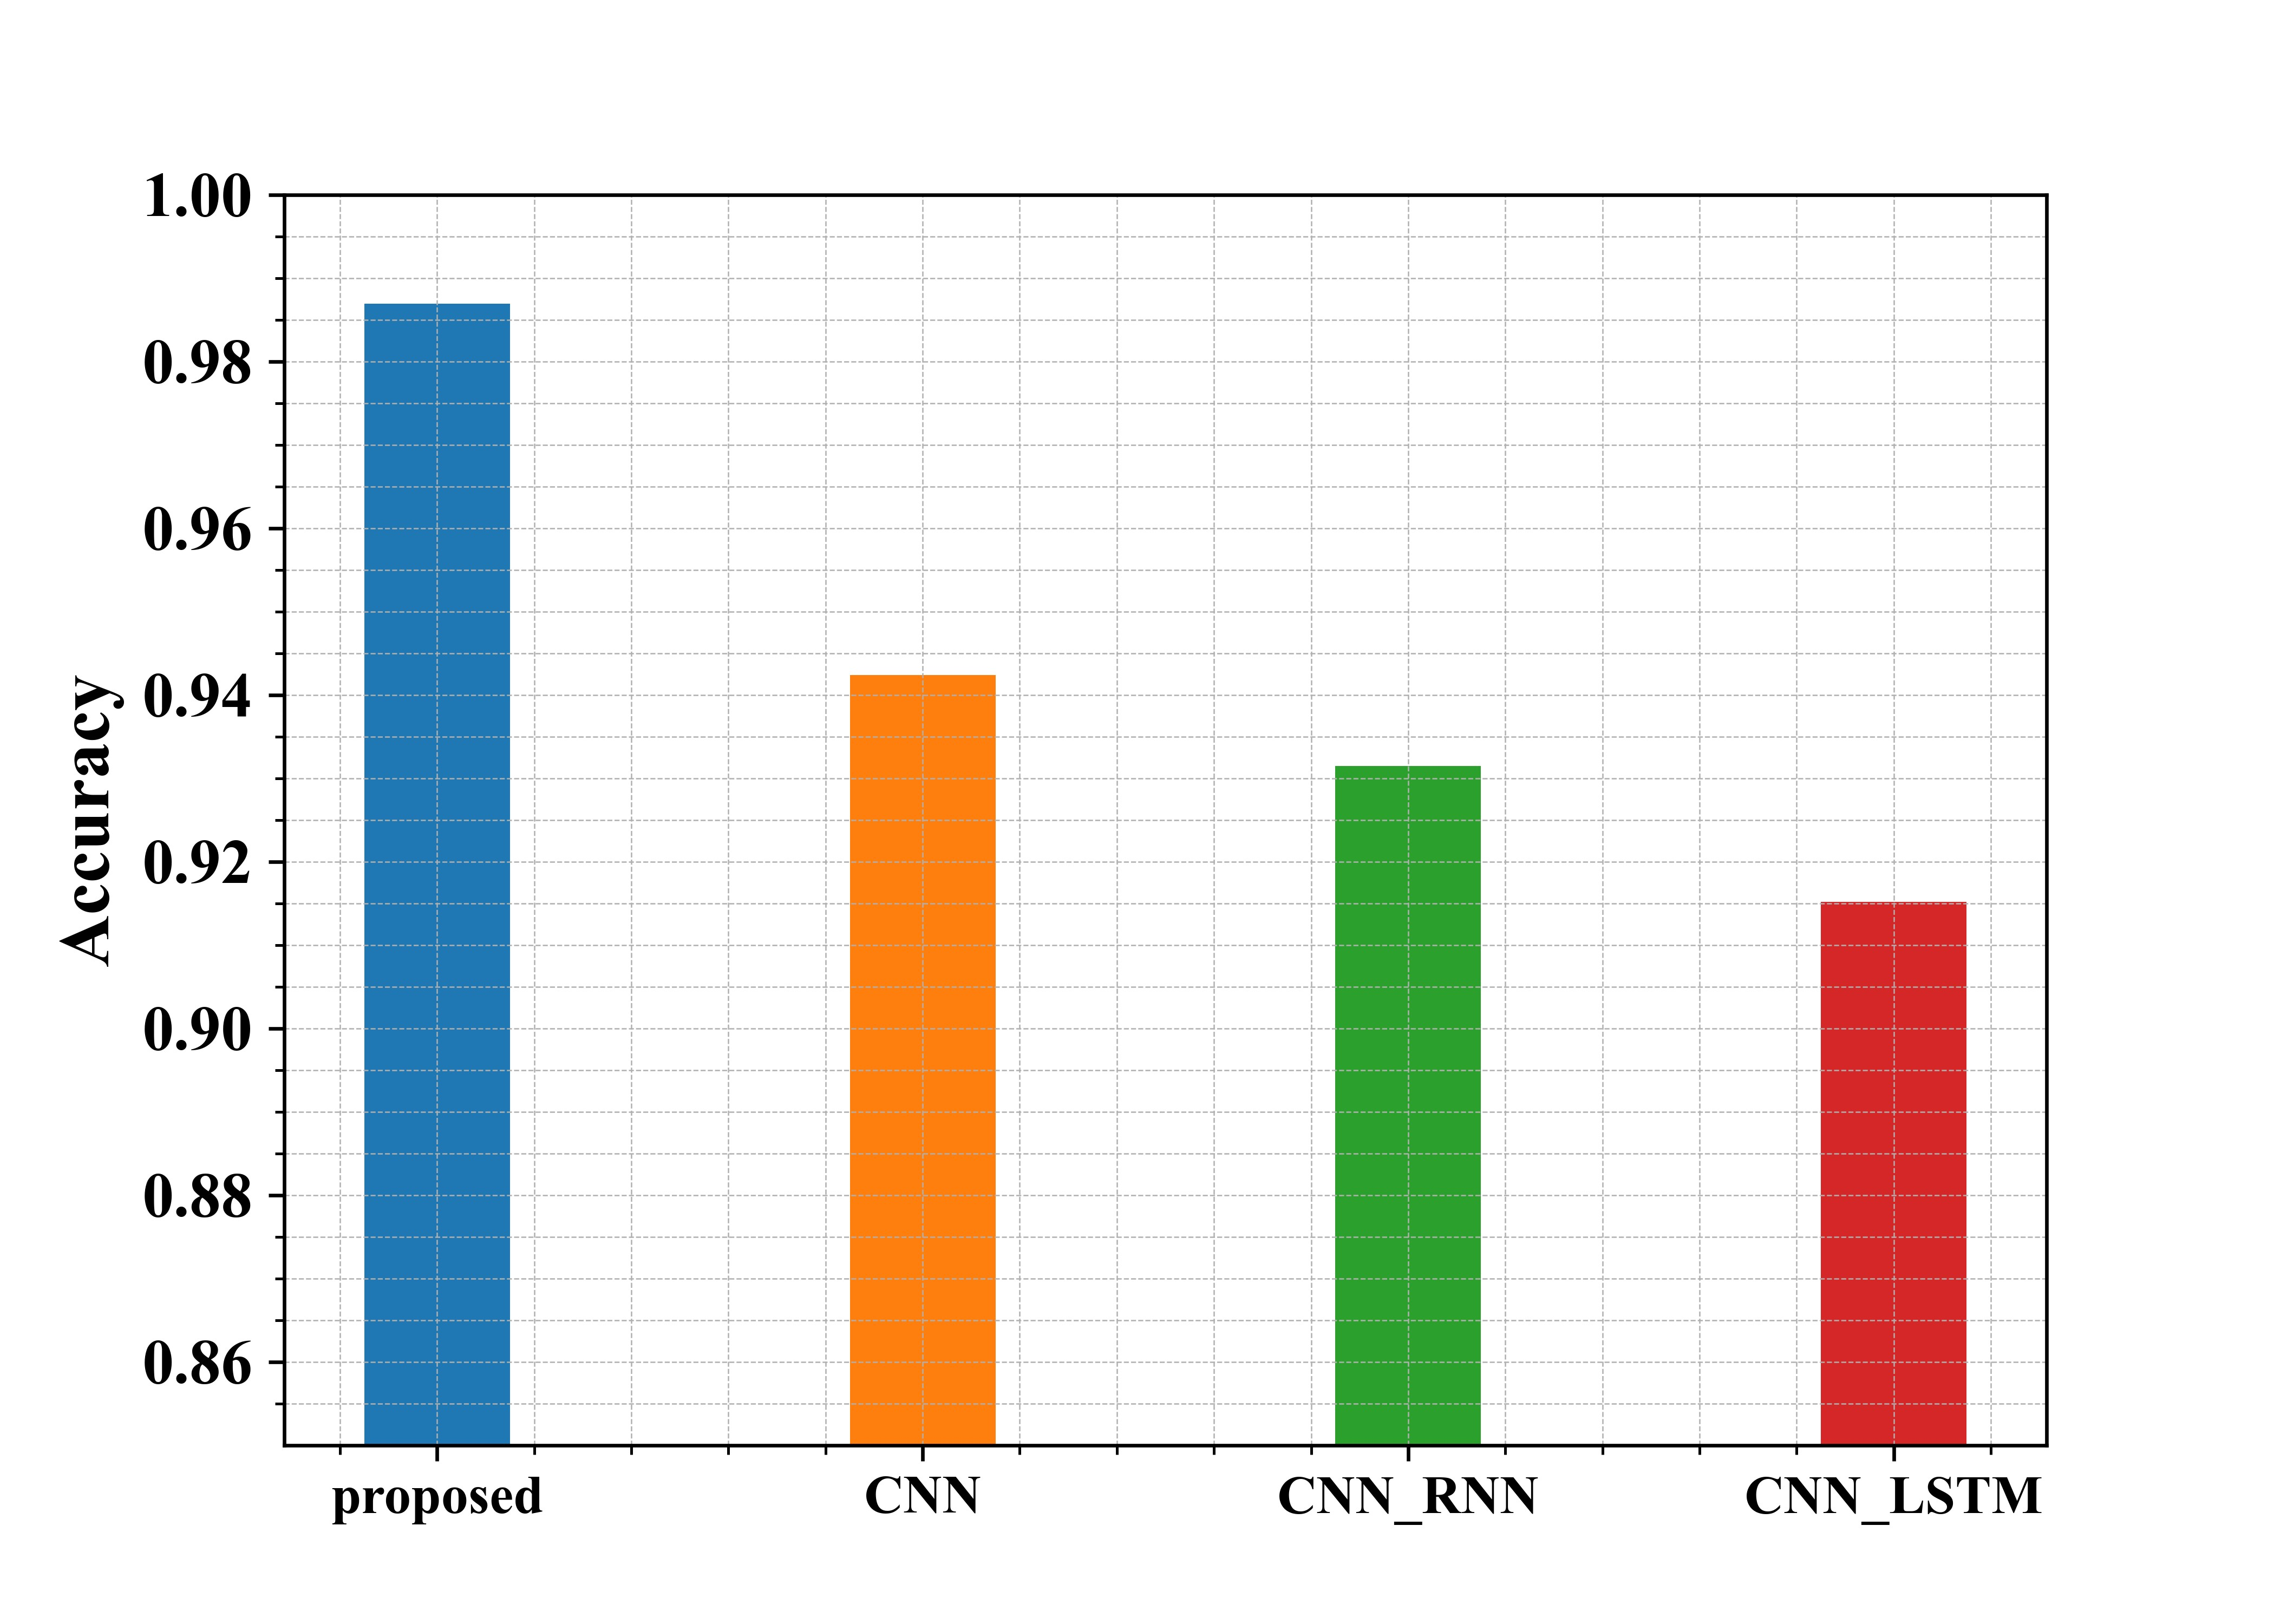
Fig 3: Examination of suggested and existing approaches in terms of Accuracy
Figure 3 shows the examination of the recommended methods in use in regard to Accuracy. From the graph, the proposed approach has an accuracy of about 98.7%, whereas the existing methods CNN, CNN-RNN and CNN-LSTM have an accuracy of 94.2%, 93%, and 91.5%, respectively. Thus, from the graphical representation, it is seen that the proposed approach is more Accurate.
4.2.2. Sensitivity
The fraction of real positives that are correctly identified is measured by sensitivity.
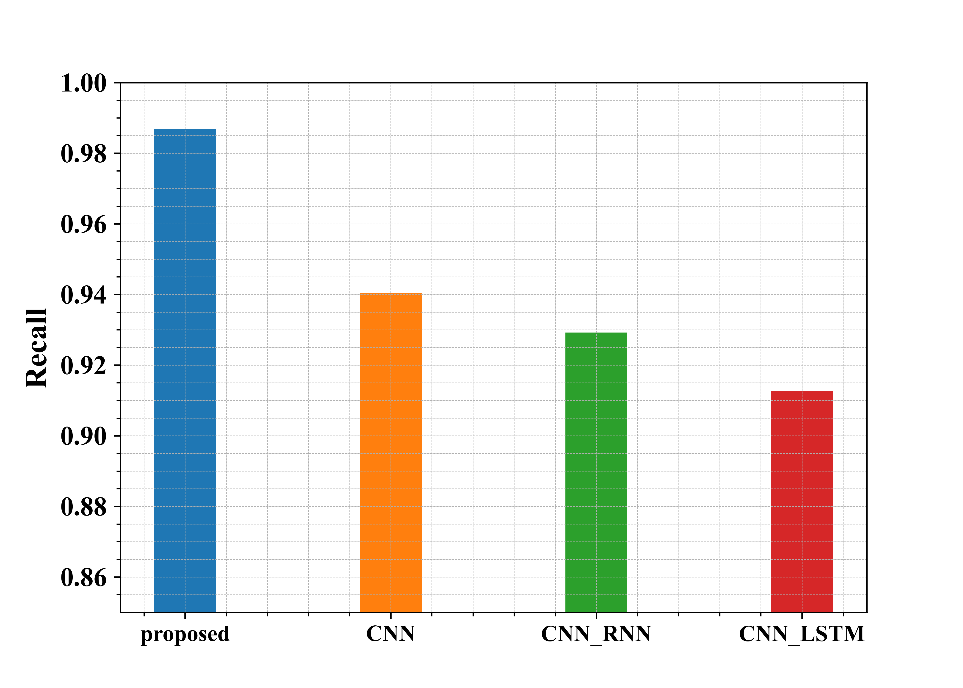
Fig 4: Examination of suggested and existing approaches in terms of Sensitivity
Figure 4 shows the examination of the recommended methods in use in regard to Sensitivity. From the graph, the proposed approach has a Sensitivity of about 98.6%, whereas the existing methods CNN, CNN-RNN and CNN-LSTM have a Sensitivity of 94%, 92.9%, and 91.2%, respectively. Thus, from the graphical representation, it is seen that the proposed approach has a higher Sensitivity.
4.2.3. Specificity
The percentage of real negatives that are accurately identified is measured by specificity.
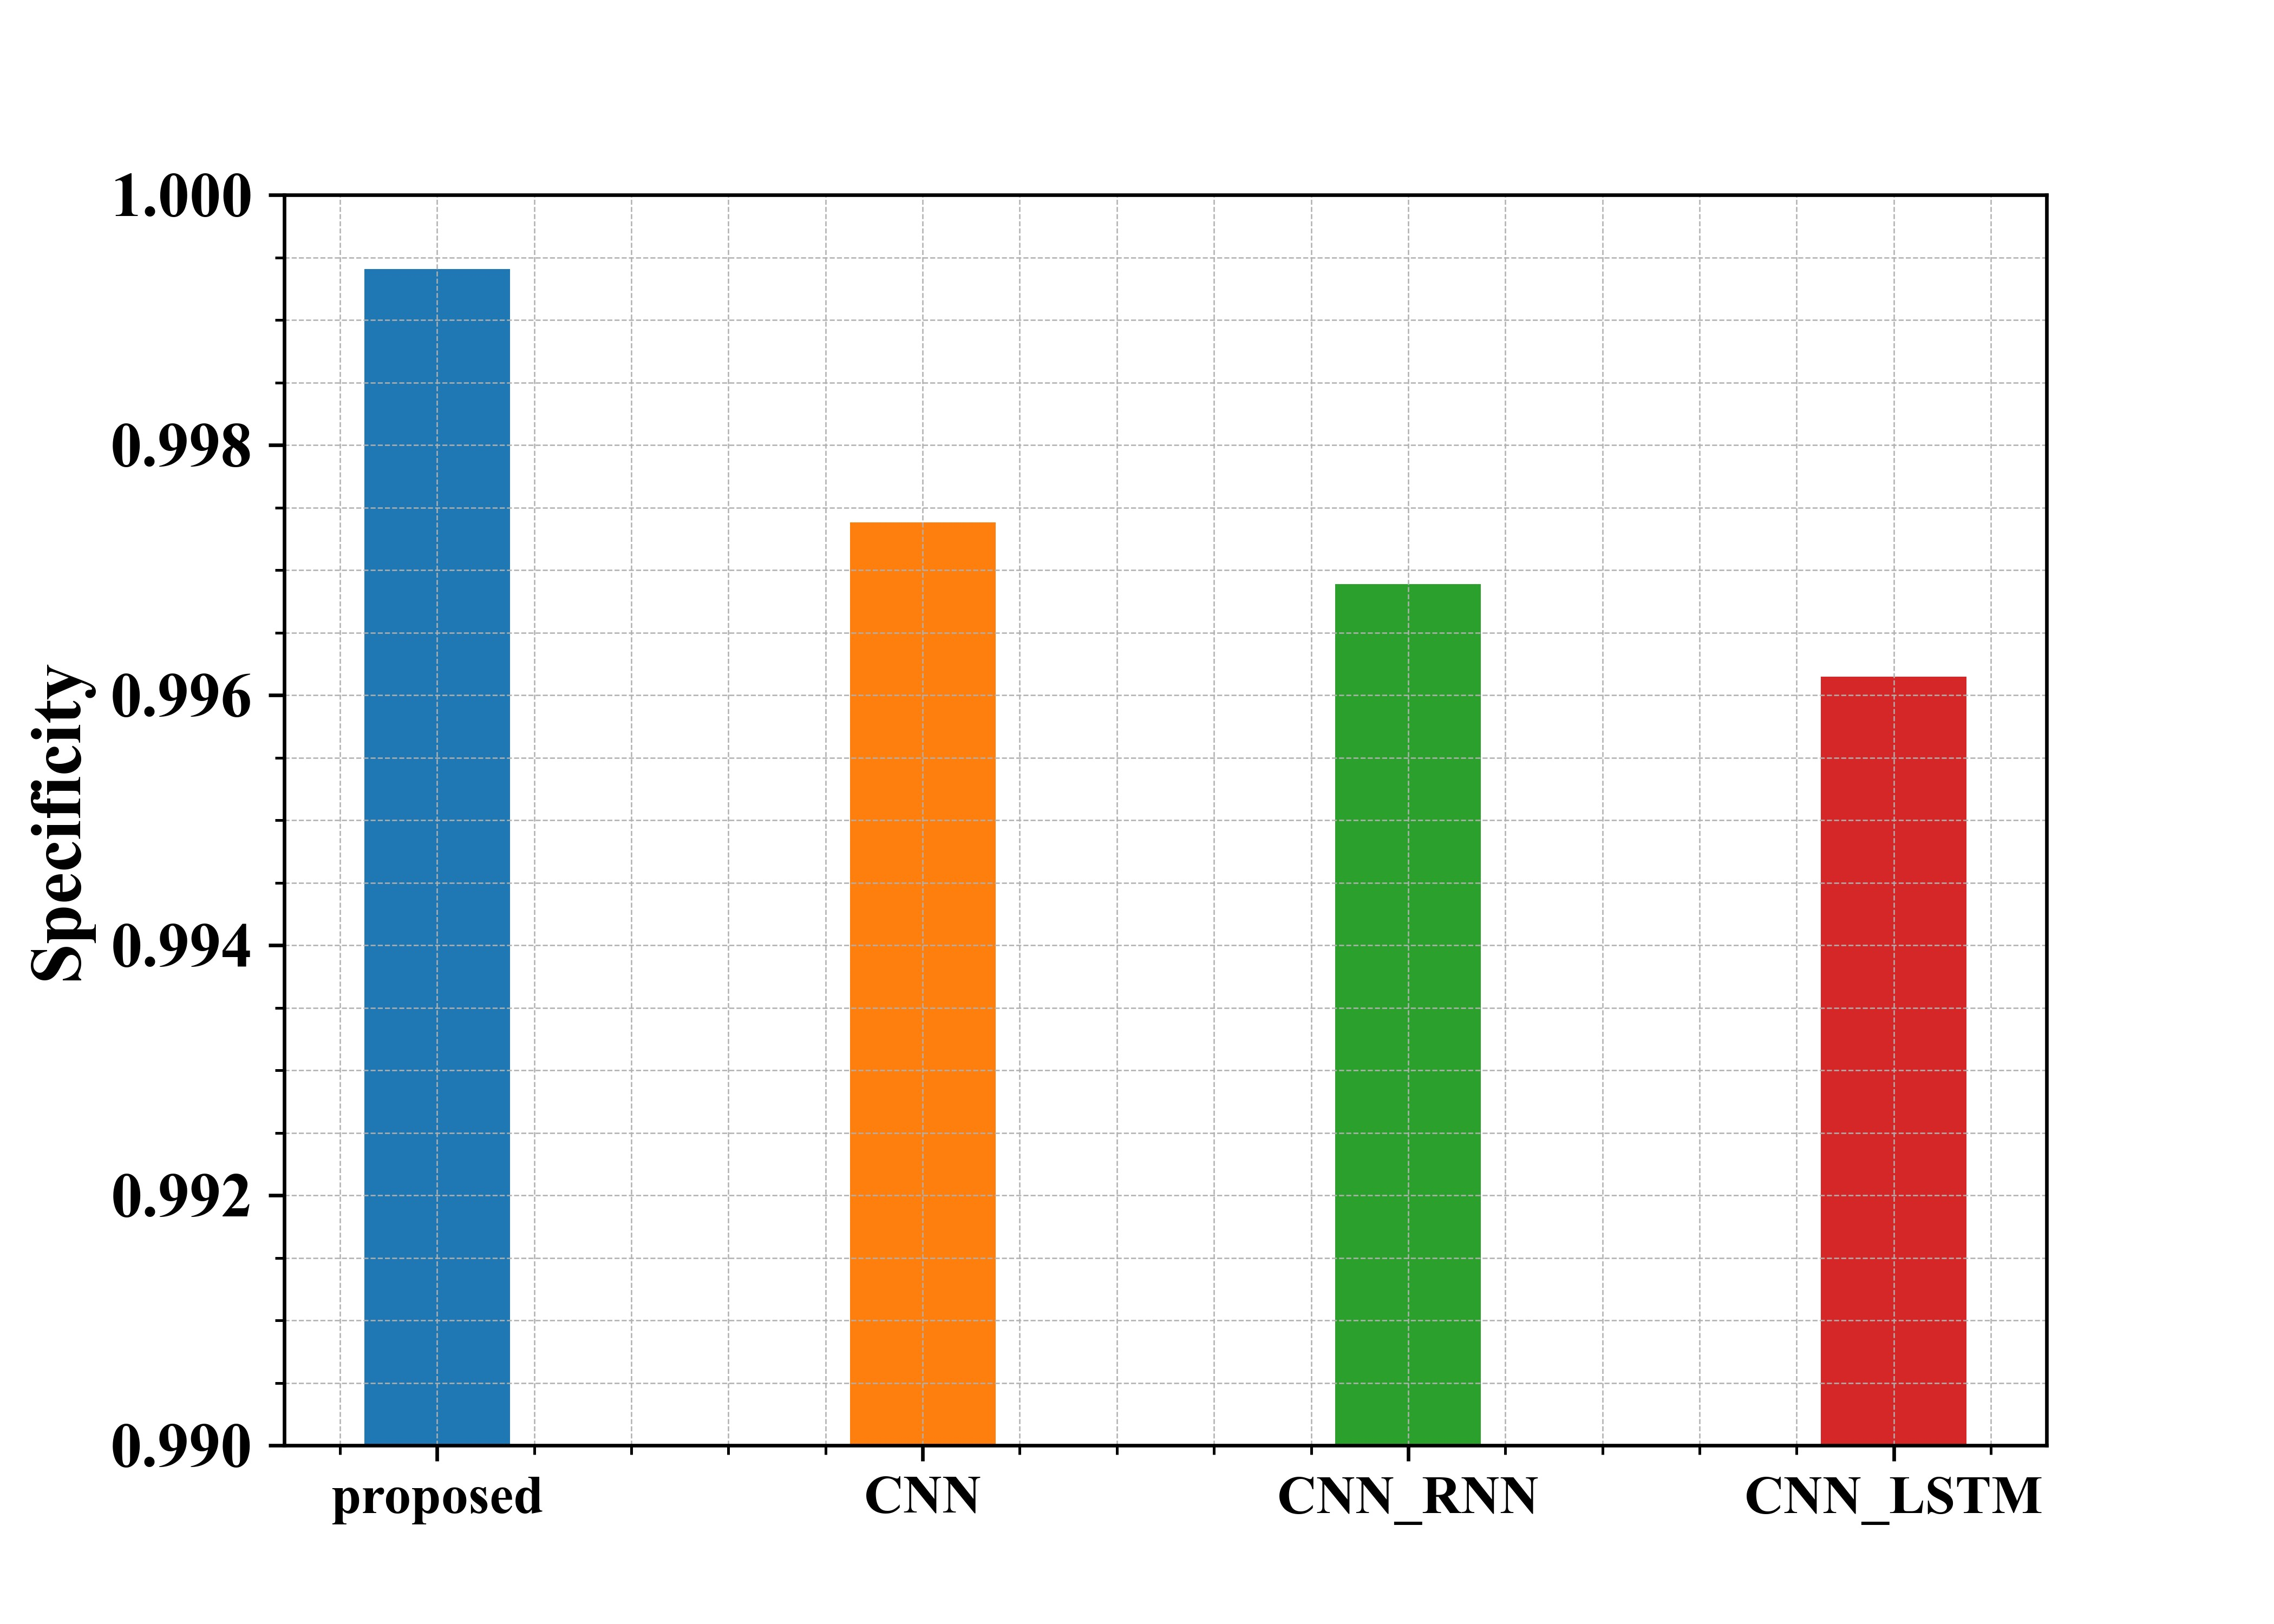
Fig 5: Examination of suggested and existing approaches in terms of Specificity
Figure 5 shows the examination of the recommended methods in use in regard to Specificity. From the graph, the proposed approach has a Specificity of about 99.9%, whereas the existing methods CNN, CNN-RNN and CNN-LSTM have a Specificity of 99.7%, 99.6%, and 99.6%, respectively. Thus, from the graphical representation, it is seen that the proposed approach has a higher Specificity.
4.2.4. Precision
How much of a model’s positive predictions are actually right is determined by its precision, which is a performance indicator. In order to assess how well what you detect is actually present, precision is important.
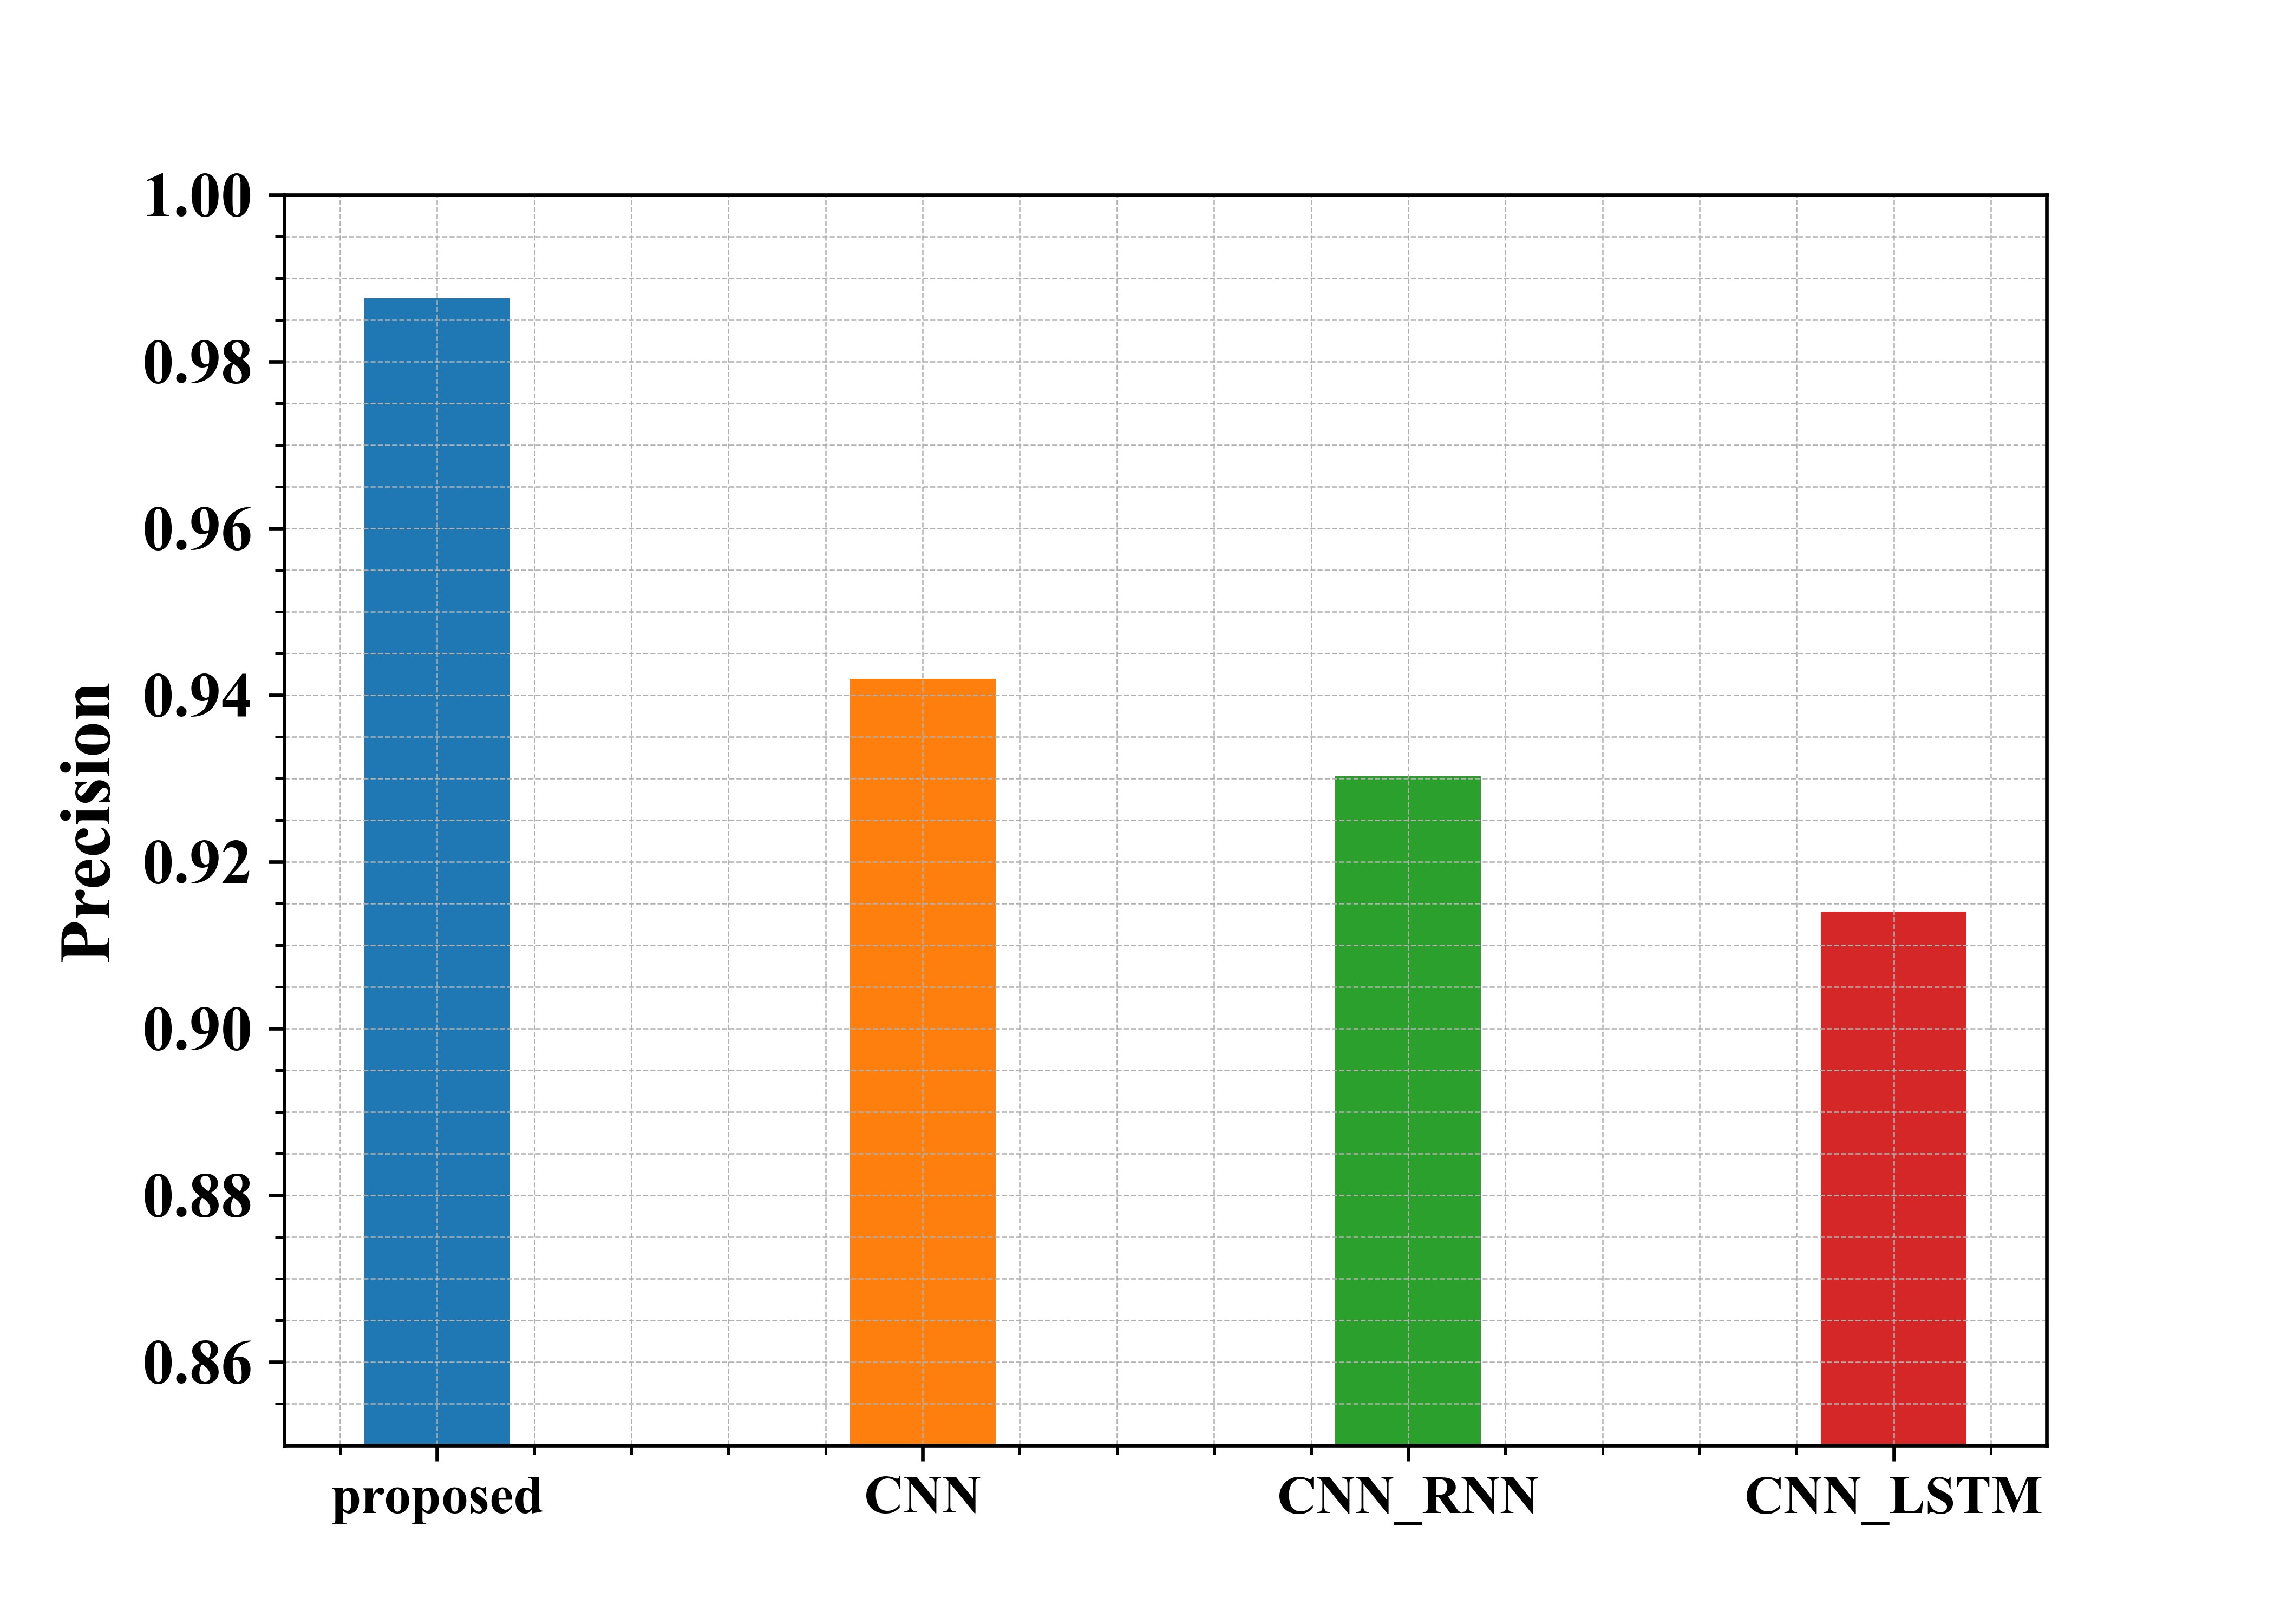
Fig 6: Examination of suggested and existing approaches in terms of Precision
Figure 6 shows the examination of the recommended methods in use in regard to Precision. From the graph, the proposed approach has a Precision of about 98.7%, whereas the existing methods CNN, CNN-RNN and CNN-LSTM have a Precision of 94.1%, 93%, and 91.4%, respectively. Thus, from the graphical representation, it is seen that the proposed approach has a higher Precision.
4.2.5. F measure
A general score for performance evaluation is a combination of statistics that combines Precision and recall.
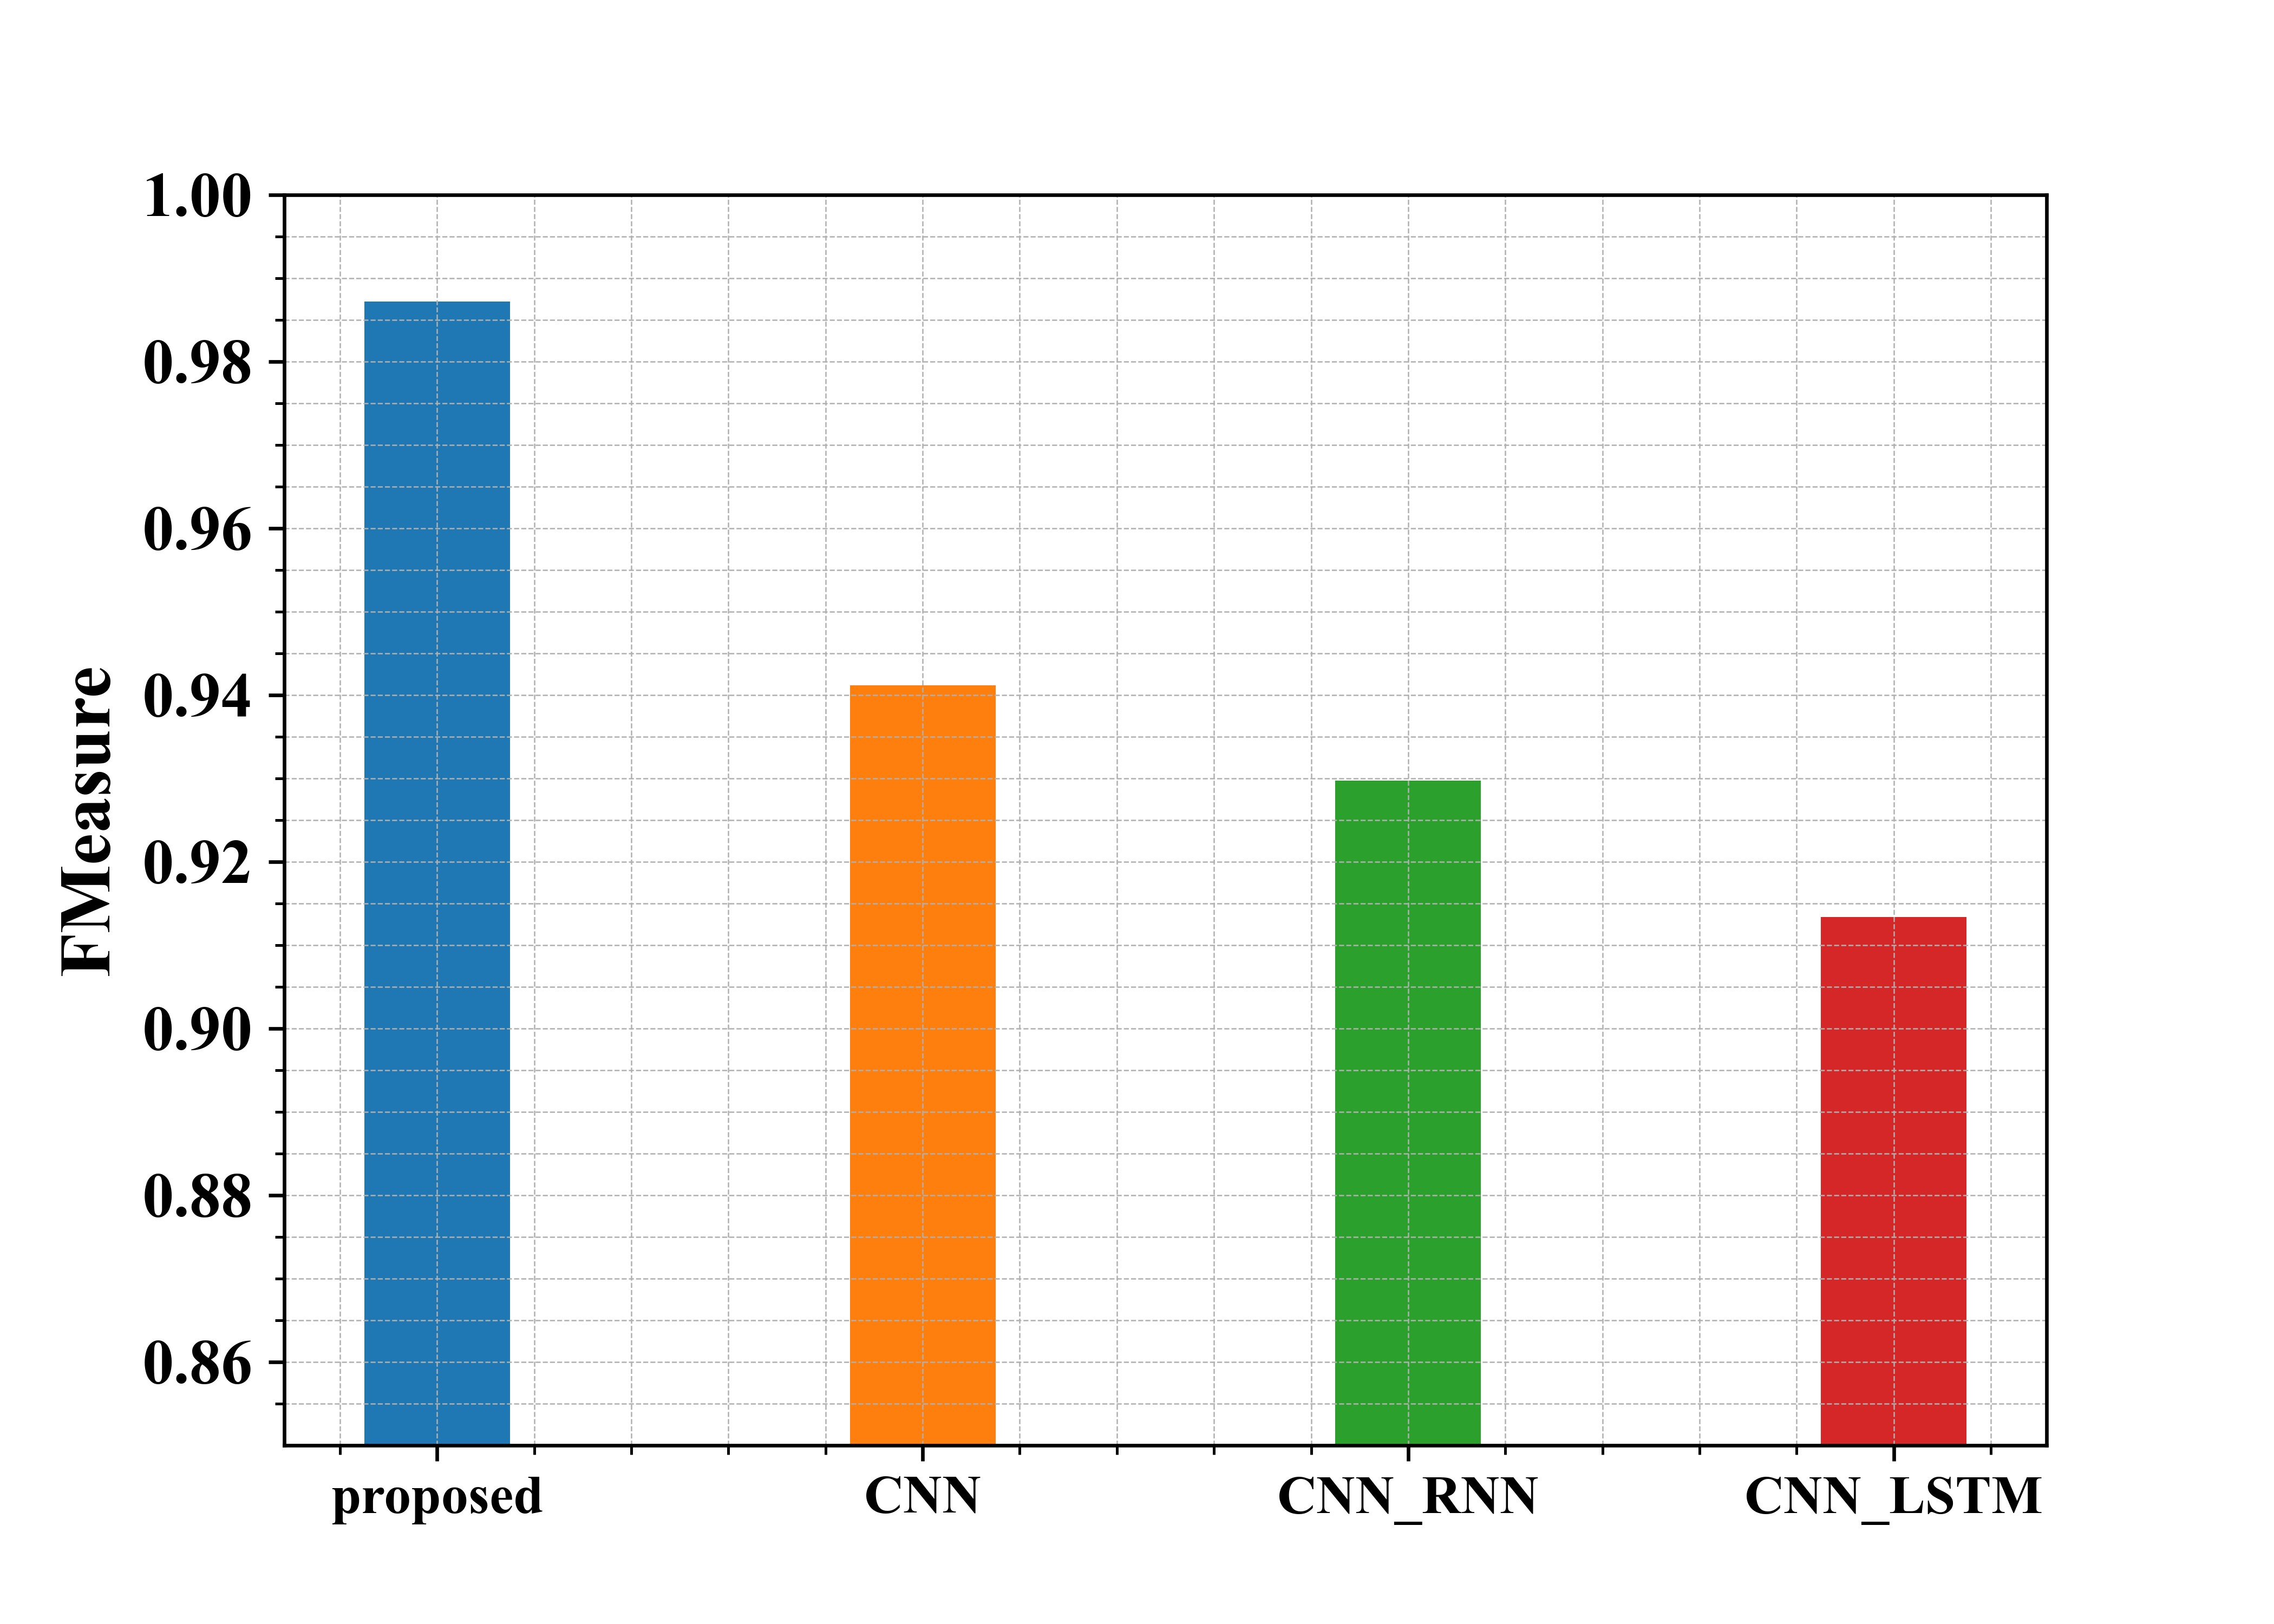
Fig 7: Examination of suggested and existing approaches in terms of F-measure
Figure 7 shows the examination of the recommended methods in use in regard to F-measure. From the graph, the proposed approach has an F-measure of about 98.7%, whereas the existing methods CNN, CNN-RNN and CNN-LSTM have an F-measure of 94%, 92.9%, and 91.3%, respectively. Thus, from the graphical representation, it is seen that the proposed approach has a higher F-measure.
4.2.6. FNR and FPR
FPR refers to the values that are actually negative but predicted to be positive.
FNR refers to the values that are actually positive but predicted to be negative.
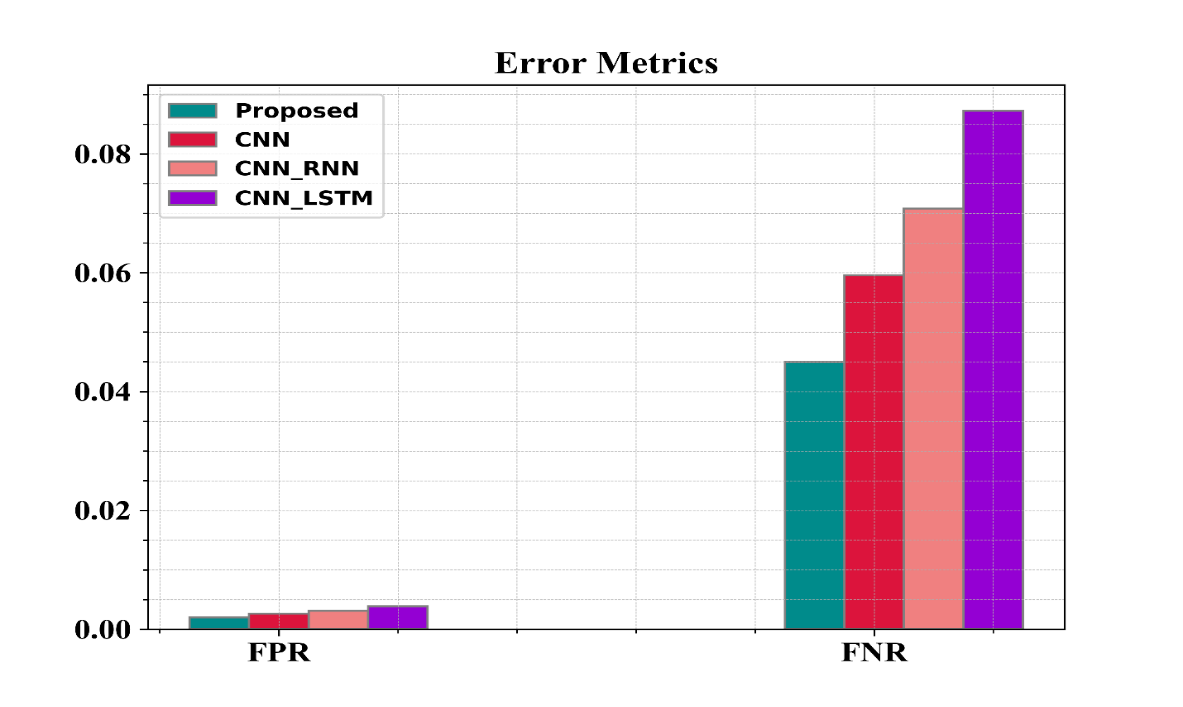
Fig 8: Examination of suggested and existing approaches in terms of FPR and FNR
Figure 8 shows the examination of the recommended methods in regard to FPR and FNR. From the graph, the proposed approach has a lower FPR of 0.002%and lower FNR of 0.045%, whereas the methods in use have higher values
4.2.7. Time complexity (TC)
The procedure that measures how long an algorithm takes to execute as an estimate of the size of the input is called TC.
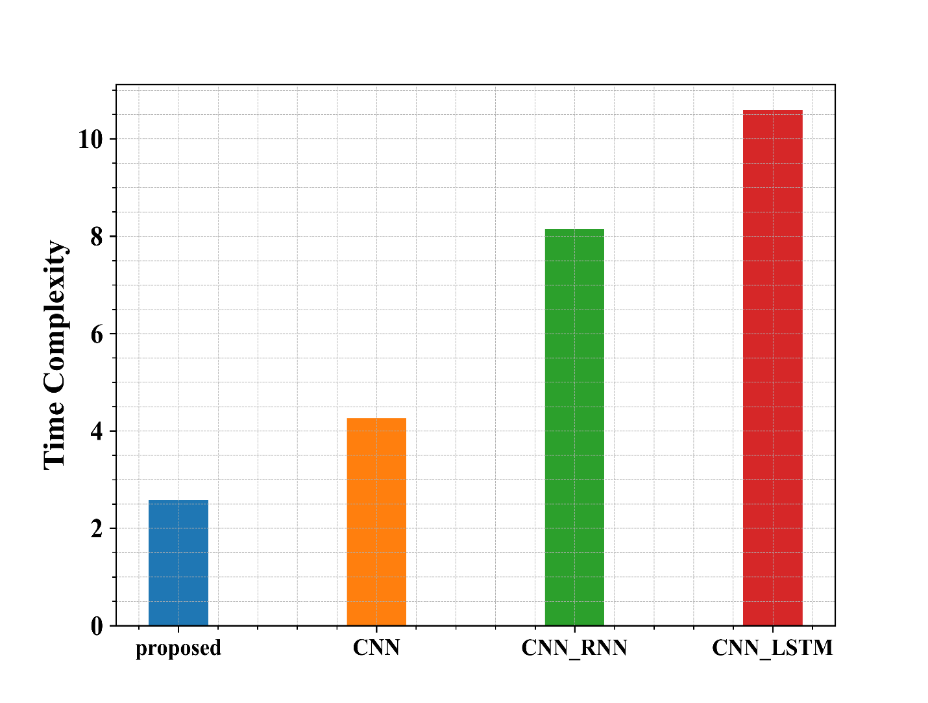
Fig 9: Examination of suggested and existing approaches in terms of Time complexity
Figure 9 shows the examination of the recommended methods in use in regard to Time complexity. From the graph, the proposed approach has a very low value compared to the other methods.
4.2.8. Mean Square Error
MSE stands for average error resulting from the overall pixels in an image. This shows that there has been a significant noise decrease.
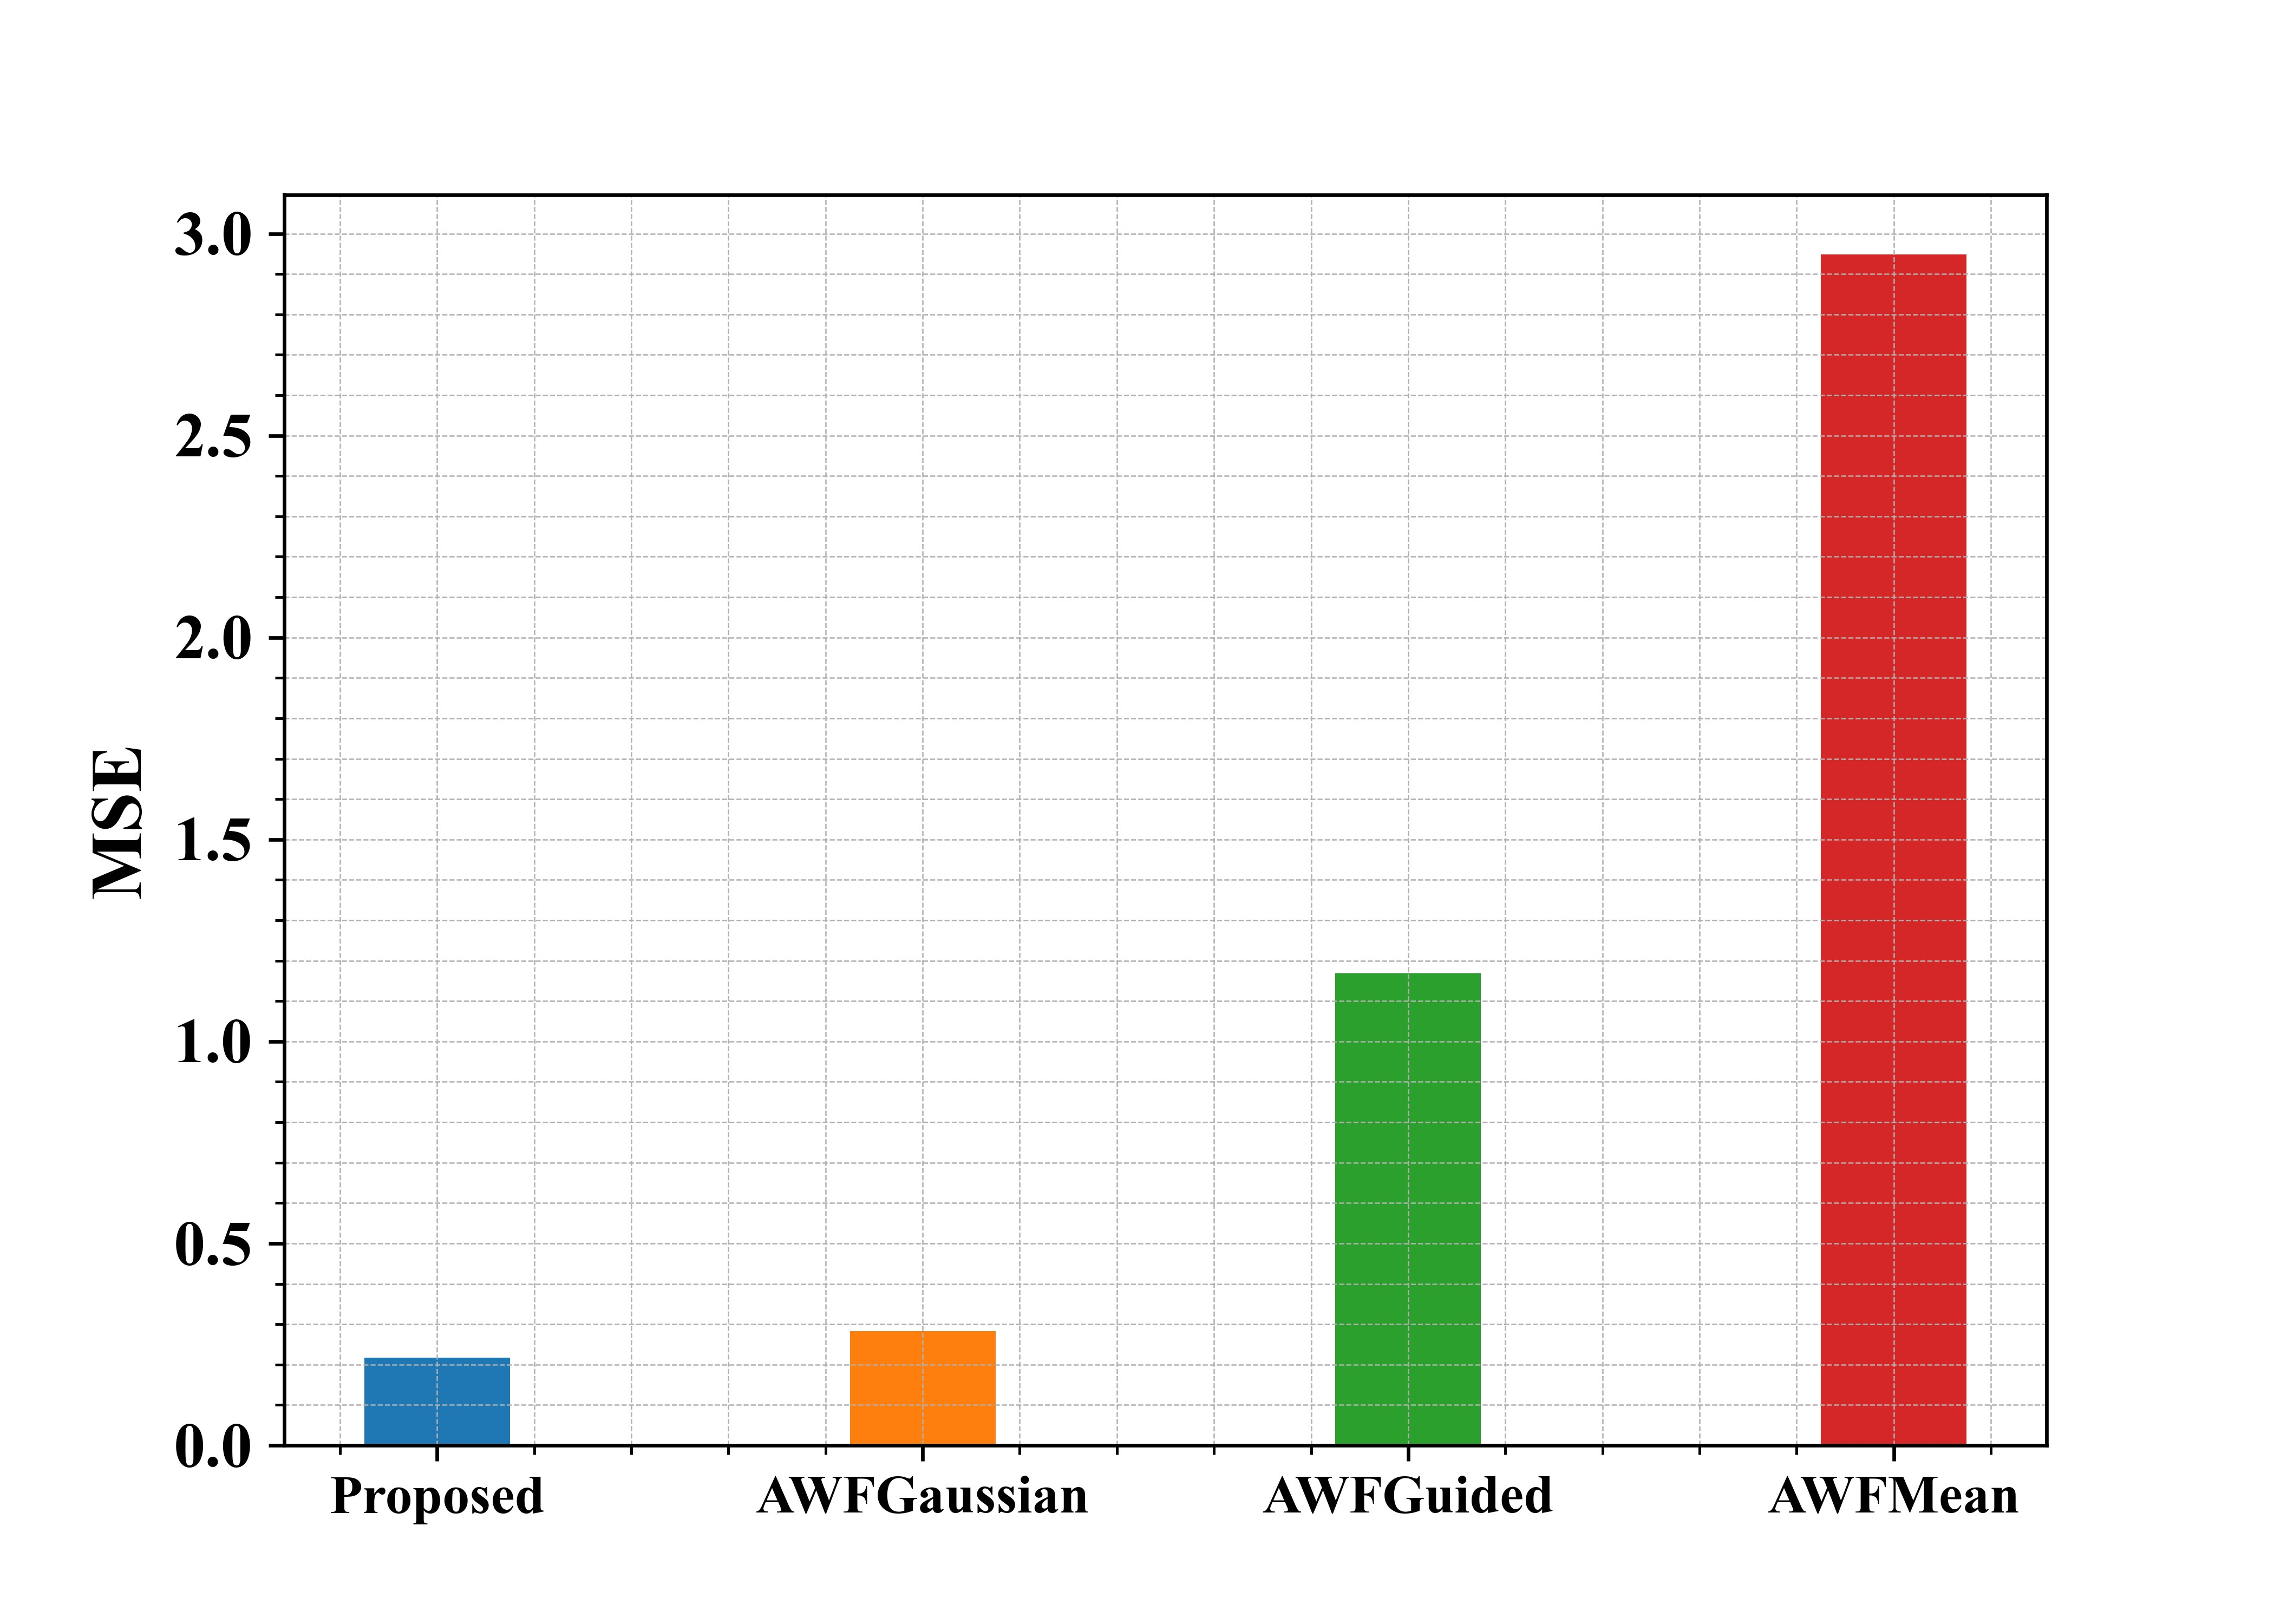
Fig 10: Examination of suggested and existing approaches in terms of MSE
Figure 10 shows the examination of the recommended methods in use in regard to MSE. From the graph, the proposed approach has a lower value compared to the other methods.
4.2.9. Root MSE
RMSE is the most popular evaluation metric used in regression problems. It follows an assumption that errors are unbiased and follow a normal distribution.
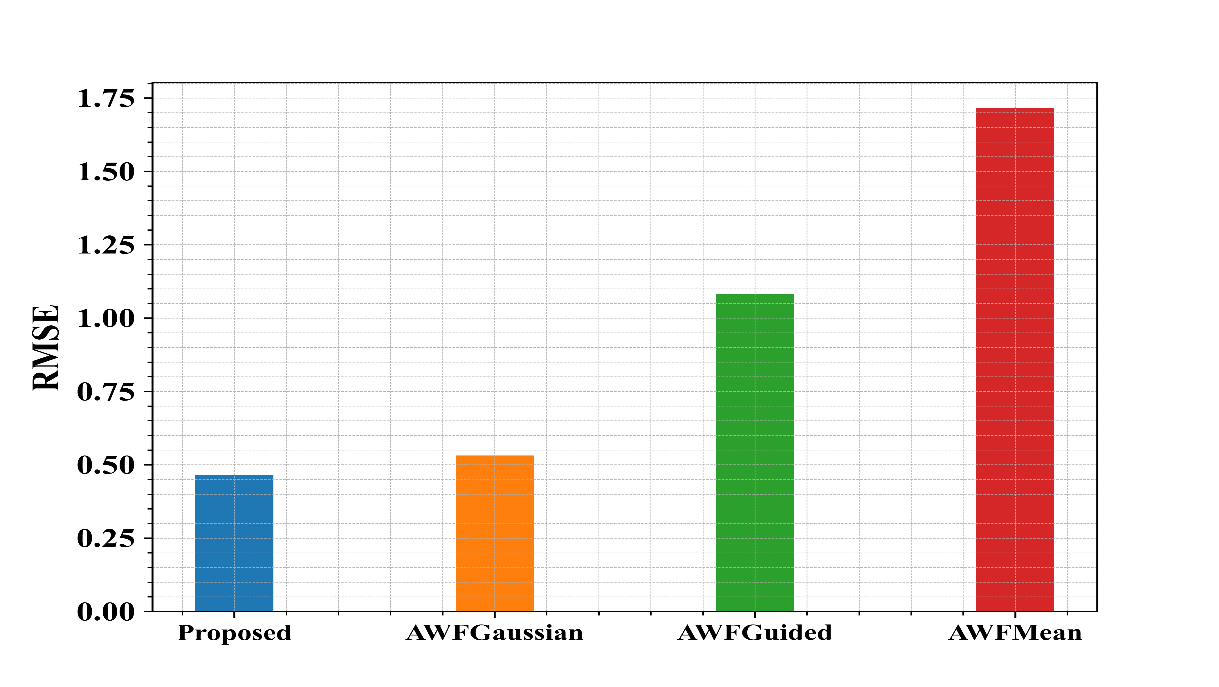
Fig 11: Examination of suggested and existing approaches in terms of RMSE
Figure 11 shows the examination of the recommended methods in regard to RMSE. From the graph, the proposed approach has a lower value compared to the other methods.
4.2.10. PSNR
PSNR can be determined between the examined image and the recovered image. MAX can be used to represent an image’s maximum value. The maximum value is 255 if 8 bits per sample are utilized to represent the pixel. Better quality is provided by higher PSNR. It is given as,
(54)
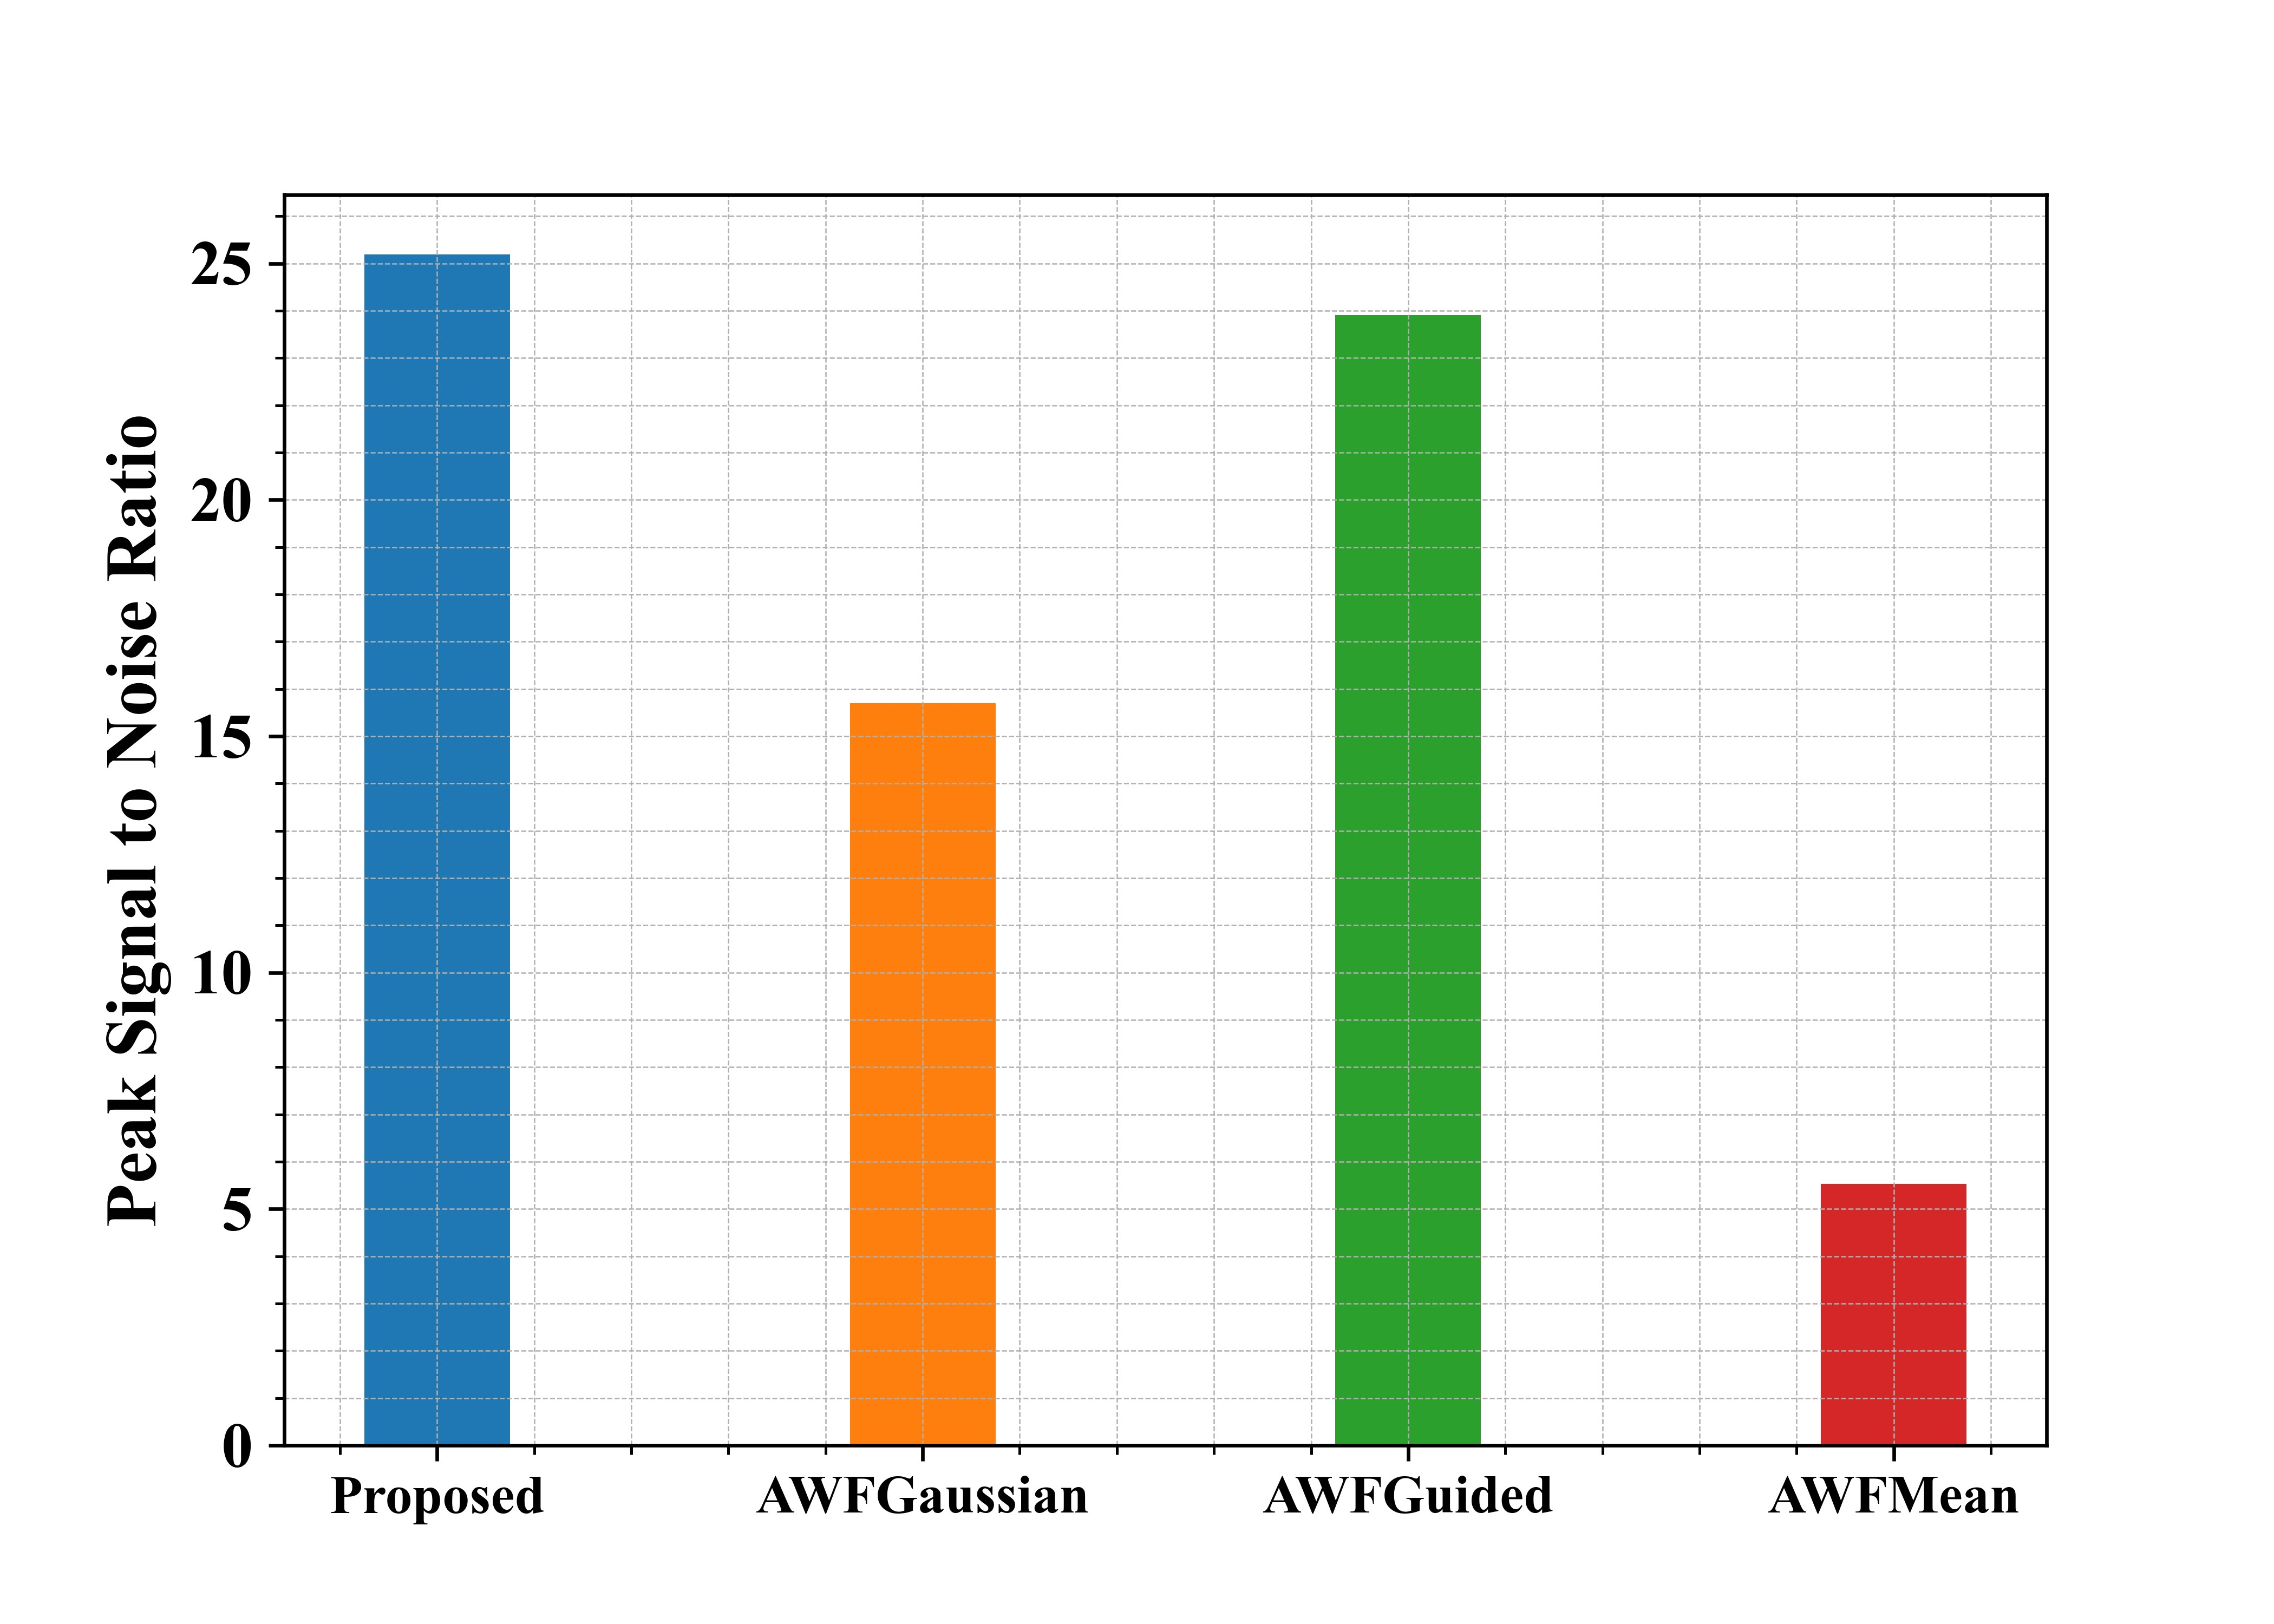
Fig 12: Examination of suggested and existing approaches in terms of PSNR
Figure 12 shows the examination of the recommended methods in use in regard to PSNR. From the graph, the proposed approach has a higher value compared to the other methods.
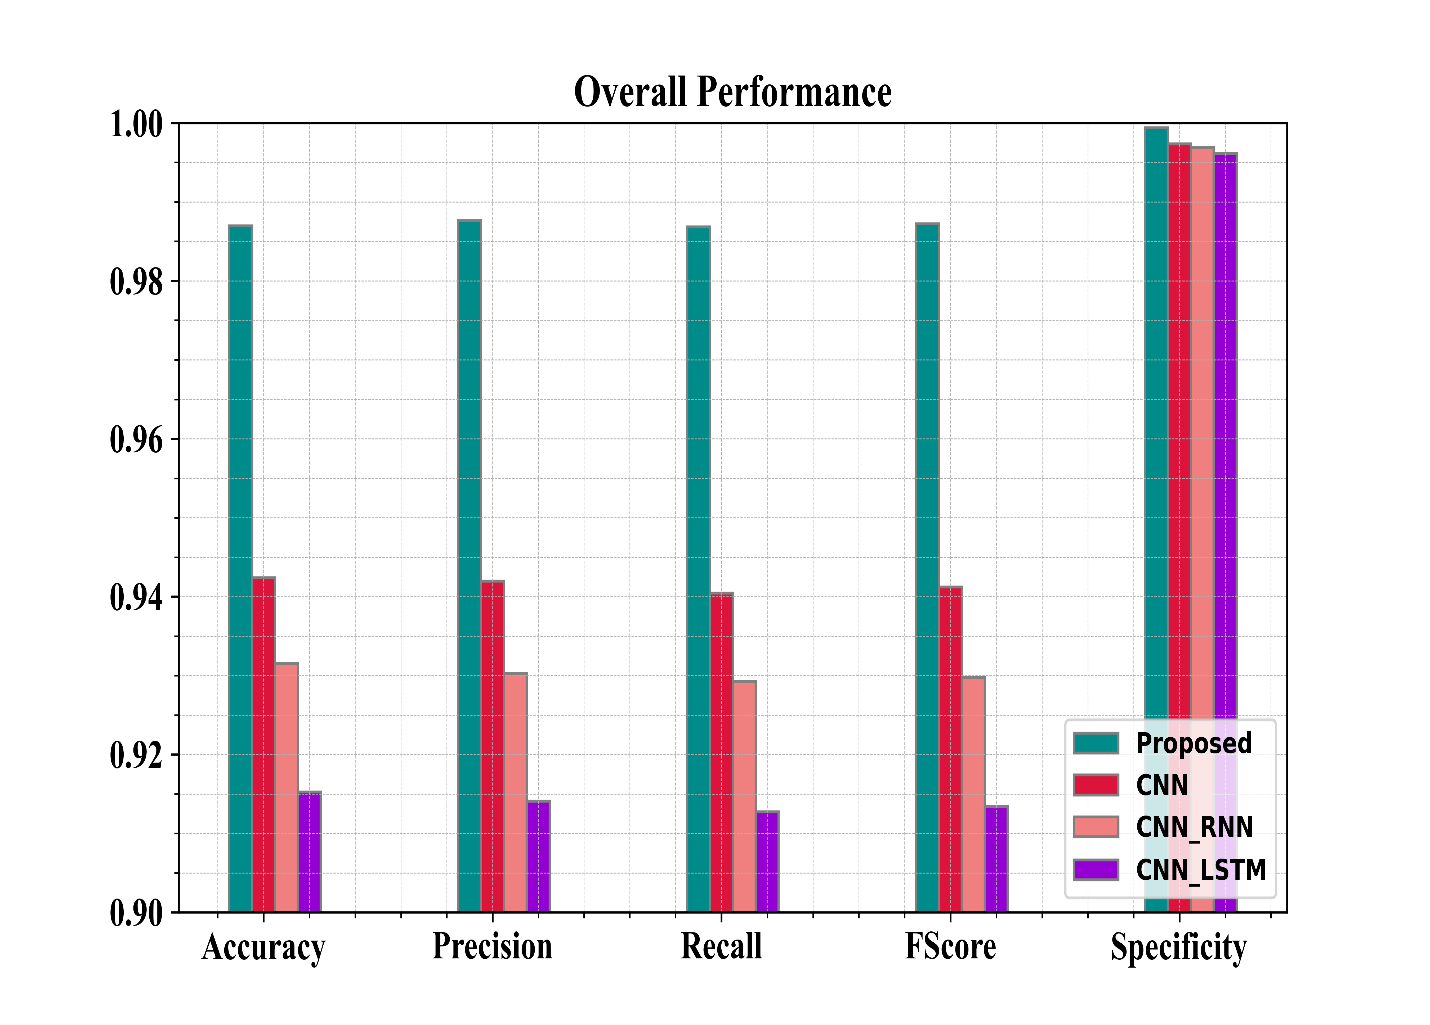
Figure 13: Overall performance of the suggested and existing approaches
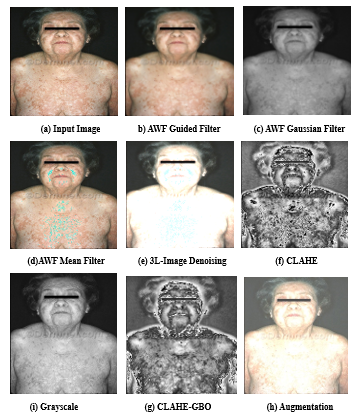
Figure 14: Various stages of pre-processed images
Figure 14 represents the Various phases of pre-processed images, and Figure 15 shows the various noises in the images before applying filters.
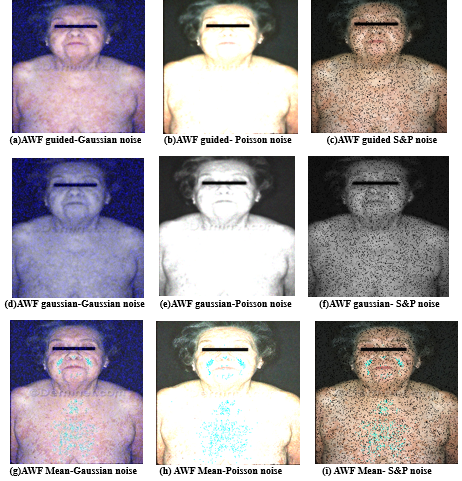
Figure 15: Images with various noises before applying filters
5. Conclusion
Though skin diseases have less mortality compared to other diseases, they affect the quality of life. To overcome the drawbacks of the existing methods, a method called the multi-level fuzzy aware denoising technique with a gradient-enhanced convolution network with a level classifier is proposed for detecting and classifying psoriasis disease. Initially, pre-processing is done by using techniques like 3-level de-noising, Image enhancement (CLAHE using Game-based optimization algorithm), Image Augmentation and Geometric transformations, and Greyscale conversion. The next step is feature extortion, in which the required features are extracted using GBO. The final step is the classification by which the result will be obtained like whether the given input is normal or abnormal using the approach called Gradient Feature Boosted Region Convolutional Neural Network (GFB-RCNN) with a Self-attention based dual Multi-Layer Perception (MLP) (SA-DMLP) is proposed. The suggested method has an Accuracy of 98.7%, Sensitivity, Precision, F-measure and Specificity of about 98.6%,98.7%,98.7% and 99.8%, respectively, and the error rates were also lower than the other methods. From the results, it is seen that the suggested approach has proven to be better than the methods in use.
References:
[1] Le, N.Q.K., Do, D.T., Nguyen, N.T.K., Hung, T.N.K. and Trang, N.T.T., 2021. Identification of gene expression signatures for psoriasis classification using machine learning techniques. Medicine in Omics, 1, p.100001.
[2] Dash, M., Londhe, N.D., Ghosh, S., Shrivastava, V.K. and Sonawane, R.S., 2020. Swarm intelligence-based clustering technique for automated lesion detection and diagnosis of psoriasis. Computational Biology and Chemistry, 86, p.107247.
[3] Sokolova, M.V., Simon, D., Nas, K., Zaiss, M.M., Luo, Y., Zhao, Y., Rech, J. and Schett, G., 2020. A set of serum markers detecting systemic inflammation in psoriatic skin, entheseal, and joint disease in the absence of C-reactive protein and its link to clinical disease manifestations. Arthritis research & therapy, 22, pp.1-8.
[4] Hammad, M., Pławiak, P., ElAffendi, M., El-Latif, A.A.A. and Latif, A.A.A., 2023. Enhanced Deep Learning Approach for Accurate Eczema and Psoriasis Skin Detection. Sensors, 23(16), p.7295.
[5] Koussiouris, J., Looby, N., Kulasingam, V. and Chandran, V., 2023. A Solid-Phase Microextraction—Liquid Chromatography-Mass Spectrometry Method for Analyzing Serum Lipids in Psoriatic Disease. Metabolites, 13(8), p.963.
[6] Song, J.K., Zhang, Y., Fei, X.Y., Chen, Y.R., Luo, Y., Jiang, J.S., Ru, Y., Xiang, Y.W., Li, B., Luo, Y. and Kuai, L., 2022. Classification and biomarker gene selection of pyroptosis-related gene expression in psoriasis using a random forest algorithm. Frontiers in Genetics, 13, p.850108.
[7] Thomsen, K., Christensen, A.L., Iversen, L., Lomholt, H.B. and Winther, O., 2020. Deep learning for diagnostic binary classification of multiple-lesion skin diseases. Frontiers in medicine, 7, p.574329.
[8] Aijaz, S.F., Khan, S.J., Azim, F., Shakeel, C.S. and Hassan, U., 2022. Deep learning application for effective classification of different types of psoriasis. Journal of Healthcare Engineering, 2022.
[9] Swapna, T., Vineela, D., Navyasree, M., Sushmtha, N. and Bhavana, P., 2021. Detection and Classification of Skin diseases using Deep Learning. The International journal of analytical and experimental modal analysis, ISSN, (0886-9367).
[10] Nieniewski, M., Chmielewski, L.J., Patrzyk, S. and Woźniacka, A., 2023. Studies in differentiating psoriasis from other dermatoses using small data set and transfer learning. EURASIP Journal on Image and Video Processing, 2023(1), pp.1-20.
[11] Roslan, R.B., Razly, I.N.M., Sabri, N. and Ibrahim, Z., 2020. Evaluation of psoriasis skin disease classification using convolutional neural network. IAES International Journal of Artificial Intelligence, 9(2), p.349.
[12] Mulder, M.L., He, X., van den Reek, J.M., Urbano, P.C., Kaffa, C., Wang, X., van Cranenbroek, B., van Rijssen, E., van den Hoogen, F.H., Joosten, I. and Alkema, W., 2021. Blood-Based Immune Profiling Combined with Machine Learning Discriminates Psoriatic Arthritis from Psoriasis Patients. International Journal of Molecular Sciences, 22(20), p.10990.
[13] AlDera, S.A. and Othman, M.T.B., 2022. A model for classification and diagnosis of skin disease using machine learning and image processing techniques. International Journal of Advanced Computer Science and Applications, 13(5).
[14] Patrick, M.T., Stuart, P.E., Raja, K., Gudjonsson, J.E., Tejasvi, T., Yang, J., Chandran, V., Das, S., Callis-Duffin, K., Ellinghaus, E. and Enerbäck, C., 2018. Genetic signature to provide robust risk assessment of psoriatic arthritis development in psoriasis patients. Nature communications, 9(1), p.4178.
[15] Emam, S., Du, A.X., Surmanowicz, P., Thomsen, S.F., Greiner, R. and Gniadecki, R., 2020. Predicting the long‐term outcomes of biologics in patients with psoriasis using machine learning. British Journal of Dermatology, 182(5), pp.1305-1307.
[16] ALEnezi, N.S.A., 2019. A method of skin disease detection using image processing and machine learning. Procedia Computer Science, 163, pp.85-92.
[17] Goceri, E., 2021. Diagnosis of skin diseases in the era of deep learning and mobile technology. Computers in Biology and Medicine, 134, p.104458.
[18] Fraiwan, M. and Faouri, E., 2022. On the automatic detection and classification of skin cancer using deep transfer learning. Sensors, 22(13), p.4963.
[19] Inthiyaz, S., Altahan, B.R., Ahammad, S.H., Rajesh, V., Kalangi, R.R., Smirani, L.K., Hossain, M.A. and Rashed, A.N.Z., 2023. Skin disease detection using deep learning. Advances in Engineering Software, 175, p.103361.
[20] Nieniewski, M., Chmielewski, L.J., Patrzyk, S. and Woźniacka, A., 2023. Studies in differentiating psoriasis from other dermatoses using small data set and transfer learning. EURASIP Journal on Image and Video Processing, 2023(1), pp.1-20.
[21] Zhou, Y., Han, L., Wang, Z., Fang, R., Wan, Y., Yang, Z., Guan, N., Li, J. and Ni, Q., 2023. Bioinformatic analysis of the potential common pathogenic mechanisms for psoriasis and metabolic syndrome. Inflammation, pp.1-15.
[22] Sahin, V.H., Oztel, I. and Yolcu Oztel, G., 2022. Human monkeypox classification is based on skin lesion images with a deep, pre-trained network using a mobile application. Journal of Medical Systems, 46(11), p.79.
[23] Khodadadi, Nima, Laith Abualigah, Qasem Al-Tashi, and Seyedali Mirjalili. “Multi-objective chaos game optimization.” Neural Computing and Applications 35, no. 20 (2023): 14973-15004.
[24] Uma, S., and P. D. Sathya. “Soccer game optimization-based forgery detection of digital images.” Forensic Imaging 25 (2021): 200453.
[25] Maduranga, M. W. P., and Dilshan Nandasena. “Mobile-based skin disease diagnosis system using convolutional neural networks (CNN).” IJ Image Graphics Signal Process 3 (2022): 47-57.
[26] Jaworek-Korjakowska, Joanna, Moi Hoon Yap, Debotosh Bhattacharjee, Pawel Kleczek, Andrzej Brodzicki, and Marek Gorgon. “Deep neural networks and advanced computer vision algorithms in the early diagnosis of skin diseases.” In State of the Art in Neural Networks and Their Applications, pp. 47-81. Academic Press, 2023.
[27] Aijaz, Syeda Fatima, Saad Jawaid Khan, Fahad Azim, Choudhary Sobhan Shakeel, and Umer Hassan. “Research Article Deep Learning Application for Effective Classification of Different Types of Psoriasis.” (2022).
Cite This Work
To export a reference to this article please select a referencing stye below:

Academic Master Education Team is a group of academic editors and subject specialists responsible for producing structured, research-backed essays across multiple disciplines. Each article is developed following Academic Master’s Editorial Policy and supported by credible academic references. The team ensures clarity, citation accuracy, and adherence to ethical academic writing standards
Content reviewed under Academic Master Editorial Policy.


