
Introduction
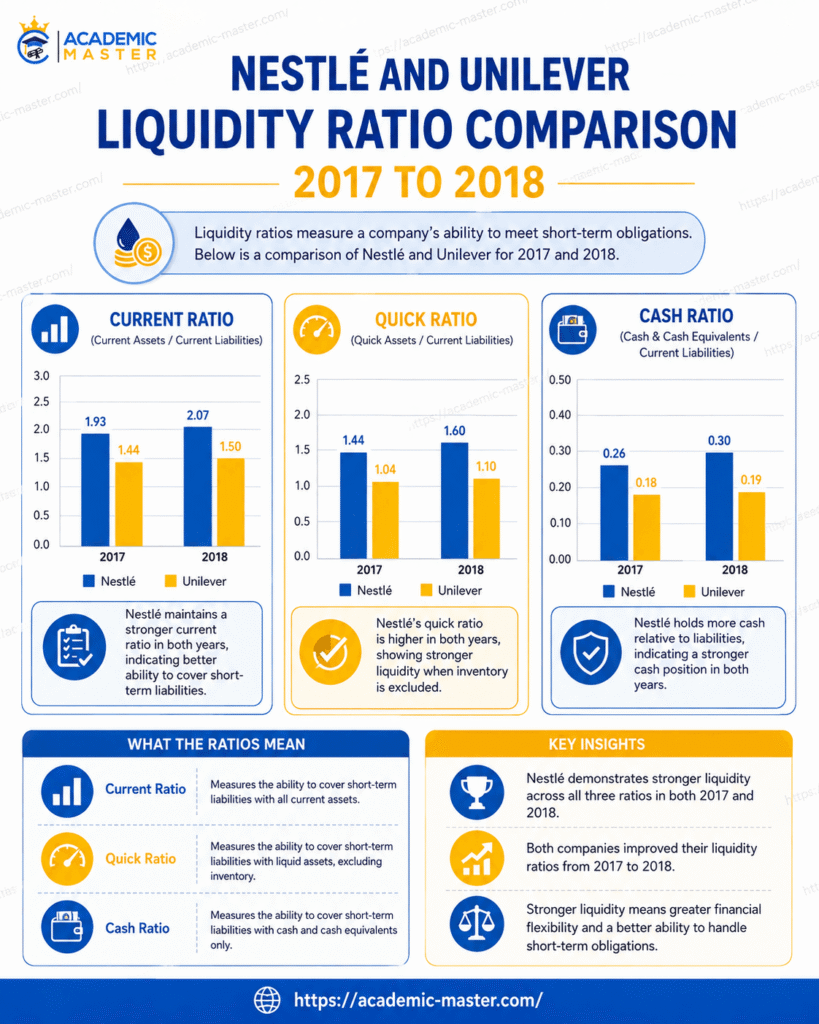
Liquidity ratios help analysts evaluate whether a company has enough short-term resources to meet obligations due within the operating cycle. This comparison examines Nestlé and Unilever using their consolidated financial statements for 2017 and 2018 and applies consistent definitions to both companies. The current ratio is calculated as total current assets divided by total current liabilities, while the quick ratio excludes inventory and other less immediately realizable items. Nestlé’s current ratio increased from approximately 0.83 in 2017 to 0.95 in 2018, whereas Unilever’s increased from approximately 0.73 to 0.78. The quick-ratio pattern differed: Nestlé moved from about 0.54 to 0.50, while Unilever improved from about 0.40 to 0.54. Both companies therefore operated with current ratios below one, meaning reported current liabilities exceeded current assets at year-end. For large fast-moving consumer-goods businesses, this does not automatically indicate financial distress because rapid sales, supplier credit, predictable cash generation, and access to financing can support negative working-capital models (Nestlé, 2019; Unilever, 2019).
A closely related analysis is available in Comparison between Nestle and Unilever.
Nestlé’s Liquidity Position
Nestlé reported current assets of CHF 31,884 million and current liabilities of CHF 38,189 million for 2017, producing a current ratio of approximately 0.83 and negative working capital of CHF 6,305 million. In 2018, current assets rose to CHF 41,003 million while current liabilities increased to CHF 43,030 million, giving a current ratio of about 0.95 and narrowing negative working capital to CHF 2,027 million (Nestlé, 2019). The improvement in the headline ratio requires interpretation because the composition of current assets changed materially. Assets held for sale increased substantially in 2018, while cash and cash equivalents declined from CHF 7,938 million to CHF 4,500 million and short-term investments increased from CHF 655 million to CHF 5,801 million. The balance sheet therefore became numerically closer to a one-to-one current coverage ratio without necessarily becoming uniformly more liquid in an operating sense. Analysts should distinguish recurring cash-generating assets from disposal-related balances and consider financing facilities, operating cash flow, and debt maturities alongside the year-end ratio.
Nestlé’s Quick and Cash Measures
Using cash and cash equivalents, short-term investments, and trade and other receivables as quick assets, Nestlé’s quick ratio was approximately 0.54 in 2017 and 0.50 in 2018. In 2017, the relevant quick assets totaled CHF 20,629 million against current liabilities of CHF 38,189 million. In 2018, cash of CHF 4,500 million, short-term investments of CHF 5,801 million, and receivables of CHF 11,167 million produced quick assets of CHF 21,468 million against CHF 43,030 million of current liabilities (Nestlé, 2019). This decline is significant because it shows that Nestlé’s improved current ratio was not matched by stronger coverage from the narrower group of assets most readily available to meet obligations. A cash-focused measure produces a similar caution. Cash plus short-term investments represented roughly one-quarter of current liabilities in both years. That level can be sustainable for a company with continuous sales and dependable credit access, but it means liquidity relies on ongoing operations, collections, treasury management, and refinancing rather than on a large idle cash reserve.
Unilever’s Liquidity Position
Unilever reported current assets of €16,983 million and total current liabilities of €23,177 million in 2017, producing a current ratio of approximately 0.73 and negative working capital of €6,194 million. In 2018, current assets declined to €15,481 million, but current liabilities fell more sharply to €19,772 million, raising the current ratio to approximately 0.78 and reducing negative working capital to €4,291 million (Unilever, 2019). The decrease in current liabilities was influenced by a substantial reduction in current financial liabilities, while portfolio changes related to the disposal of the spreads business also altered assets held for sale. Unilever’s liquidity therefore improved despite lower current assets because short-term obligations fell at a faster rate. As with Nestlé, the ratio needs to be interpreted within the operating model. Large consumer-goods groups can collect cash from customers before paying suppliers, effectively receiving working-capital financing from the supply chain. That model is efficient when sales remain stable, but it becomes more exposed if revenue falls, suppliers shorten payment terms, or market financing becomes less available.
Unilever’s Quick Ratio and Comparative Result
Unilever’s quick ratio improved more strongly than its current ratio. In 2017, cash of €3,317 million, other current financial assets of €770 million, and trade and other current receivables of €5,222 million produced quick assets of €9,309 million. Dividing this amount by current liabilities of €23,177 million gives a quick ratio of approximately 0.40. In 2018, cash of €3,230 million, other current financial assets of €874 million, and receivables of €6,485 million produced quick assets of €10,589 million against current liabilities of €19,772 million, raising the ratio to about 0.54 (Unilever, 2019). The comparison therefore depends on which measure is used. Nestlé had the higher current ratio in both 2017 and 2018, but Unilever slightly exceeded Nestlé on the quick ratio in 2018. This difference demonstrates why no single ratio should be treated as a complete judgment. The current ratio includes inventory and other current balances, while the quick ratio focuses on assets expected to convert to cash more readily.
Inventory, Receivables, and Working-Capital Quality
Inventory is especially important when interpreting liquidity in fast-moving consumer goods. Nestlé and Unilever both hold significant inventories of food, beverages, personal-care products, household goods, packaging, and raw materials, so excluding inventory from the quick ratio provides a conservative view but does not mean inventory has no liquidity value. Products with reliable demand and rapid turnover can become cash quickly, while slow-moving, perishable, or obsolete stock creates greater risk. Receivables require similar scrutiny. An invoice due from a financially strong retailer within thirty days is more liquid than a disputed or overdue balance, even though both appear in the same accounting category. Analysts should therefore review turnover, credit-loss allowances, customer concentration, and collection patterns rather than relying only on balance-sheet totals. Negative working capital can be a deliberate operating feature when customers pay quickly and suppliers extend favorable terms. It becomes risky when those relationships change. Liquidity analysis is strongest when ratios are combined with operating cash flow, debt maturity schedules, credit facilities, and multi-year trends.
Conclusion
The 2017–2018 comparison shows two large consumer-goods companies managing liquidity through negative working-capital structures rather than maintaining current assets above current liabilities. Nestlé’s current ratio improved from approximately 0.83 to 0.95, remaining higher than Unilever’s movement from about 0.73 to 0.78. The quick ratio produced a different ranking: Nestlé declined from roughly 0.54 to 0.50, while Unilever improved from about 0.40 to 0.54. Nestlé therefore appeared stronger on the broad current ratio, whereas Unilever had slightly stronger quick-asset coverage by the end of 2018. Neither result proves that one company was unable to meet short-term obligations. Both businesses generated recurring sales, managed substantial supplier relationships, and had access to financial markets. The central analytical lesson is methodological: liquidity ratios must use total current liabilities, explicit asset definitions, and consistent formulas. Their interpretation should then consider asset quality, cash conversion, financing access, portfolio changes, and operating cash flow rather than treating a ratio below one as automatic evidence of insolvency.
References
Cite This Work
To export a reference to this article please select a referencing stye below:

Academic Master Education Team is a group of academic editors and subject specialists responsible for producing structured, research-backed essays across multiple disciplines. Each article is developed following Academic Master’s Editorial Policy and supported by credible academic references. The team ensures clarity, citation accuracy, and adherence to ethical academic writing standards
Content reviewed under Academic Master Editorial Policy.





