
 discretization
mathematical modellingTextbook
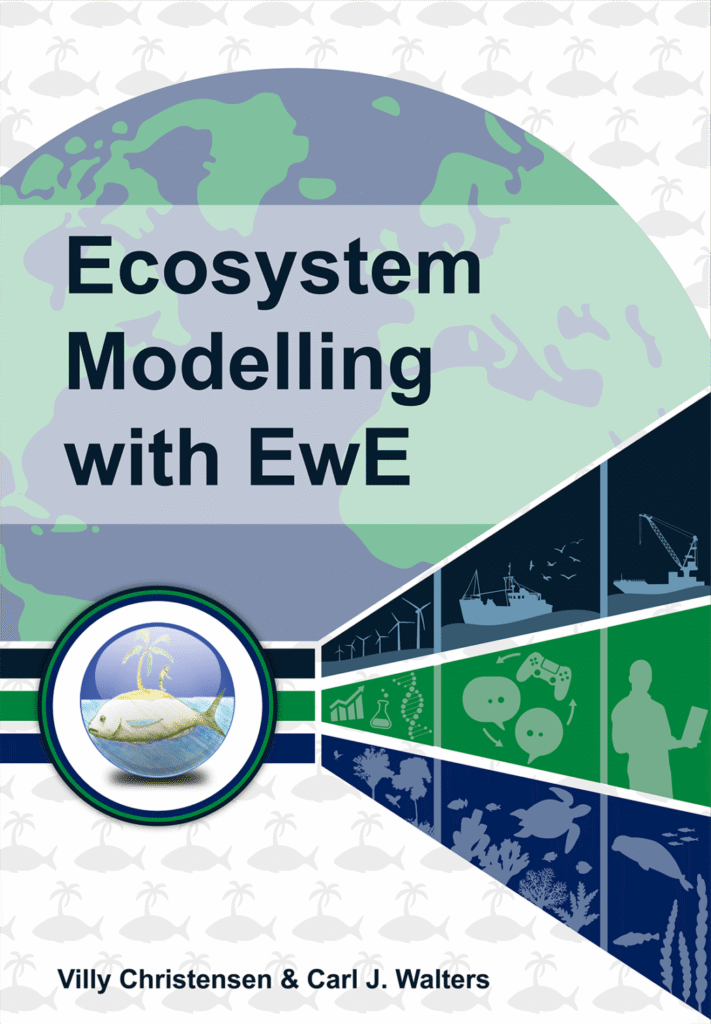
Ecosystem Modelling with EwE
Not rated yetRate this bookEcosystem Modelling with EwE connects food-web theory with Ecopath, Ecosim, Ecospace, and related tools. Villy Christensen, Carl J. Walters, and contributing authors combine explanations, Anchovy Bay tutorials, applications, and policy questions. This guide follows sixteen thematic and teaching blocks in the linked source, covering baseline construction, dynamics, fitting, fisheries, economics, space, tracers, and the limits of model-based advice.
Free reading is available at the official source. Opens in a new tab.
 Free
About this book
Ecosystem Modelling with EwE connects food-web theory with Ecopath, Ecosim, Ecospace, and related tools. Villy Christensen, Carl J. Walters, and contributing authors combine explanations, Anchovy Bay tutorials, applications, and policy questions. This guide follows sixteen thematic and teaching blocks in the linked source, covering baseline construction, dynamics, fitting, fisheries, economics, space, tracers, and the limits of model-based advice.
Chapter-wise summaries and study tasks
Ecosystem Modelling
Ecosystem modeling begins with a question that determines which relationships must be represented. The opening material connects food-web thinking with prediction, predator-prey interactions, and a deliberate definition of the ecosystem. Spatial boundary, time period, functional groups, fisheries, and exchanges with the surroundings are choices with consequences for what the model can explain. A convenient dataset should not silently determine a different question from the one the project claims to answer.
The predator-prey tutorial allows learners to explore how interaction assumptions shape behavior before building a larger food web. A simulation is conditional on those assumptions rather than a direct observation of nature. Model complexity should be justified by the decision and available evidence, not treated as an achievement in itself. State which outputs would count as useful, which observations could challenge the model, and what would remain outside its scope. This framing prepares the distinctions among Ecopath's accounting baseline, Ecosim's temporal dynamics, and Ecospace's spatial-temporal representation.
Study task. Write a model brief for a fictional ecosystem with one research question, boundaries, functional groups, outputs, evidence, and exclusions. Test how a changed predator-prey assumption alters a simple simulation's interpretation.
An Introduction to Ecopath
Ecopath organizes flows among functional groups through accounting relationships for production and consumption. Biomass, production-to-biomass and consumption-to-biomass rates, diet composition, and other inputs must use consistent units and a shared period. Consumption is allocated among production, respiration, and unassimilated material, while production has fates such as predation, catches, other losses, and relevant exchanges or accumulation. Ecotrophic efficiency concerns the portion of production accounted for by modeled uses; it is not simply digestive efficiency.
The Anchovy Bay tutorials connect these relationships with data entry and mass balancing. A value that cannot fit the accounting framework can reveal inconsistent input, aggregation, diet, or boundary assumptions, but obtaining balance does not prove a uniquely correct ecosystem. Adjustments need ecological and data-based justification rather than arbitrary tuning until a warning disappears. Multi-stanza groups represent linked life stages with different properties and require compatible growth, mortality, and biomass relationships. Uncertainty remains after balancing, so preserve the origins and confidence of inputs and explore plausible alternatives. The baseline is an explicitly defined representation, not evidence that nature remains in an unchanging equilibrium.
Study task. Construct a small fictional flow budget with consistent biomass and rate units. Diagnose an imbalance through alternative data explanations, document any revision, and identify one plausible uncertainty that remains after balance is achieved.
Network Analysis
Network analysis derives additional descriptions from the food-web representation. Trophic-level decomposition, flow and biomass summaries, primary production required, mixed trophic impacts, cycling, pathways, and other indices characterize different properties of the modeled system. They should not be treated as interchangeable measures of ecosystem health. Aggregation, diet inputs, system boundaries, and accounting choices influence the resulting indicators.
A mixed trophic impact can include indirect pathways that differ from the immediate predator-prey link, helping explain why an intuitive single-interaction prediction may fail. However, a network result still inherits the limitations of the baseline and is not automatically a forecast of a large dynamic change. Compare indices in relation to a stated question and examine how the underlying model generates them. When comparing ecosystems, check whether differences in construction and scale could explain apparent ecological differences.
Study task. Select two network outputs for a fictional question and trace the flows behind them. Explain why an indirect impact or an index difference should not be presented as a certain forecast or universal health score.
An Introduction to Ecosim
Ecosim adds temporal dynamics to the Ecopath framework. Foraging-arena theory represents the interaction between prey vulnerability and predator feeding rather than assuming all prey biomass is equally available. Dynamic modeling requires attention to state variables, rates, numerical behavior, and the biological interpretation of parameters. The food-chain tutorial gives a manageable setting in which to examine how consumption and biomass respond to changes.
Age structure, recruitment and compensation, satiation, foraging time, and functional responses introduce mechanisms that can strongly affect outcomes. Multiple stable states or unstable trajectories may arise from interaction assumptions rather than a software malfunction. The material also examines hatchery production, non-additive mortality, shared foraging arenas, and bout feeding. These mechanisms should be connected to a research need and evidence before being activated simply because they are available. Tutorials involving group information and result extraction support inspection of what the model actually did. Compare trajectories and mechanisms across plausible settings, distinguish transient from longer-run behavior, and retain a reproducible baseline for each experiment.
Study task. Use a fictional food-chain simulation to vary one interaction assumption at a time. Compare biomass and consumption trajectories, identify transient versus persistent changes, and explain which observation could help distinguish the alternatives.
Ecosim: Environment
Environmental effects can enter ecosystem dynamics through primary production, nutrient conditions, physiological responses, or changes to interactions. Forcing functions represent specified external influences, whereas mediation allows one component to alter the relationship between others. These are different causal structures, even if they generate superficially similar trajectories. A statistical association with an environmental series does not uniquely identify which mechanism belongs in the model.
The tutorials explore forcing, mediation, trawling-related interactions, noise, and cyclic dominance. They show why effects can propagate indirectly and why a response may change when variability is added. Every environmental driver needs a rationale, appropriate units and timing, and a defensible response shape. Avoid allowing a flexible forcing curve to absorb all model-data discrepancy without an ecological explanation. Compare scenarios with the same baseline and record which component was changed. The goal is to learn how a mechanism alters a conditional prediction, not to turn every fitted environmental relationship into an established cause.
Study task. Design paired fictional scenarios using external forcing and mediation. Draw their different causal pathways, explain input timing and uncertainty, and identify a model response that would distinguish the mechanisms.
Fitting Models to Data
Fitting relates model behavior to historical observations, with particular attention to density dependence, carrying capacity, and vulnerability multipliers. The chapter group examines ecological and historical reasoning alongside statistical estimation. A vulnerability multiplier affects interaction dynamics; it should not be interpreted as a directly observed universal constant. Data may provide limited information about several interacting parameters, allowing different explanations to fit similarly well.
Case studies show that fitting choices can change management advice, not merely improve a graph. The time-series tutorials, Monte Carlo runs, stock-reduction analysis, uncertainty exercises, and Ecosampler material provide tools for exploring these consequences. Distinguish uncertainty in observations from uncertainty in parameters and model structure. A best-fitting history does not guarantee reliable prediction under a new disturbance or policy. Retain biologically plausible alternatives, inspect residual patterns and influential series, and test sensitivity of the actual decision-relevant output. Document the fitting objective, constraints, free parameters, data treatment, and reason for accepting or rejecting a candidate model.
Study task. Prepare a fictional fitting protocol with input series, uncertainty assumptions, parameters, ecological constraints, and evaluation criteria. Compare two similarly fitting models by their policy predictions and identify evidence that could discriminate between them.
Ecosim: Fisheries
The fisheries material uses ecosystem dynamics to examine exploitation and management rather than treating each stock as independent of the food web. The MSY tutorial compares single-species and ecosystem-level perspectives, making trade-offs visible when changing one fishery affects other groups. A modeled reference point remains conditional on the assumed ecosystem, fleet behavior, and objectives; it is not an automatic management prescription.
Management strategy evaluation considers how a rule performs through an observation, assessment, decision, and implementation process under uncertainty. The associated plug-in tutorial, constrained-effort optimization, recovery scenarios, and fleet-effort dynamics address related but distinct questions. Maximizing a chosen objective differs from evaluating robustness of a management procedure. Recovery depends on assumptions and interactions rather than a single universal timeline. Explain whose objectives are represented, which constraints apply, and how errors or unexpected conditions could change performance before presenting a preferred scenario.
Study task. Compare a fictional yield-maximizing scenario with a management-strategy evaluation. Specify objectives, observation and implementation errors, constraints, and performance measures, then explain why the preferred policy could differ.
Ecological, Social and Economic Factors
Ecosystem management affects people through linked ecological, economic, social, and cultural processes. Revenue is not the same as profit, and benefits can be distributed unevenly along a value chain. Catch changes can affect prices and costs, so a fixed price assumption may conceal feedback. The value-chain and price-elasticity tutorials connect these mechanisms with model outputs rather than assuming that more catch always produces proportionally greater welfare.
Policy exploration combines objectives and constraints whose weights represent judgments, not facts supplied by the ecosystem model. Risk-averse utility and portfolio reasoning make some attitudes toward uncertainty explicit, but they do not capture every value or distributional concern. A result favorable in aggregate may burden a particular fleet, community, or worker group. Compare ecological trajectories with economic assumptions and identify who receives gains or bears costs. Use sensitivity analysis to show how a ranking depends on weights, prices, costs, and uncertainty, and keep deliberation about values separate from estimation of biological parameters.
Study task. Build a fictional policy comparison with biomass, catch, revenue, profit, and distributional outcomes. Vary price and objective weights, and explain whose interests remain poorly represented even when the aggregate score improves.
Tutorial: Trade-offs between policy objectives
The standalone trade-off tutorial focuses on how competing policy objectives respond to changes in their relative weights. A numerical objective compresses different outcomes into a decision rule, so the chosen weights can change the favored trajectory. Trial and comparison are useful for exploring these effects but do not identify a scientifically mandatory set of values.
Report actual outcome measures alongside the composite score so readers can see what is sacrificed for an apparent improvement. If modest weight changes produce very different recommendations, that sensitivity is substantive information for deliberation. Explain any constraints that prevent an option from being considered and distinguish a feasible solution from one that is socially acceptable. Optimization supports examination of trade-offs; it does not settle them on behalf of affected people.
Study task. Run or outline a fictional weight-sensitivity exercise for two conflicting objectives. Present the separate outcomes and explain the value judgment behind each preferred option.
External bio-economic models
The external bio-economic modeling section points readers toward ways of connecting ecological outputs with additional economic frameworks and published applications. Such coupling can extend the questions considered, but it also introduces assumptions, parameters, and boundaries not supplied by the ecological model. An output transferred between models must represent the same quantity, unit, time interval, and scenario.
Feedback is important: a one-way transfer of catch to an economic calculation differs from a coupled system in which prices or fleet responses affect future exploitation. The source's brief discussion and references should be treated as pathways for further study, not as a complete implementation manual for every external model. Evaluate documentation and validation for each component and for the connection between them.
Study task. Specify a hypothetical interface between an ecosystem model and an economic model, including units, timing, assumptions, and feedback. Identify a mismatch that could produce a misleading combined result.
Ecospace Introduction
Ecospace represents spatial-temporal dynamics when the question genuinely requires location. A spatial model adds demands for habitat information, maps, movement, environmental fields, and spatial patterns of fishing. Habitat capacity and movement assumptions influence where modeled groups can occur and how they respond. More mapped detail does not automatically provide more reliable evidence than a well-justified nonspatial model.
The introductory material connects multi-stanza groups and individual-based approaches with spatial implementation. Anchovy Bay tutorials cover a spatial model, bathymetric base maps, fleet distributions, AIS-related information, map outputs, and a spatial-temporal framework. Migration and advection introduce different forms of movement that should not be conflated. Define resolution, boundaries, and temporal alignment before interpreting an apparent local effect. A map is a model result, not an observation simply because it resembles a geographic dataset. Compare predicted distributions with suitable evidence and inspect how sensitive the research conclusion is to habitat and movement assumptions.
Study task. Write a spatial-model brief for a fictional protected-area question. Specify resolution, habitat and movement data, fleet representation, boundaries, and a validation plan; justify why a nonspatial analysis would be insufficient.
Spatial Planning
Spatial planning evaluates uses of marine space that may conflict across activities, locations, institutions, and time. The MSP Challenge material connects scientific simulations with planning and stakeholder learning. Protected-area tutorials, spatial optimization, and coastal restoration illustrate different applications, each requiring clear objectives and a suitable representation of ecological and human responses.
An optimized map depends on its objective function, constraints, candidate areas, and assumptions about movement and displaced effort. Closing an area does not remove every associated pressure from the wider ecosystem; activity may move elsewhere. A restoration scenario also requires an explicit mechanism and timescale. Use alternative configurations and uncertainty tests to expose which assumptions drive the apparent benefit. Spatial output can inform discussion, but neither a colorful map nor a maximum score substitutes for governance, rights, practical feasibility, and assessment of who is affected.
Study task. Compare two fictional protected-area configurations with the same total area. Explain habitat, connectivity, displaced effort, objectives, and uncertainty, and identify a stakeholder question the model cannot answer on its own.
Spatial Applications
The application collection examines how spatial ecosystem models are used for structures, renewable energy, aquaculture, protected areas, nutrient loading, hypoxia, episodic mortality, noise, invasive species, and other pressures. These cases demonstrate different ways a mechanism can be represented, not a claim that every pressure is automatically handled by a single validated default. Translate each application back into inputs, processes, observations, and decision-relevant outputs.
Safe operating space, environmental impact assessment, and global-ocean climate applications extend the discussion across scales and combinations of pressure. The section on Ecospace limitations is essential to interpreting such ambition. Sparse observations, aggregation, movement, habitat responses, and scenario uncertainty can constrain conclusions. A case study from one ecosystem supplies an example and possible method, not parameters that can be transferred without scrutiny. For a proposed application, state both the mechanism modeled and the important impacts omitted, and compare alternatives under consistent conditions.
Study task. Select two source application types and outline their different causal pathways in a fictional system. List the required data, omitted processes, validation evidence, and limits on transferring results from another location.
Tracking Persistent Pollutants
Ecotracer follows substances through an ecosystem using the underlying trophic flows together with additional uptake, elimination, initial-condition, and external-input assumptions. Temporal or spatial-temporal applications can track contaminants, isotopes, and related materials, but the representation must match the substance and question. Biomass dynamics and concentration dynamics are related without being identical.
The applications and tutorials include microplastics and caesium, illustrating why different substances may require different assumptions. A balanced food web is a starting point rather than sufficient evidence for the added tracer model. Distinguish concentration from total burden and internal transfer from external exposure. Calibrate and evaluate the additional processes where evidence permits, inspect mass and unit consistency, and avoid inferring human-health safety from an ecological concentration output without a separate appropriate assessment. Report uncertainty in the tracer inputs as well as the food-web model.
Study task. Design a fictional tracer budget with external inputs, trophic transfer, uptake, and loss. Distinguish concentration from total amount and identify the additional measurements needed beyond the baseline ecosystem model.
Research and Policy Questions
The research-and-policy section is explicitly identified in the source as under development in 2026. It offers a question-led collection around forage fish, marine mammals, bycatch, indicators, harvest rules, management-strategy evaluation, balanced harvesting, climate, invasive species, protected areas, reefs, infrastructure, and socio-ecological trade-offs. These topics should be read as differently developed research prompts, not as equally complete demonstrations or settled recommendations.
Their common value is to connect a management concern with a model that can meaningfully represent the relevant mechanisms. Define the intervention, comparator, outcome, uncertainty, and decision context before selecting software features. Some questions require spatial detail, some need human-response models, and some cannot be answered with the available evidence. A defensible conclusion can be that further data or a different method is required. Revisit the opening model brief to ensure that the analysis still addresses the original question and has not drifted toward whatever outputs were easiest to generate.
Study task. Choose one policy prompt and turn it into a research design with intervention, comparator, outcomes, evidence, uncertainty, and model limitations. Identify a result that would justify further investigation rather than immediate advice.
Course planning
The course-planning section provides an example of a five-day intensive route through the material. It moves from framing and Ecopath construction through dynamic models, fitting, and later spatial work. The schedule shows dependencies and possible teaching activities; it is not a guarantee that a beginner can become an independent practitioner in one week.
Use the plan to identify prerequisites, needed software and example files, opportunities for supervised practice, and checkpoints for understanding. A learner who can reproduce tutorial clicks may still need help explaining units, parameter choices, uncertainty, or the meaning of a scenario. Build in reflection and documentation rather than rushing to the most advanced feature. Adapt the pace to the research question and the learner's preparation, and return to earlier assumptions whenever later outputs reveal an inconsistency.
Study task. Adapt the sample course into a realistic learning plan with prerequisite checks, milestones, tutorial files, interpretation exercises, and a final model-review discussion rather than only completed software steps.
How to study this book
- Begin with a research brief and decide whether the question requires accounting, temporal dynamics, spatial detail, or additional human-response modeling.
- Preserve a documented baseline and record input sources, units, confidence, parameter changes, and scenario names.
- Complete tutorials as controlled experiments: predict the effect, change a stated assumption, inspect outputs, and explain the mechanism.
- Distinguish balancing, fitting, validation, uncertainty analysis, optimization, and management-strategy evaluation; each answers a different question.
- Use the source's web links for software, example files, plug-ins, and media; verify compatibility when reproducing edition-specific interface instructions.
- Report alternative plausible models and separate outcomes from value judgments before presenting a preferred policy.
Questions for reflection
- Does the model represent the mechanism needed to answer the question?
- Which assumptions are supported by data and which are convenient choices?
- Could another plausible model fit history but reverse the recommendation?
- Who gains, who bears costs, and which values are absent from the numerical objective?
- What evidence would justify limiting the conclusion or using a different method?
Source edition and coverage
The guide follows the thematic structure of the linked Ecosystem Modelling with EwE source, including its tutorials, applications, standalone policy-trade-off and external-model sections, and course plan. It credits the 2024 Ecopath International Initiative work and its contributors. The research-and-policy part is explicitly marked as under development in 2026, and coverage is not presented as equally complete across all prompts. Software instructions and case studies belong to the source version; the guide is educational rather than site-specific fisheries advice. These are original study explanations and learning tasks. Read the complete book at the official source.
About access & copyright
This page provides book information and study material. Full-text access is provided by the original publisher or authorised source; a listing does not grant permission to republish the book.
Read our Library Access & Copyright policyExplore the contents
Check the chapters covered in this edition.
Visit the official source
See reading, preview or purchase options.
Save for later
Keep this textbook in your saved collection.
Reader ratings & reviews
Share your thoughts
Your review helps other students choose the right resources.
KEEP LEARNING
Your next great read
discretizationEnvironmental Toxicology
Environmental Toxicology
View Environmental Toxicology — bookVaccination Programmes
Vaccination Programmes
View Vaccination Programmes — bookRelativistic Quantum Mechanics
Relativistic Quantum Mechanics
View Relativistic Quantum Mechanics — bookAerospace Structures
Aerospace Structures
View Aerospace Structures — book Abelian number fields
Number Fields
View Number Fields — book Textbook
Agricultural Meteorology and Climatology
View Agricultural Meteorology and Climatology — book Language teaching and learning
In the Community: An Intermediate Reading and Writing Textbook
View In the Community: An Intermediate Reading and Writing Textbook — book Communication Studies
Technical Writing Essentials 2nd Edition
View Technical Writing Essentials 2nd Edition — book Language learning for academic, technical and scientific purposes