
 Business
Textbook
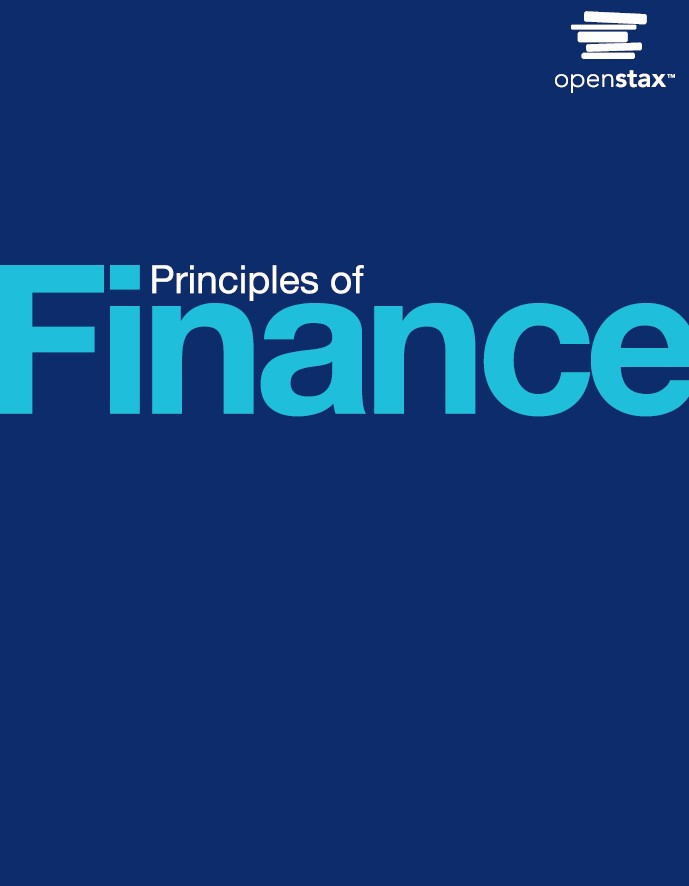
Principles of Finance 2e
Not rated yetRate this bookPrinciples of Finance 2e develops the tools for analyzing cash flows, value, risk, and organizational financial decisions. Julie Dahlquist, Rainford Knight, and contributors connect accounting and statements with time value, securities, statistics, investment appraisal, financing, forecasting, working capital, and risk management across twenty chapters. This guide uses hypothetical learning tasks to make assumptions, timing, and uncertainty explicit.
Free reading is available at the official source. Opens in a new tab.
 Free
About this book
Principles of Finance 2e develops the tools for analyzing cash flows, value, risk, and organizational financial decisions. Julie Dahlquist, Rainford Knight, and contributors connect accounting and statements with time value, securities, statistics, investment appraisal, financing, forecasting, working capital, and risk management across twenty chapters. This guide uses hypothetical learning tasks to make assumptions, timing, and uncertainty explicit.
Chapter-wise summaries and study tasks
Chapter 1 Introduction to Finance
Finance concerns how resources are raised, allocated, valued, and managed over time under uncertainty. Organizational decisions connect investments, financing, and day-to-day liquidity with financial markets and participants. Data and technology support analysis, but the quality of inputs and the assumptions behind a model remain essential. Financial instruments allocate claims and risk in different ways. The opening chapter introduces time and value as a common language for comparing alternatives. A useful financial question specifies whose cash flows matter, when they occur, what uncertainty they carry, and what objective the decision is intended to serve.
Study task. Map a fictional firm's investment, financing, and operating decisions; identify the cash flows, stakeholders, and uncertainty associated with each.
Chapter 2 Corporate Structure and Governance
Business structures distribute liability, ownership, control, and financing possibilities differently. In corporations, shareholders delegate decisions to managers, creating agency problems when incentives or information diverge. Boards provide oversight, but their effectiveness depends on independence, knowledge, accountability, and the quality of available information. Investors and intermediaries also influence governance through their relationships with the firm. Domestic and global operations add institutional complexity. Evaluate governance as a system of decision rights and safeguards rather than assuming that formal roles automatically ensure alignment between owners, managers, and other affected parties.
Study task. Design governance safeguards for a fictional conflict between managers and shareholders; explain the board's role and the limitations of an incentive-based remedy.
Chapter 3 Economic Foundations: Money and Rates
Financial decisions occur within an economic environment of changing demand, business cycles, interest rates, and exchange rates. Microeconomic and macroeconomic perspectives help explain different influences on firm cash flows and financing costs. Interest rates connect present and future amounts, while currency movements affect transactions across markets. Economic data need careful attention to definitions, timing, revisions, and comparability. The chapter provides foundations for interpreting context rather than predicting the next market movement with certainty. State how an economic variable enters the analysis and whether its change affects revenue, costs, discount rates, or several channels.
Study task. Create a sensitivity map showing how a hypothetical rate increase and currency depreciation affect an importing firm; distinguish direct effects from uncertain responses.
Chapter 4 Accrual Accounting Process
Accrual accounting records economic activity according to recognition rules rather than only when cash changes hands. Revenue and expense timing can therefore differ from cash receipts and payments. Capitalizing an item spreads its recognized cost through later periods, while expensing it recognizes the cost sooner. Profit measures depend on these classifications and should not be confused with cash available to pay obligations. Understanding the accounting process helps a financial analyst ask why reported performance changed. Compare transactions across the income statement, balance sheet, and cash records before treating earnings as an interchangeable measure of liquidity.
Study task. Record fictional sales, purchases, and equipment spending on both cash and accrual bases; explain why the resulting profit and cash balance differ.
Chapter 5 Financial Statements
Financial statements present related views of performance, resources, financing, and cash movement. The income statement covers a period, while the balance sheet reports a position at a date. Changes in equity and cash-flow statements help reconcile what happened between those snapshots. Operating cash flow and free cash flow answer questions distinct from net income, with definitions that should be stated clearly. Common-size statements improve comparison but do not remove accounting or business-model differences. Read the statements together and examine notes or reporting choices before drawing conclusions from a single favorable number.
Study task. Build a simplified set of linked statements and reconcile net income with operating cash flow; explain a case in which profitable growth strains cash.
Chapter 6 Measures of Financial Health
Financial ratios condense information about efficiency, liquidity, solvency, valuation, and profitability. Their interpretation depends on definitions, industry conditions, business strategy, accounting choices, and time period. A ratio is a starting point for investigation rather than a verdict. The DuPont framework separates return on equity into components, showing how margins, asset use, and leverage contribute differently. Higher leverage can improve a return measure while increasing risk. Use trends and suitable peers, and investigate numerator and denominator changes instead of assuming that movement in the preferred direction always signals better financial health.
Study task. Calculate a small ratio dashboard and a DuPont decomposition for a fictional firm; identify one apparent improvement that could conceal additional risk.
Chapter 7 Time Value of Money I: Single Payment Value
Single-payment time-value analysis compares amounts at different dates through compounding and discounting. Present value and future value depend on the rate, number of periods, and timing convention. A stated annual rate cannot be combined casually with monthly periods without adjustment. Financial calculators and spreadsheets implement the relationships, but sign conventions and input errors can produce misleading results. Draw a timeline before selecting a formula. The chapter establishes the reasoning needed for later valuation: amounts occurring at different times must be moved to a common date before they can be compared meaningfully.
Study task. Calculate present and future values by formula and spreadsheet for the same hypothetical payment; verify rate-period consistency and explain the effect of a higher rate.
Chapter 8 Time Value of Money II: Equal Multiple Payments
Equal-payment streams introduce annuities and perpetuities, with timing distinguishing an ordinary annuity from an annuity due. Loan amortization divides payments between interest and principal, causing the outstanding balance and interest component to change over time. Stated and effective rates differ when compounding occurs more than once per year. Spreadsheet methods are useful only when payment frequency, rate, term, and timing are aligned. An apparently smaller periodic payment may reflect a longer obligation rather than a lower total cost. Compare the complete cash-flow structure instead of payment size alone.
Study task. Create a short amortization schedule, reconcile the ending balance, and compare two hypothetical loans using effective rates and total payments.
Chapter 9 Time Value of Money III: Unequal Multiple Payment Values
Unequal cash-flow streams require valuing each payment according to its own date rather than applying an equal-payment shortcut. A timeline makes gaps, signs, and terminal amounts visible. Present values can be added after discounting all flows to a common date. Calculator and spreadsheet functions need careful interpretation of whether an initial cash flow occurs at time zero or the end of the first period. The method extends to irregular projects and securities but still depends on an appropriate rate and explicit assumptions. Correct arithmetic does not establish that forecast cash flows are reliable.
Study task. Value a fictional sequence with an initial outlay, uneven receipts, and a final payment; check a spreadsheet against separately discounted cash flows.
Chapter 10 Bonds and Bond Valuation
A bond combines contractual payments with risks associated with interest rates, default, and other terms. Valuation discounts expected coupon and principal payments using a rate appropriate to the instrument and assumptions. Price and required yield generally move in opposite directions for fixed cash flows. Yield curves summarize rates across maturities but require interpretation rather than serving as a guaranteed forecast. Coupon rate, current yield, and yield to maturity are different concepts. Spreadsheets support comparison, while sensitivity analysis shows how prices respond when rates or credit assumptions change.
Study task. Price a hypothetical fixed-coupon bond at two required yields, distinguish coupon rate from yield, and explain why payment promises do not eliminate default risk.
Chapter 11 Stocks and Stock Valuation
Stock valuation estimates the value of uncertain ownership cash flows using approaches such as dividend discounting and discounted cash flow. Preferred stock has different payment characteristics from common equity. Growth assumptions, required returns, and terminal value can dominate results, so a precise output may conceal substantial uncertainty. Comparable approaches require genuinely informative benchmarks rather than superficial similarity. Efficient-market ideas ask how information is reflected in prices and what that implies for interpretation. Compare model values with sensitivity ranges and clearly distinguish a conditional estimate from an assured future market price.
Study task. Build a hypothetical dividend valuation and vary growth and required return; explain why small assumption changes can produce large differences in estimated value.
Chapter 12 Historical Performance of US Markets
Historical market returns provide evidence about past performance, variation, inflation, and the relationship between asset classes. Nominal and real returns answer different questions, while averages depend on whether an arithmetic or compound measure is used. Bonds and stocks expose investors to different combinations of income uncertainty, price change, and purchasing-power risk. Selected periods can create misleading impressions if losses, survivorship, or changing conditions are ignored. The chapter's historical records are inputs for learning, not promises. Explain the sample, period, and measure before using past results to discuss risk or expectations.
Study task. Calculate arithmetic, geometric, nominal, and real returns for a fictional series; explain which measure answers each question and why none guarantees future performance.
Chapter 13 Statistical Analysis in Finance
Statistical tools describe financial data through location, spread, position, distributions, and visual displays. Means can be affected by extreme values, while variation and quantiles reveal aspects hidden by a single average. Probability models formalize uncertainty under assumptions that may fit financial observations imperfectly. Graphs can expose asymmetry, outliers, or changing conditions. The introduction to R supports reproducible analysis, but interpretation requires attention to units, sampling, and transformations. A distribution fitted to historical returns does not ensure the same distribution will describe future outcomes.
Study task. Summarize a hypothetical return series with mean, median, dispersion, and a plot; explain an outlier's influence and document the assumptions of a proposed distribution.
Chapter 14 Regression Analysis in Finance
Correlation describes the strength and direction of a linear relationship, while regression estimates a conditional model relating variables. A best-fit line does not establish causation and can be distorted by unusual points or an unsuitable functional form. Residual analysis helps examine whether the model misses important structure. Predictions need uncertainty intervals and caution outside the observed range. Financial applications require particular attention to changing relationships and data timing. R can reproduce calculations, but a credible report explains the variables, sample, fit, assumptions, and limits rather than presenting a coefficient as an economic law.
Study task. Fit a simple fictional regression, inspect residuals and an influential observation, and distinguish a fitted mean from a prediction for an individual future value.
Chapter 15 How to Think about Investing
Investment analysis relates expected return to uncertainty and the interaction among assets. Diversification can reduce risk associated with imperfectly correlated positions without eliminating all risk. The CAPM links expected return with systematic exposure under particular assumptions, and performance measures evaluate outcomes relative to a risk or benchmark framework. Historical estimates of covariance, beta, and return are uncertain. Spreadsheet exercises should expose how portfolio weights and assumptions affect results. A model-based ranking is not a personalized recommendation; suitability depends on objectives, constraints, horizon, and risks outside a simplified calculation.
Study task. Compare the risk of a hypothetical two-asset portfolio under different correlations, then explain what CAPM captures and what it leaves out.
Chapter 16 How Companies Think about Investing
Corporate investment decisions compare project costs and benefits over time. Payback emphasizes recovery time but can ignore later cash flows and discounting. Net present value evaluates value added under a chosen discount rate, while internal rate of return can be misleading for unconventional cash flows or mutually exclusive projects. Alternative methods provide additional perspectives without removing the need to forecast relevant incremental cash flows. Project scale and timing matter when rankings conflict. Use sensitivity analysis and explain decision constraints rather than selecting whichever metric favors a preferred proposal.
Study task. Evaluate two fictional projects using payback, NPV, and IRR; explain any ranking conflict and test the assumption most important to the decision.
Chapter 17 How Firms Raise Capital
Capital structure concerns how firms combine debt, equity, and other funding sources. Costs of capital reflect required compensation for risk and claims on cash flows. Weighted average cost of capital combines component costs using relevant weights and assumptions, but it is not automatically the right discount rate for every project. More debt can offer benefits while increasing financial distress and reducing flexibility. An optimal structure depends on circumstances rather than a universal debt ratio. Evaluate financing availability, control, risk, and the use of funds together when comparing alternatives.
Study task. Calculate a hypothetical WACC with stated weights and costs; explain why a project with a different risk profile may require a different discount rate.
Chapter 18 Financial Forecasting
Forecasting connects assumptions about sales and operations with pro forma statements, financing needs, and cash flows. A consistent forecast maintains relationships among income, assets, liabilities, and equity rather than projecting each line independently. Growth can create a financing requirement when working assets expand before cash is collected. Scenario and sensitivity analysis make uncertainty visible and help distinguish a plausible range from an arbitrary point estimate. Spreadsheet models need transparent inputs and checks. The value of growth depends on returns and funding requirements, not simply on the percentage increase in revenue.
Study task. Build a short fictional sales-driven forecast with linked statements; identify the financing gap and compare a base case with a slower-collection scenario.
Chapter 19 The Importance of Trade Credit and Working Capital in Planning
Working-capital planning manages the timing of cash tied up in receivables, inventory, payables, and related operating balances. Trade credit supports transactions but introduces terms, implicit costs, and counterparty risk. Holding more cash or inventory can improve resilience while reducing returns or increasing carrying costs. Tight collection policies may improve cash availability but affect customers and sales. A short-term plan should connect daily operations with expected receipts, payments, and minimum liquidity needs. Profitable activity can still fail when cash arrives too late to meet obligations.
Study task. Prepare a fictional monthly cash budget and calculate the cash-conversion cycle; compare the liquidity and customer effects of changing credit terms.
Chapter 20 Risk Management and the Financial Manager
Risk management identifies exposures, evaluates their consequences, and considers how to retain, reduce, transfer, or hedge them. Commodity prices, exchange rates, and interest rates can affect different parts of a firm's cash flows and financing. A hedge should address a defined exposure rather than create an unrelated speculative position. Contract design, basis differences, timing, counterparty obligations, and costs can leave residual risk. Financial managers should compare the protected outcome with the unhedged business exposure and test adverse scenarios. Success is not necessarily the largest trading profit, but a risk profile consistent with organizational objectives.
Study task. Map a fictional importer's currency exposure and compare an unhedged case with a simplified hedge; identify remaining risks and avoid using live trading recommendations.
How to study this book
- Draw a cash-flow timeline and state the relevant perspective before choosing a valuation method.
- Separate spreadsheet inputs from formulas, document units and timing, and reconcile results using an independent check.
- Compare methods by what they measure and test the assumptions that drive their outputs.
- Use hypothetical figures for the tasks; distinguish source-edition examples and educational models from current prices or individualized decisions.
Questions for reflection
- Does accounting profit match the cash available for the decision?
- Which forecast or discount-rate assumption drives the valuation?
- Is a risk-management action reducing an existing exposure or creating a new one?
Source edition and coverage
The guide follows all twenty main chapters of the linked OpenStax Principles of Finance 2e PDF. It covers that second edition's sequence, including its statistical, forecasting, and spreadsheet material. Hypothetical exercises explain financial models and are not recommendations to buy, sell, borrow, or trade. These are original study explanations and learning tasks. Read the complete book at the official source.
About access & copyright
This page provides book information and study material. Full-text access is provided by the original publisher or authorised source; a listing does not grant permission to republish the book.
Read our Library Access & Copyright policyExplore the contents
Check the chapters covered in this edition.
Visit the official source
See reading, preview or purchase options.
Save for later
Keep this textbook in your saved collection.
Reader ratings & reviews
Share your thoughts
Your review helps other students choose the right resources.
KEEP LEARNING
Your next great read
Business Business
Principles of Microeconomics 3e
View Principles of Microeconomics 3e — book Business
Principles of Marketing
View Principles of Marketing — book Business
Principles of Management
View Principles of Management — book Business
Principles of Macroeconomics 3e
View Principles of Macroeconomics 3e — bookPrinciples of Data Science
Principles of Data Science
View Principles of Data Science — book Business
Organizational Behavior
View Organizational Behavior — book Business
Introductory Business Statistics 2e
View Introductory Business Statistics 2e — book Business
Introduction to Intellectual Property
View Introduction to Intellectual Property — book Business