
Objectives
- To generate a 1 kHz digital square-wave signal and observe the effect of additive noise.
- To relate signal amplitude, noise level, and signal-to-noise ratio to reliable digital decisions.
- To explain and construct a zero-crossing threshold detector using a comparator.
- To evaluate false transitions and identify why hysteresis or a Schmitt-trigger response can improve detection in noisy conditions.
Abstract
This laboratory investigates how additive noise changes the appearance and detectability of a digital waveform. A square wave of approximately ±2.5 V and 1 kHz is produced with the NI ELVIS II+ and Emona Telecoms-Trainer, mixed with a noise-generator output, and displayed on an oscilloscope. The original practical work focused mainly on producing the noisy waveform, while the full learning objective also includes a threshold detector. This expanded report explains both parts. A comparator with a nominal zero-volt reference converts the noisy analog input into a two-level output according to the sign of the input. The simple detector works when the signal has a large noise margin, but noise near the threshold can create multiple false crossings. A detector with hysteresis uses separate rising and falling thresholds and is therefore more robust. The experiment demonstrates that digital information is represented by voltage regions rather than perfectly shaped waves and that reliable recovery depends on signal-to-noise ratio, bandwidth, sampling, threshold choice, grounding, and detector design.
Introduction
A digital signal represents information through discrete logical states, usually called LOW and HIGH. The physical voltage is nevertheless analog: it changes continuously, has finite rise and fall times, and is affected by interference. Noise can enter through thermal agitation, electromagnetic coupling, power supplies, imperfect grounding, quantization, switching circuits, cables, and measuring instruments. When noise is small compared with the separation between valid logic levels, the receiver still identifies the correct state. When it approaches the decision threshold, a receiver may report a false transition or place an edge at the wrong time (National Instruments, n.d.).
A square wave is useful for this experiment because it models a binary sequence with repeated transitions. An ideal square wave contains an infinite series of odd harmonics, but laboratory generators and acquisition systems have limited bandwidth. Its displayed edges are therefore never perfectly vertical. Adding wideband noise makes both plateaus irregular and can cause the waveform to cross the threshold repeatedly. The detector’s task is not to reproduce every analog fluctuation; it must decide which logical state the waveform most likely represents.
Equipment and Safety
- NI ELVIS II+ workstation and compatible Emona Telecoms-Trainer module;
- computer running the required NI software;
- function generator, noise generator, adder, comparator, and oscilloscope facilities;
- male-to-male patch leads and oscilloscope probe connections.
Power should be removed or the trainer placed in a safe state before changing uncertain connections. Signal outputs must not be shorted together. Grounds should share the intended reference point, and the configured voltage must remain within the trainer and acquisition-channel limits. The probe attenuation and software attenuation setting must agree; otherwise, the displayed amplitude will be incorrect.
Signal Requirements and SNR
The intended source is a 1 kHz square wave with levels near +2.5 V and −2.5 V. The phrase “amplitude ±2.5 V” means a 5 V peak-to-peak signal centered on zero, unless the instrument defines amplitude differently. This distinction should be checked on the oscilloscope. Noise is added to produce a stated signal-to-noise ratio of about five. That ratio is incomplete unless the report identifies whether it is based on RMS power, RMS voltage, or peak quantities. For the same impedance, a power SNR is the square of the RMS-voltage ratio:
SNR = Psignal/Pnoise = (Vsignal, rms/Vnoise, rms)².
In decibels, SNRdB = 10 log10(Ps/Pn) = 20 log10(Vs, rms/Vn, rms) for equal impedance. A linear power ratio of five corresponds to approximately 7 dB. The oscilloscope should be used to estimate RMS values with the source and noise observed separately if the hardware permits. Merely selecting a −20 dB noise output does not by itself prove that the final SNR equals five because adder gains and signal definitions also matter.
Procedure: Generating the Digital Signal
The function generator is configured for a square wave at 1 kHz. The output level is adjusted until the oscilloscope confirms levels near ±2.5 V. If a sweep is enabled, it should be disabled for a fixed-frequency measurement; a start frequency of 100 Hz and stop frequency of 1 kHz would create a changing signal rather than the single 1 kHz waveform required by the experiment. The time base should display several cycles. Because the period is 1 ms, a horizontal scale near 0.2–0.5 ms per division is generally convenient (National Instruments, n.d.).
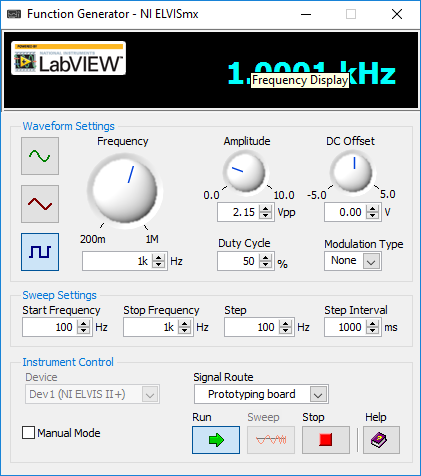
Figure 1: Function-generator configuration used to produce the nominal 1 kHz square wave.
Procedure: Adding Noise
The function-generator output is connected to Input A of the adder. The selected noise-generator output is connected to Input B. The links should be installed exactly as required by the trainer because an incorrect reference or gain setting will change the result. Before combining the sources, the clean square wave and noise should ideally be measured separately. The adder output is then connected to the oscilloscope.
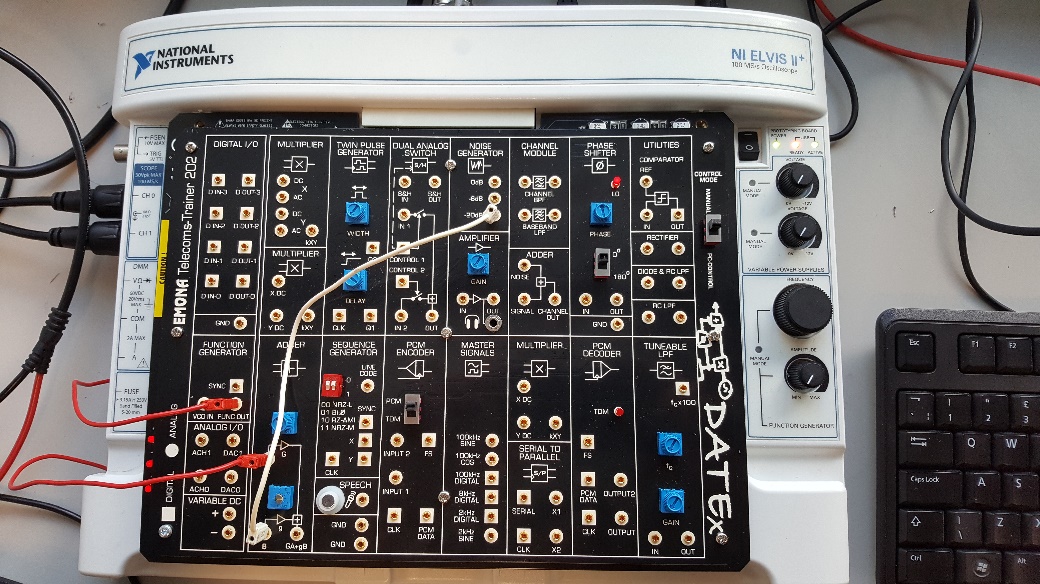
Figure 2: Function-generator output connected to the adder together with the noise-generator output.
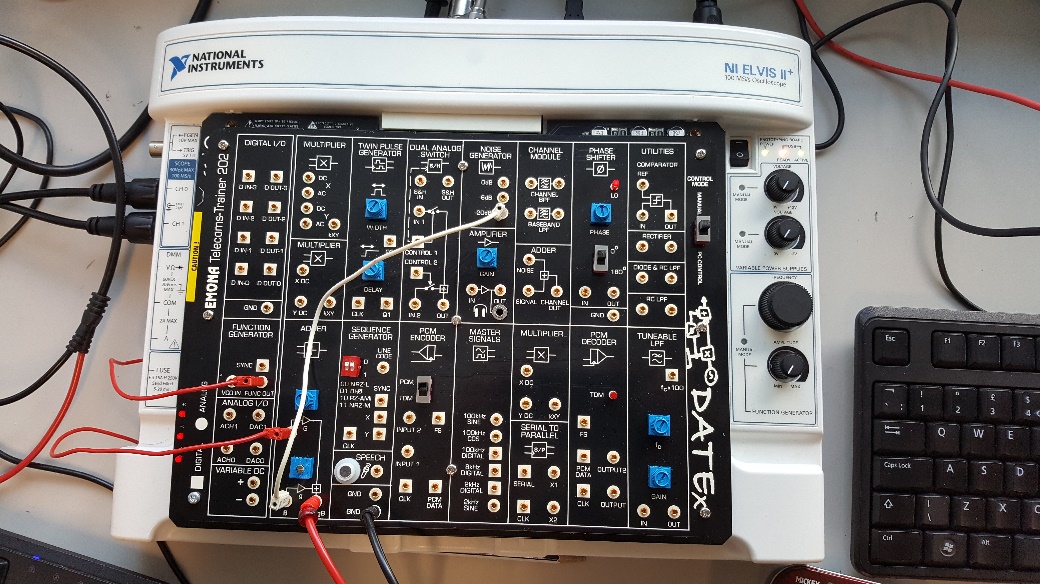
Figure 3: Oscilloscope Channel 0 connected to the noisy-signal output.
Building the Threshold Detector
A comparator produces one output state when its non-inverting input is above the voltage on its inverting input and the opposite state when it is below. For a zero-crossing detector, the noisy signal is applied to one input and ground is used as the reference on the other. The exact output polarity depends on which comparator input receives the signal. A rising transition is expected when the input passes through the threshold in the selected direction.
The reference does not have to be zero. For a waveform whose valid levels are approximately ±2.5 V, zero is the midpoint and provides symmetric noise margins. If the signal has a DC offset or asymmetric logic levels, another threshold may be more appropriate. The detector output should be viewed on a second oscilloscope channel at the same time as the noisy input so that crossing time, false edges, and propagation delay can be compared.
Why Hysteresis Matters
A basic comparator changes state whenever the input crosses one threshold. Noise around zero may make the input cross that level several times during one intended transition. A Schmitt trigger introduces hysteresis: the signal must cross an upper threshold to cause one transition and a lower threshold to cause the reverse transition. National Instruments’ trigger-detection documentation similarly explains that hysteresis prevents noise from producing a false trigger by requiring the signal to move beyond the threshold region before another crossing is recognized (National Instruments, n.d.).
The trade-off is that hysteresis changes the exact switching level and therefore slightly alters measured edge time. Its size should exceed typical near-threshold noise but remain small compared with the separation of valid logic levels. Too little hysteresis gives inadequate protection; too much can delay detection or reject low-amplitude signals.
Results and Discussion
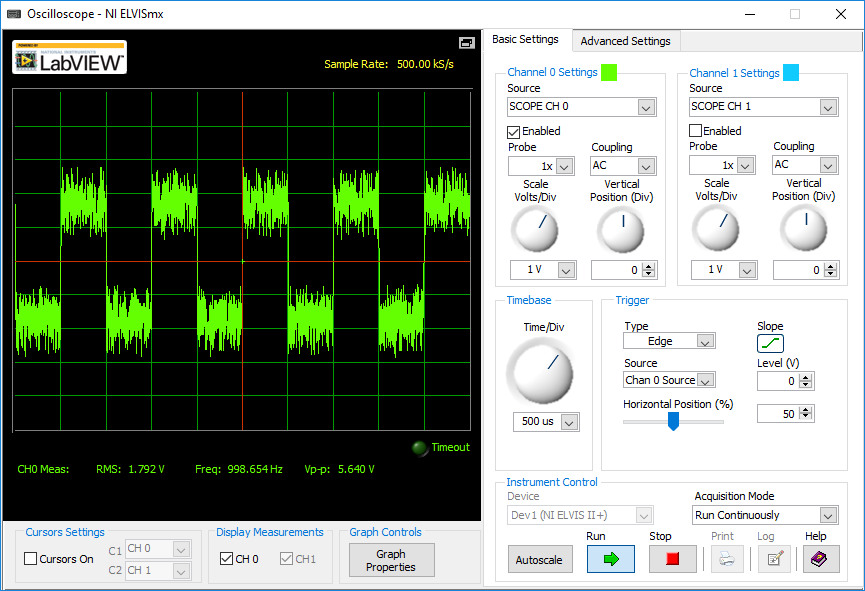
Figure 4: Observed square wave after additive noise, reported with an approximate SNR of five.
The displayed waveform retains recognizable positive and negative states, but both plateaus and edges are distorted. This confirms that noise changes the instantaneous voltage without necessarily destroying the encoded binary information. At the center of each plateau, the distance from zero is large, so a zero-threshold decision is reliable. The greatest risk occurs near a transition because the ideal waveform passes through the decision level and the noise can move the measured voltage above and below it.
The quality of the result should be evaluated with more than visual inspection. The clean frequency should be measured, the positive and negative levels should be recorded, RMS noise should be estimated, and the output transition count should be compared with the expected 2,000 crossings per second for a 1 kHz square wave if both rising and falling crossings are counted. Extra transitions indicate false triggers. Missing transitions can result from insufficient bandwidth, an inappropriate threshold, saturation, low sampling rate, or poor wiring.
Sampling also affects interpretation. A system must sample fast enough to represent the waveform and its edge timing. The Nyquist criterion addresses the highest frequency component retained, not merely the 1 kHz repetition rate. Since a square wave contains harmonics, a sampling rate only slightly above 2 kHz cannot preserve its shape. Limited analog bandwidth removes harmonics and rounds the edges, even if the fundamental frequency is measured correctly.
Sources of Experimental Error
- The amplitude setting may be interpreted as peak, peak-to-peak, or level depending on the instrument.
- The SNR may be quoted without an RMS or power definition.
- A sweep setting may unintentionally vary the frequency.
- Probe attenuation, channel scaling, grounding, or adder gain may be incorrect.
- The oscilloscope may have insufficient sample rate, record length, or bandwidth.
- A zero-hysteresis comparator may count noise as repeated crossings.
- The noise source may be non-Gaussian or bandwidth-limited, so one number cannot describe every effect.
Conclusion
The experiment demonstrates how a clean digital waveform becomes a noisy analog signal and how a threshold detector recovers logical states. A 1 kHz square wave mixed with noise remains detectable when its level separation is large compared with the noise, but uncertainty concentrates at transitions. A comparator referenced to zero can provide basic detection, while hysteresis improves immunity to repeated false crossings. Accurate conclusions require clear amplitude and SNR definitions, direct measurements, correct bandwidth and sampling, and simultaneous observation of input and detector output. The four figures document the physical setup and observed signal; the expanded analysis connects those observations to the engineering principles that determine reliable digital communication.
Reference List
National Instruments. “Trigger Detection for N Channel VI.” LabVIEW Programming Reference Manual, updated 4 February 2026. https://www.ni.com/docs/ar-OM/bundle/labview-api-ref/page/vi-lib/measure/mamon-llb/trigger-detection-for-n-channel-vi.html
National Instruments. “How Can I Display the Amplitude and Frequency of a Signal?” https://knowledge.ni.com/KnowledgeArticleDetails?id=kA00Z0000019L33SAE
Cite This Work
To export a reference to this article please select a referencing stye below:

Academic Master Education Team is a group of academic editors and subject specialists responsible for producing structured, research-backed essays across multiple disciplines. Each article is developed following Academic Master’s Editorial Policy and supported by credible academic references. The team ensures clarity, citation accuracy, and adherence to ethical academic writing standards
Content reviewed under Academic Master Editorial Policy.





