Introduction
The most prevalent dangerous illness is thought to be heart attacks. Medical practitioners perform numerous surveys on heart disease to acquire data on the illnesses, symptoms, and course of the condition [1]. Since cardiovascular disease is the most predictable disease in the world, it is a major worry for the medical sector in today’s heart disease research. Scaling down small and amazing gadgets that may be utilised while calculating electrocardiogram (ECG) signals, order models that can increase or improve the precision of heartbeat variations from the norm can be applied [2]. Cardiovascular diseases (CVD) are the main killers on a global scale. Heart disease already claims the lives of over seventeen million people annually, and by 2030, that number is projected to rise to over twenty-three million. Even though CVDs are generally preventable, in low- and middle-income countries, CVD mortality has increased at an astonishingly quick rate over the past ten years. The huge proportion of persons with high cardiovascular risk who go untreated is one cause causing this increase [3][4].
The most common cause of CVD worldwide is coronary artery disease (CAD). The early stage of coronary artery disease (CAD) involves plaque development, which is composed of cholesterol deposits in the coronary artery walls. These plaques reduce artery width, which reduces blood flow. The heart muscle does not receive enough blood [5]. The electrocardiogram (ECG) is viewed as a graph that records any potential electrical changes brought on by the heart muscle contracting. The ECG signal is analysed to find signs of heart disease. The ECG can be used to evaluate the condition of the heart and offer a more accurate disease diagnosis. The surface ECG signal accumulates spatiotemporally as a result of the electric potential generated by the action potential’s activation of myocardial fibres as it travels along the conduction pathways of the heart and the contractile myocardium [6][7]. All the documents strongly support the idea that physical inactivity (PI) is one of the key factors influencing cardiovascular complications and that the risk of ischemic heart disease (IHD) is elevated in particular in such individuals, despite minor differences between the various recommendations. Ischemic heart disease (IHD) is the leading cause of death worldwide, killing more men than women.
Innovation in cardiovascular disease prevention and treatment has recently come to a halt. The study of the effects of ischemia in vivo in humans is commonly impacted by a range of methodological problems and is hampered by small patient cohorts due to the invasiveness of the requisite acquisitions and the lack of suitable individuals. There aren’t many databases of electrocardiogram (ECG) recordings that are freely accessible and were created specifically for ischemia studies [8-10]. Each SPECT MPI scan was broken down into six segments by a site doctor, including the anterior, posterior, inferior, lateral, apical, and septal walls. By measuring the number of segments with reversible or partially reversible perfusion anomalies, the degree of ischemia was calculated. No to mild ischemia was defined as having 0 to 2 ischemic segments, and moderate to severe ischemia as having three or more segments [11]. Along with left ventricular anomalies, neovascularization in heart tissue after an ischemic event may be hampered in SCH. This could, therefore, hasten the aberrant remodelling of the heart that results in heart failure [12]. In recent years, practitioners have enhanced their use of computer technology to improve support for decision-making. In the healthcare industry, machine learning is being used more and more as a tool to aid with patient diagnosis. Machine learning is an analytical technique that is employed when a task is complicated and difficult to program, such as transforming medical records into knowledge, forecasting pandemics, and assessing genetic data [13].
Literature Review
In 2022, Nagavelli et al. [14] presented a succinct analysis of the different machine-learning techniques based on the detection of heart disease. First, heart disease is predicted using a weighted version of Nave Bayes. The second was automatic and looked at the properties of the frequency domain, temporal domain, and information theory to localise and identify ischemic heart disease. The performance measures of precision, accuracy, f1-measure, and recall were studied for four different kinds of machine learning (ML) models.
In 2022, Caesarendra et al. [15] proposed a Deep Learning (DL) model-based method for automatically classifying four different kinds of ECG readings. We selected and used four different types of ECG signals from the PhysioNet open-source database. Using a Deep Learning (DL) method known as a Convolutional Neural Network (CNN), ECG data from four different classes—normal, sudden death, arrhythmia, and supraventricular arrhythmia—were identified and predicted in this exploratory study. The classification and prediction process includes pulse extraction, picture warping, training data, and testing procedures.
In 2020, Kibel et al. [16] developed the most significant research linking oxidative stress to vascular disease and functioning. This focused on the role of oxidative stress in atherosclerosis, endothelial dysfunction, and other pathogenetic processes and mechanisms that trigger the genesis of ischemic heart disease.
In 2019, Hasan and Bhattacharjee [17] demonstrated how to use a one-dimensional deep convolutional neural network (CNN) to categorise different heart illnesses, with a modified ECG signal as the network’s input signal. After each ECG signal underwent Empirical Mode Decomposition (EMD) decomposition, higher order Intrinsic Mode Functions (IMFs) were merged to provide a modified ECG signal. The method was applied to three publically accessible ECG databases, and it was found to have higher classification accuracy than other techniques. The MIT-BIH, St. Petersburg, and PTB datasets yield maximum accuracy values of 97.70%, 99.71%, and 98.24%, respectively, for the suggested technique.
In 2021, Jahmunah et al. [18] employed a Convolutional neural network (CNN) and unique Gabor CNN models to build an automated system (AS) for the automatic classification of ECG data into normal, CAD, myocardial infarction (MI), and congestive heart failure (CHF) classes. Utilising weight balancing, the uneven dataset was made balanced. More than 98.5% classification accuracy for the 4-class was attained by the CNN and Gabor CNN models, respectively. Congestive heart failure, coronary artery disease, and normal circumstances are categorised. Doctors could utilise the proposed method to screen for CVDs using ECG signals because it was designed to be validated with a larger database.
In 2019, Isola et al. [19] studied the connection between gingival health, periodontitis, CAD, or combined illnesses and blood and salivary levels of vitamin C and antioxidants. The clinical and periodontal characteristics, serum, and saliva samples were collected from 36 patients with periodontitis, 35 patients with CAD, 36 patients with periodontitis and CAD, and 36 healthy controls. Levels of vitamin C, antioxidants, and C-reactive protein (hs-CRP) were assessed using an easily accessible assay. Patients with CAD and periodontitis with CAD reported lower serum and salivary vitamin C levels compared to healthy people and periodontitis patients.
In 2019, Chen et al. [20] suggested adopting a novel two-step prediction architecture to interpret ECG signals. In this architecture, a global classifier would identify severe abnormalities (red alarms) by comparing the signal to a global reference model. The suggested method has a classification accuracy of 96.6% and provides a unique predictive analysis feature by delivering caution warning messages about the elevated risk of cardiac problems to take preventative measures in accordance with a doctor’s recommendation. However, the methodology that was developed was universal and could be used for a variety of biological signals, including EEG, Pleth, and PPG. The main goal of this technology was to deliver high-quality healthcare for the elderly and heart patients at high risk.
In 2021, Satheeskumaran et al. [21] explained that before performing neuro-fuzzy-based CHD risk prediction, pre-processing and HRV (Heart rate variability) feature extraction were finished. Pre-processing was used to remove the white Gaussian noise simulation used to simulate the high-frequency noise. The real-time ECG signal capture, pre-processing, and HRV feature extraction are completed using NI LabVIEW and a DAQ board. For 30 seconds, an ECG signal was obtained in both smokers and non-smokers. The HRV recorded signals are separated into normal and CHD-risky patients using a neural fuzzy classifier. The classification performance of the neuro-fuzzy classifier was compared to that of the ANN, KNN, and decision tree classifiers.
In 2021, Velusamy and Ramasamy [22] showed a successful CAD diagnosis using a novel heterogeneous ensemble technique that used the three foundation classifiers: K-Nearest Neighbour, Random Forest, and Support Vector Machine. Using the ensemble voting technique, which is based on average voting (AVEn), majority voting (MVEn), and weighted-average voting (WAVEn), the output from the basic classifiers was merged to forecast CAD. The proposed ensemble approach is developed using five features selected based on the feature selection criteria. The importance and performance of the approach were evaluated using the Z-Alizadeh Sani dataset. Because of its robustness in reliably distinguishing CAD patients from healthy ones with high precision, the WAVEn algorithm can be used to create a decision support system for early CAD diagnosis.
In 2021, Li et al. [23] developed a novel multi-modal method for the prediction of CVDs based on both PCG and ECG features. Create standard neural networks to extract ECG and PCG (phonocardiogram) deep-coding features, respectively. The genetic algorithm was used to screen the combined features to get the best feature subset. Then, classifications are put into practice via a support vector machine. The strategy outperformed single-modal methods and alternatives, according to experimental results. The method achieves an AUC value of 0.936 when using ECG and PCG multi-modal features.
2.1 Problem Statement
Table 1. Research gap of Existing works
| Author | Aim | Technique Used | Advantage | Disadvantage |
| Caesarendra et al. [15] | A machine learning system that automatically classified four different types of ECG readings using deep learning | DL, CNN | Enhanced efficiency Accuracy attained of 95% Automatic feature extraction and learning Processing images quickly | Image resized and altered the consistency of images, including their size, brightness, and clarity, was influenced by their orientation. Building a successful activity recognition system requires more time. |
| Hasan et al. [17] | A modified ECG signal is sent as an input signal to the network to categorize various cardiac conditions using a one-dimensional DCNN. | IMFs, EMD | Accuracy was nearly at its highest level at 99.71% Did not call for a fixed set of mathematical operations | Extreme sensitivity to noise |
| Jahmunah et al. [18] | To assess how well two deep models perform when used to automatically classify ECG data into the normal, CAD, MI, and CHF classes | Gabor CNN | The generated Gabor CNN model utilized fewer weights and could, therefore, be trained more quickly. Decreased computational complexity while maintaining 98.5% accuracy. | A larger dataset was required to train and test the Gabor CNN model. The currently used invasive diagnostic procedures for CVDs, such as blood testing and cardiac catheterization. |
| Satheeskumaran et al. [21] | Preprocessing of real-time ECG signals and neural fuzzy-based CHD risk prediction | Neural fuzzy classifier, HRV | Less challenging because the observed signal did not need to be converted into the frequency domain. Accuracy performance was 96.5%. | It took a longer time to calculate. Threshold problem arise |
| Velusamy et al. [22] | To create a group of heterogeneous classifiers that can be used to predict and detect CAD sooner. | K-NN, RF, SVM | 98.97% accuracy, 100% sensitivity, 96.3% specificity, and 98.3% precision, respectively. Reduced classification time and increased CAD prediction accuracy. | Overlapped with some input data occurred occasionally. In K-NN, the prediction stage could be slow. |
| Li et al. [23] | Create a model that seamlessly integrates PCG and ECG to precisely predict CVDs. | PCG | SN of 0.903, SP of 0.845, F-score of 0.874, ACC of 0.873, and AUC of 0.936 were the performance metrics. A genetic algorithm was used in feature dimension | Used a small number of datasets Surgery patients were in danger of infection because of the unproductive environment. |
Proposed Methodology
The proposed model for the prediction of ischemic heart disease using ECG signals includes the following stages:
3.1 Data collection:
The PTB-XL ECG dataset consists of 21837 clinical 12-lead ECGs, each lasting 10 seconds, from 18885 patients. Up to two cardiologists annotated the raw waveform data, potentially assigning different ECG statements to each record. The 71 different ECG statements, which encompass diagnostic, form, and rhythm statements, are compliant with the SCP-ECG standard. We provide appropriate splits into training and test sets to ensure the comparability of machine learning algorithms trained on the dataset. This transforms the dataset into a rich resource for the training and assessment of automatic ECG interpretation algorithms when combined with substantial annotation. Extensive metadata on demographics, infarction features, likelihoods for diagnostic ECG statements, and annotated signal parameters round out the collection. https://www.physionet.org/content/ptb-xl/1.0.1/
3.2 Pre-processing:
The raw ECG signal data will undergo pre-processing to eliminate noise and artefacts and to guarantee data consistency. Techniques for pre-processing include sampling, windowing, and noise reduction (notch filtering).
Remove Noise Artifacts
The quality and dependability of data can be improved by removing noise artefacts from signals, which is an important step in signal processing. Unwanted changes or disturbances, sometimes known as noise artefacts, have the ability to obfuscate or distort a signal’s underlying information. They may be introduced due to a variety of factors, including electromagnetic interference, sensor errors, interference, and other sources of undesired signal components.
Sampling
To solve the problem of imbalanced aggregation of data samples, it may be useful to employ a data preprocessing technique called sampling. It is applied to deal with problems caused by an uneven distribution of data in a certain data set. The major objective of this sampling approach is to select a sample of raw, unstructured data from the gathered sets that is indicative of the overall number of data records. Using this method, a smaller part of the data can be mapped to the entire data set. Two elements that affect sample selection are the size and quality of the data sample.
Windowing
Windowing is a technique used to analyse speech signals that highlight particular aspects of the speech signal in each frame by multiplying the speech signal waveform by a temporal window function. In order to smooth the signal and avoid signal discontinuity brought on by spectral distortion during the framing stage, the signal at the beginning and end of each frame is reduced to zero using the windowing approach. The signal at the beginning and end of the frame, however, can occasionally be altered when windowing techniques are used. Multiplying the speech wave by the window function has two significant consequences. To prevent a dramatic change at the endpoints of a frame, the amplitude at both ends of the time period must first be gradually reduced. The second effect is the Fourier transform of the window function and the voice spectrum. Therefore, while choosing the window function to be utilised to limit spectral distortion, two requirements must be met: high-frequency resolution and minimal spectral leakage.
Noise Removal (Notch filtering)
The signal processing technique known as “notch filtering” removes specific, constrained frequency bands, also referred to as “notches,” from a signal. When there are unwanted narrowband interference or noise components present at specific frequencies, this technique is typically applied. With notch filters, these undesired frequencies can be diminished or eliminated while preserving the majority of the signal.
3.3 Feature extraction:
The pre-processed data will be used to extract pertinent features from the ECG signals. Common characteristics utilised in ECG analysis for predicting ischemic heart disease include:
Time Domain Features
Root Mean Square
A number of academic fields, including mathematics, physics, engineering, and statistics, regularly employ the mathematical concept of root mean square (RMS) to indicate the size or intensity of a set of values. It is especially beneficial when dealing with time-varying numbers or signals. Utilising the RMS value is one method for determining the “effective” or “average” value of these several quantities.
Hjorth Parameter
Hjorth parameters are a set of mathematical descriptors that are extensively used in the analysis of time-series data, especially in the areas of neuroscience and neurophysiology. Danish neurophysiologist Bjorn Hjorth developed the electroencephalography (EEG) and electromyography (EMG) procedures, which are used to measure electrical activity in the brain and muscles, respectively, as a way to quantify certain characteristics of signals obtained from these techniques.
Frequent Domain Features
Power Spectral Density
Power spectral density (PSD), a fundamental concept in signal processing and engineering, describes how a signal’s power is divided throughout its several frequency components. The frequency content of signals, including audio, video, time-series data, and others, is widely examined and described using this technique. The use of PSD is essential in a number of fields, including telecommunications, audio processing, image processing, and the study of natural phenomena.
Spectral Entropy
A notion known as spectral entropy can be used to gauge the complexity or unpredictability of a signal’s power spectral density (PSD). It provides information on the distribution of power across different frequency components in a signal, much like how entropy assesses randomness in probability distributions. In several fields, such as signal processing, neurobiology, and audio analysis, it is essential to comprehend the complexity of frequency content; here is where spectral entropy is most useful.
Relative/ Band power
Relative power, commonly referred to as band power, is a term used in signal processing and neurology to describe the distribution of signal power over different frequency bands within a particular signal’s power spectral density (PSD). The objective of relative power analysis is to determine the percentage of total power that is present within specific frequency bands or ranges relative to the total power across all frequencies.
Time transform-based features
Stockwell Transform
The Stockwell transform, commonly known as the S-transform, is a time-frequency analysis technique that analyses and characterises signals simultaneously in the time and frequency domains. It is a useful tool for analysing the frequency content of signals that are not stationary and whose frequency components change over time. The Stockwell transform delivers a precise and localised representation of the signal’s spectrum content, making it particularly well-suited for applications like signal processing, audio analysis, and geophysics.
Connectivity features
Phase Locking Value
The degree to which two or more time-series signals are phase-synchronized or connected is quantified by a statistic called the Phase Locking Value (PLV). In fields like neuroscience, physics, and engineering, it is widely used to look at the synchronicity of oscillatory activity across several sources or channels.
3.4 Feature Selection
Salp Swarm Algorithm
A novel optimisation technique called the Salp Swarm Algorithm (SSA) was created to deal with various optimisation problems. They also move similarly to jellyfish, have bodies with a high water content, and have tissues that are similar to those of jellyfish. They move by contracting as water is pumped through their Jello-like bodies, which changes where they are. The salp chain, a swarm behaviour used by salps in the oceans, may help salps travel more quickly by using quick, synchronized shifts and feeding. The scientists built a mathematical model of the salp chains based on this behaviour and then tested it using optimisation problems. SSA initially separates the population into two groups: the leader and the follower. The front salp and the remaining salp, respectively, serve as the chain’s leader and followers. In the x-dimensional space, where x represents the variables in the problem, and n represents the search space, the position of the salps is determined. The target of the swarm is revealed when these salps search for a food supply. The position needs to be updated often; hence, the sales leader does so by using the following equation:
Here, the location of the front-runner within a measurement is shown. If the food supply is in this measurement, then the higher and inferior limits are, respectively. To keep the exploration interplanetary open, they are shaped at chance in the [0, 1] range. Additionally, the parameter is a vital constant in this method because of how it balances the exploration and exploitation phases. Its calculation is as follows: Where the letters stand for the current iteration and the maximum number of iterations, respectively. The SSA first updates the location of the leader before beginning to update the position of the followers.
Honey Badger Algorithm
A mammal with fluffy black and white fur known as the honey badger is frequently seen in Africa’s semi-deserts and rainforests. A honey badger finds its meal by moving slowly and consistently while using its ability to detect mice. Through excavating, it begins to locate the prey’s general location before grabbing it. It can make up to fifty holes in a day in an area of at least forty kilometres to find food. Although honey is enjoyed by honey badgers, it is difficult to locate beehives. However, honey-guide, a bird, can find the hives but is unable to obtain honey. These events result in a partnership between the two, where the bird directs the badger to beehives and uses its large claws to help it open hives. Both then reap the benefits of their cooperative efforts.
Motivation
Honey Badger Algorithm (HBA) simulates honey badger foraging behavior. The honey badger either smells and digs for food sources or follows honeyguide birds. In the first instance, the mode was “digging,” whereas in the second, “honey.” Using its sense of smell, it can roughly locate the prey in the previous phase. Once there, it wanders about the prey to find the best spot for digging and capturing it. In the latter phase, honey badgers use the honeyguide bird as a direct beehive locator.
4.1 Arithmetical Pattern
HBA is separated into two phases: the “digging phase” and the “honey phase”. Theoretically, HBA is a global optimization algorithm because it includes both the exploration and exploitation phases.
Step 1: Initialization: D1 is a random number between 0 and 1. The honey badger position refers to a potential solution in a population of X, which is the upper and lower bounds.
Step 2: Determining force (E): The prey’s level of focus and the distance between it and the honey badger both affect Force. Represents the prey’s smell intensity; if the smell is strong, the motion will be quick, and vice versa.
Step 3: Upgrade solidity component: The seamless transition from exploration to exploitation is achieved by controlling time-varying randomness with the Solidity component ().
Step 4: Leaving behind the local optimum: To leave local optima regions, take this step and the two ones after it. In this situation, the suggested algorithm employs a flag H that modifies search direction to provide high opportunities for agents to thoroughly explore the search field.
Step 5: Updating the positions of the agents: As previously mentioned, the “digging phase” and the “honey phase” are the two distinct phases of the HBA position update process (). It is better explained as follows.
Step 5.1: Digging Phase: A honey badger executes actions resembling a cardioid shape during the digging phase. Eqn. (10) can be used to simulate the cardioid motion.
Here is the position of prey: 1. The honey badger’s capacity to obtain food refers to the distance between the target and the badger. Are the three different random numbers between 0 and 1.
Be a random number between 0 and 1. A honey badger strongly relies on the prey’s smell Force E during the digging phase, as well as the distance between the badger and the prey and the time-varying search influence factor. Additionally, a badger may experience any disruption F while engaged in digging, which enables it to locate its prey in even better detail in Eqn (9)
Step 5.2: Honey Phase: The following equation can be used to mimic the situation where a honey badger follows a honeyguide bird to a beehive.
Denotes the new position of the honey badger, which is the prey location, H, and is determined using Eqs (9) and (11). From Eq. (6), it can be shown that a honey badger searches near the location of the that has already been discovered based on distance information.
Due to its exploration and exploitation phases, HBA is theoretically viewed as a global optimization method. The minimum number of operators that need to be modified is used in HBA to make it simple to implement and comprehend. It should be noted that the computational complexity of the suggested method denotes the maximum number of iterations, the population size or number of solutions, and the number of choice variables. As a result, the total complexity, which takes into account the goal function specified in Equations (10) and (12), is determined as.
Result And Discussion
5.1 TP, FP, FN, TN Classification
True Positive: “True positive” results are those in which the model correctly identified the positive class at the time of data acquisition. Genuine negatives and genuine positives can be distinguished from one other by the fact that the model correctly predicted the negative class, making each of them equally valid.
True Negative: A result is considered “true negative” when the model accurately foresees the negative class as negative.
False Positive: When the model forecasts the positive class incorrectly, the result is considered negative. Additionally, false negatives can occur when the model predicts the negative class accurately.
False Negative: A test result that erroneously suggests the illness is absent when it is actually present and declares the condition under investigation to be non-existent.
5.2 Performance Metrices
Some of the confusion matrix measures used to evaluate performance are precision, accuracy, specificity, sensitivity, Re-call F-Measure, MCC, NPV, FPR, and FNR. This section presents the equation that is used to calculate metrics.
Accuracy
By comparing the percentage of cases that were correctly predicted to all other occurrences, reliability is assessed.
Precision
Since it quantifies the ratio of favourably expected positive instances to all test findings, precision is a critical indicator of how accurately the positive chemicals are predicted.
Sensitivity
Divide the total positives by the percentage of accurate positive forecasts to obtain the sensitivity value.
Specificity
The percentage of difficulties that were accurately anticipated in all negative findings is known as the degree of specificity.
Re- call
Recall is a statistic that counts the number of accurate positive predictions that were made out of all possible positive predictions. Recall shows missing positive predictions as opposed to precision, which only examines the accurate positive predictions among all positive predictions.
F- Measure
To properly identify each information bit and guarantee that each class only includes one type of data item, the F-Measure integer was developed.
Matthew’s correlation coefficient (MCC)
The picture below shows the correlation measurement for the binary two-by-two variable MCC.
Negative Prediction Value (NPV)
NPV assesses the efficacy of a diagnostic test or similar quantitative indication.
False Positive Ratio (FPR)
Negative events that were mistakenly classified as positive are known as false positives, and the proportion of these occurrences is calculated by dividing the total number of false positives by the total number of negative events.
False Negative Ratio (FNR)
The likelihood that a true positive will not be detected by the test is known as the “miss rate,” also referred to as the “false-negative rate.”
5.3 Overall Performance in Sensitivity, Specificity, Accuracy
Table 2: Overall Values in Sensitivity, Specificity, Accuracy
| Sen | Spec | |
| Proposed O-ANN | 0.949787 | 0.987447 |
| ANN | 0.919469 | 0.979867 |
| Decision Tree | 0.719564 | 0.929891 |
| AdaBoost | 0.528659 | 0.882165 |
| KNN | 0.801516 | 0.950379 |
| Random Forest | 0.783041 | 0.94576 |
The tabulated findings showcase the outcomes of diverse models for the prediction of ischemic heart disease, which encompass a proposed O-ANN, ANN, Decision Tree, Ada Boost, KNN, and Random Forest. Sensitivity (Sen) and Specificity (Spec) serve as the key indicators to assess the performance of these models. Impressively, the Proposed O- ANN model attains the highest sensitivity (0.949787), indicating its potential to accurately detect a considerable proportion of true positive cases. Additionally, it exhibits the highest specificity (0.987447), highlighting its ability to precisely identify true negative cases. The ANN model also demonstrates relatively elevated values for sensitivity (0.919469) and specificity (0.979867). However, the Decision Tree, AdaBoost, Random Forest, and KNN models achieve slightly inferior performance scores. Figure 1 illustrates the graphical representation of the performance analysis.
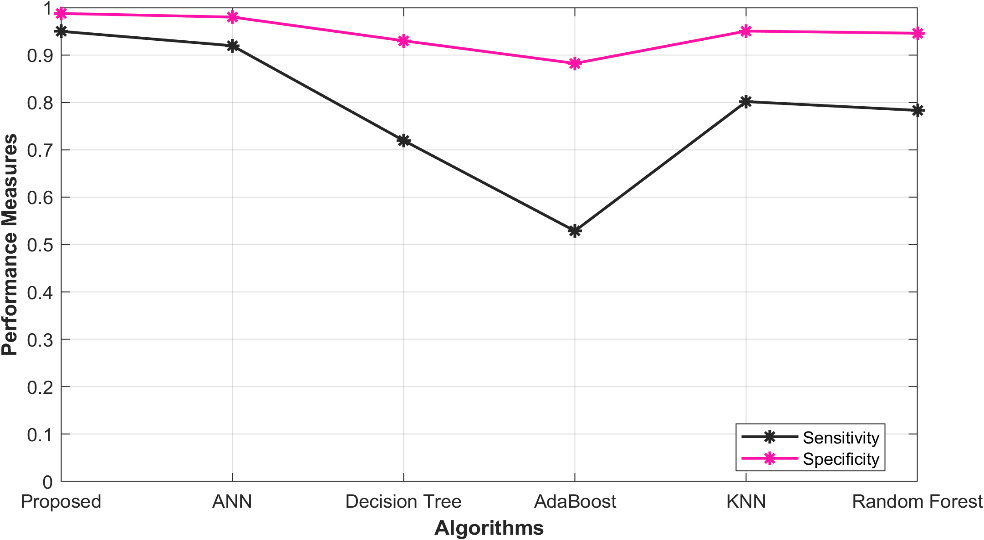
Figure 1: Performance analysis in Sensitivity, Specificity
5.4 Overall Performance in Precision, Accuracy
Table 3: Overall Performance in Precision, Accuracy
| Acc | Precision | |
Proposed O-ANN | 0.979915 | 0.949787 |
ANN | 0.967788 | 0.919469 |
Decision Tree | 0.887826 | 0.719564 |
AdaBoost | 0.811464 | 0.528659 |
KNN | 0.920606 | 0.801516 |
Random Forest | 0.913216 | 0.783041 |
The following table 3 presents the results of an evaluation of various models for the prediction of ischemic heart disease. These models include the O-ANN, ANN, Decision Tree, Ada Boost, KNN, and Random Forest. The performance of these models is assessed using the metrics of Accuracy (Acc) and Precision. The proposed O-ANN model achieves the highest Accuracy score, 0.979915, indicating its superior ability to correctly identify true positive cases. Furthermore, it exhibits the highest Precision score, 0.949787, suggesting its exceptional proficiency in accurately identifying true negative cases. The ANN model also demonstrates relatively high values for Accuracy (0.967788) and Precision (0.919469), while the Decision Tree, AdaBoost, Random Forest, and KNN models display slightly lower performance scores. A visual representation of the performance analysis graph is provided in Figure 2.
. 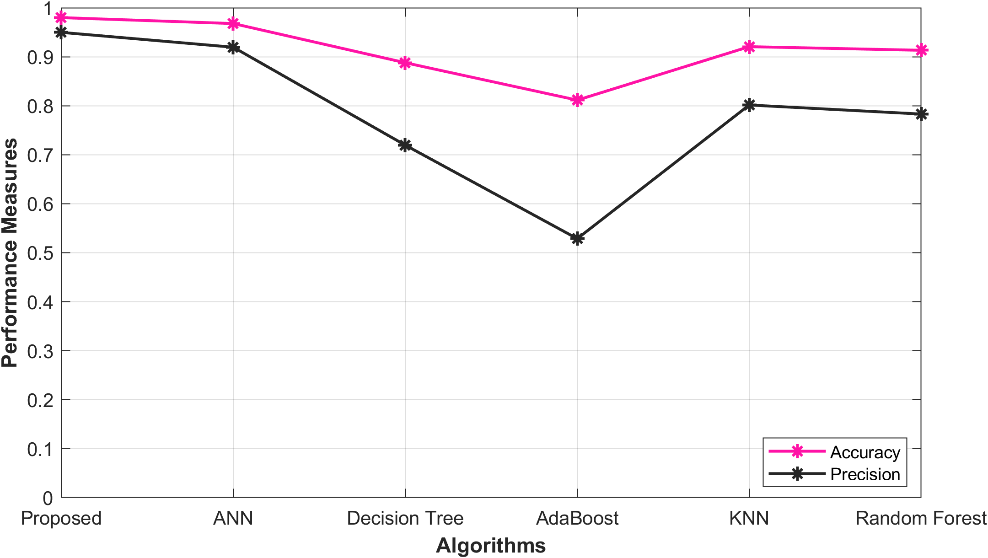
Figure 2: Performance analysis in Accuracy, Precision
5.5 Overall performance in Recall, NPV
Table 4: Overall performance in Recall, NPV
| Recall | NPV | |
| Proposed O-ANN | 0.949787 | 0.987447 |
| ANN | 0.919469 | 0.979867 |
| Decision Tree | 0.719564 | 0.929891 |
| AdaBoost | 0.528659 | 0.882165 |
| KNN | 0.801516 | 0.950379 |
| Random Forest | 0.783041 | 0.94576 |
Table 4 presents an analysis of different models for predicting ischemic heart disease via the evaluation of their performance. Specifically, the models under consideration include the proposed O-ANN, ANN, Decision Tree, Ada Boost, KNN, and Random Forest. The models were assessed based on their Recall and NPV values, which provide insight into their predictive capabilities. The proposed O-ANN model exhibited the highest Recall value (0.949787), implying that it is proficient in identifying true positive cases with a high degree of accuracy. Additionally, this model demonstrated the highest NPV value (0.987447), indicating its ability to accurately identify true negative cases. The ANN model also received relatively high Recall (0.919469) and NPV (0.979867) scores, while the Decision Tree, AdaBoost, Random Forest, and KNN models exhibited slightly lower performance scores. A graphical representation of the performance analysis is depicted in Figure 3.
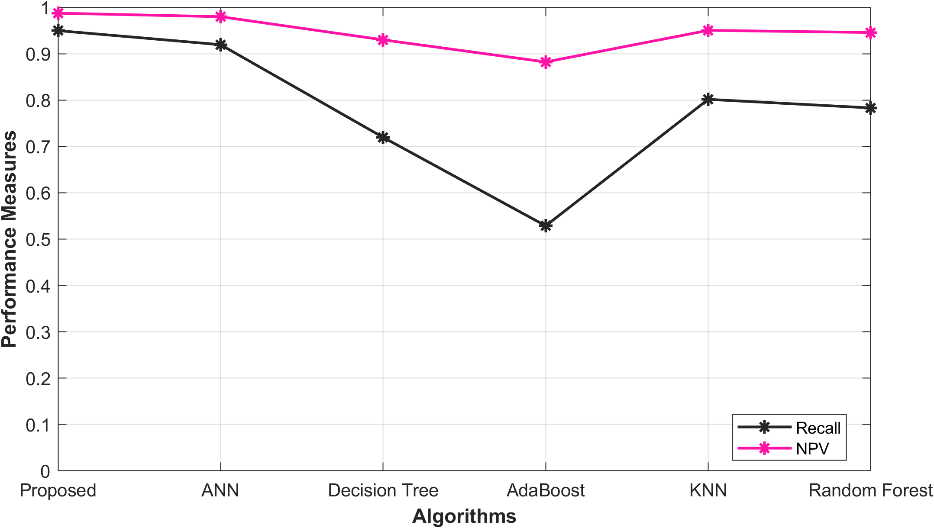
Figure 3: Performance analysis in Recall, NPV
5.6 Overall performance in FPR, FNR
Table 5: Overall performance in FPR, FNR
| FPR | FNR | |
| Proposed O-ANN | 0.012553 | 0.050213 |
| ANN | 0.020133 | 0.080531 |
| Decision Tree | 0.070109 | 0.280436 |
| AdaBoost | 0.117835 | 0.471341 |
| KNN | 0.049621 | 0.198484 |
| Random Forest | 0.05424 | 0.216959 |
The evaluation of various models for predicting ischemic heart disease is presented in Table 5. These models include the proposed O-ANN, ANN, Decision Tree, Ada Boost, KNN, and Random Forest. The effectiveness of these models is evaluated based on the values of FPR and FNR. The Proposed O-ANN exhibits the lowest FPR (0.012553), indicating its ability to accurately identify a low proportion of false positive and negative cases. Moreover, it demonstrates the lowest FNR (0.050213), indicating its proficiency in correctly identifying true negative cases. The ANN model displays relatively low FPR (0.020133) and FNR (0.080531) values, while the Decision Tree, AdaBoost, Random Forest, and KNN models achieve slightly higher performance scores. The graph depicting the performance analysis is presented in Figure 4.
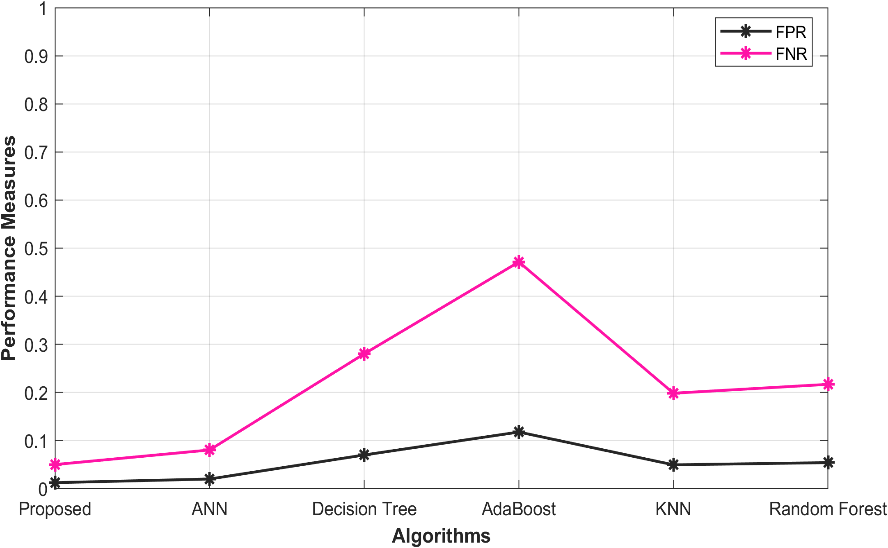
Figure 4: Performance analysis in FPR, FNR
5.7 Overall Performance of F- Measure, MCC
Table 6: Overall Performance of F- F-Measure, MCC
| F-Measure | MCC | |
| Proposed O-ANN | 0.949787 | 0.937234 |
| ANN | 0.919469 | 0.899337 |
| Decision Tree | 0.719564 | 0.649455 |
| AdaBoost | 0.528659 | 0.410824 |
| KNN | 0.801516 | 0.751895 |
| Random Forest | 0.783041 | 0.728802 |
The evaluation of various models for predicting ischemic heart disease is presented in Table 6. These models include the proposed O-ANN, ANN, Decision Tree, Ada Boost, KNN, and Random Forest. The effectiveness of these models is evaluated based on the values of FPR and FNR. The Proposed O-ANN exhibits the lowest FPR (0.012553), indicating its ability to accurately identify a low proportion of false positive and negative cases. Moreover, it demonstrates the lowest FNR (0.050213), indicating its proficiency in correctly identifying true negative cases. The ANN model displays relatively low FPR (0.020133) and FNR (0.080531) values, while the Decision Tree, AdaBoost, Random Forest, and KNN models achieve slightly higher performance scores. The graph depicting the performance analysis is presented in Figure 5.
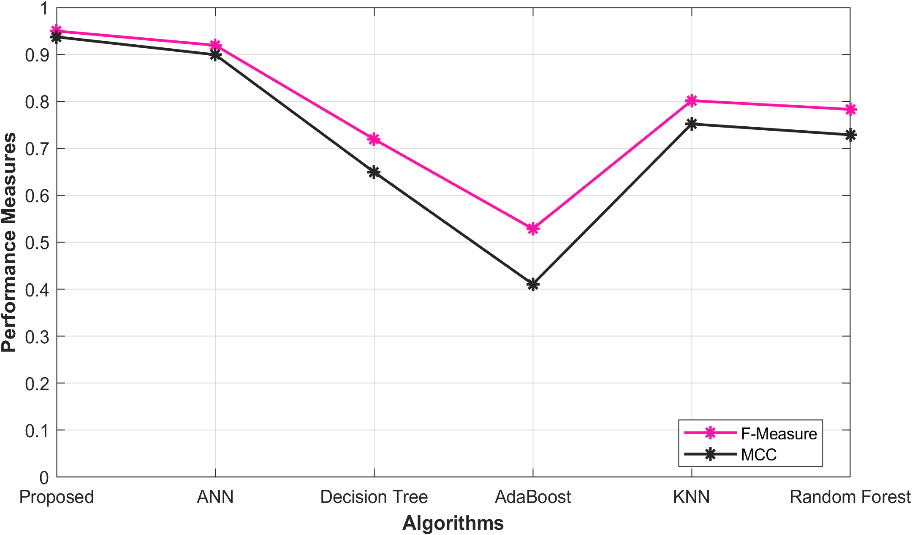
Figure 5: Performance analysis in F- Measure, MCC
Reference
Singh, R. and Rajesh, E., 2019. Prediction of heart disease by clustering and classification techniques prediction of heart disease by clustering and classification techniques. International Journal of Computer Sciences and Engineering.
Oliver, A.S., Ganesan, K., Yuvaraj, S.A., Jayasankar, T., Sikkandar, M.Y. and Prakash, N.B., 2021. Accurate prediction of heart disease based on bio system using regressive learning based neural network classifier. Journal of Ambient Intelligence and Humanized Computing, 63, pp.1-9.
Sharma, M. and Acharya, U.R., 2019. A new method to identify coronary artery disease with ECG signals and time-Frequency concentrated antisymmetric biorthogonal wavelet filter bank. Pattern Recognition Letters, 125, pp.235-240.
Dai, H., Hwang, H.G. and Tseng, V.S., 2021. Convolutional neural network based automatic screening tool for cardiovascular diseases using different intervals of ECG signals. Computer Methods and Programs in Biomedicine, 203, p.106035.
Butun, E., Yildirim, O., Talo, M., Tan, R.S. and Acharya, U.R., 2020. 1D-CADCapsNet: One dimensional deep capsule networks for coronary artery disease detection using ECG signals. Physica Medica, 70, pp.39-48.
Moridani, M.K., Zadeh, M.A. and Mazraeh, Z.S., 2019. An efficient automated algorithm for distinguishing normal and abnormal ECG signal. Irbm, 40(6), pp.332-340.
Yuldashev, Z.M., Nemirko, A.P., Mikhaylov, E.N., Lebedev, D.S., Anisimov, A.A., Skorobogatova, A.I. and Ripka, D.S., 2020. Prediction of Local Abnormal Ventricular Myocardial Electrical Activation on Surface ECG in Patients with Structural Heart Disease. In BIODEVICES (pp. 395-401).
Lippi, G. and Sanchis-Gomar, F., 2020. An estimation of the worldwide epidemiologic burden of physical inactivity-related ischemic heart disease. Cardiovascular Drugs and Therapy, 34, pp.133-137.
von Hafe, M., Neves, J.S., Vale, C., Borges-Canha, M. and Leite-Moreira, A., 2019. The impact of thyroid hormone dysfunction on ischemic heart disease. Endocrine connections, 8(5), pp.R76-R90.
Ledezma, C.A., Zhou, X., Rodriguez, B., Tan, P.J. and Diaz-Zuccarini, V., 2019. A modeling and machine learning approach to ECG feature engineering for the detection of ischemia using pseudo-ECG. PloS one, 14(8), p.e0220294.
Weintraub, W.S., Hartigan, P.M., Mancini, G.J., Teo, K.K., Maron, D.J., Spertus, J.A., Chaitman, B.R., Shaw, L.J., Berman, D., Boden, W.E. and COURAGE Trial Investigators, 2019. Effect of coronary anatomy and myocardial ischemia on long-term survival in patients with stable ischemic heart disease. Circulation: Cardiovascular Quality and Outcomes, 12(2), p.e005079.
Schooling, C.M., 2022. Genetic validation of neurokinin 3 receptor antagonists for ischemic heart disease prevention in men–A one-sample Mendelian randomization study. EBioMedicine, 77.
Gárate-Escamila, A.K., El Hassani, A.H. and Andrès, E., 2020. Classification models for heart disease prediction using feature selection and PCA. Informatics in Medicine Unlocked, 19, p.100330.
Nagavelli, U., Samanta, D. and Chakraborty, P., 2022. Machine learning technology-based heart disease detection models. Journal of Healthcare Engineering, 2022.
Caesarendra, W., Hishamuddin, T.A., Lai, D.T.C., Husaini, A., Nurhasanah, L., Glowacz, A. and Alfarisy, G.A.F., 2022. An embedded system using convolutional neural network model for online and real-time ECG signal classification and prediction. Diagnostics, 12(4), p.795.
Kibel, A., Lukinac, A.M., Dambic, V., Juric, I. and Selthofer-Relatic, K., 2020. Oxidative stress in ischemic heart disease. Oxidative medicine and cellular longevity, 2020.
Hasan, N.I. and Bhattacharjee, A., 2019. Deep learning approach to cardiovascular disease classification employing modified ECG signal from empirical mode decomposition. Biomedical signal processing and control, 52, pp.128-140.
Jahmunah, V., Ng, E.Y.K., San, T.R. and Acharya, U.R., 2021. Automated detection of coronary artery disease, myocardial infarction and congestive heart failure using GaborCNN model with ECG signals. Computers in biology and medicine, 134, p.104457.
Isola, G., Polizzi, A., Muraglie, S., Leonardi, R. and Lo Giudice, A., 2019. Assessment of vitamin C and antioxidant profiles in saliva and serum in patients with periodontitis and ischemic heart disease. Nutrients, 11(12), p.2956.
Chen, J., Valehi, A. and Razi, A., 2019. Smart heart monitoring: Early prediction of heart problems through predictive analysis of ECG signals. Ieee Access, 7, pp.120831-120839.
Satheeskumaran, S., Venkatesan, C. and Saravanan, S., 2021. Real-time ECG signal pre-processing and neuro fuzzy-based CHD risk prediction. International Journal of Computational Science and Engineering, 24(4), pp.323-330.
Velusamy, D. and Ramasamy, K., 2021. Ensemble of heterogeneous classifiers for diagnosis and prediction of coronary artery disease with reduced feature subset. Computer Methods and Programs in Biomedicine, 198, p.105770.
Li, P., Hu, Y. and Liu, Z.P., 2021. Prediction of cardiovascular diseases by integrating multi-modal features with machine learning methods. Biomedical Signal Processing and Control, 66, p.102474
https://www.physionet.org/content/ptb-xl/1.0.1/
Cite This Work
To export a reference to this article please select a referencing stye below:

Academic Master Education Team is a group of academic editors and subject specialists responsible for producing structured, research-backed essays across multiple disciplines. Each article is developed following Academic Master’s Editorial Policy and supported by credible academic references. The team ensures clarity, citation accuracy, and adherence to ethical academic writing standards
Content reviewed under Academic Master Editorial Policy.


