Abstract
Modern technology makes it possible to detect diabetes from blood samples since it is brought on by an increase in blood glucose levels. Undiagnosed diabetes has been linked to several dangerous conditions, including heart attack and renal failure. Thus, there is a need for the detection and analysis of diabetes. A novel deep-learning model is presented in this work and is intended to determine if diabetes is present or not. The purification, standardization, and harmonization of data through the use of the Harmonized Data Standardization (HDS) approach will be the main components of the first phase of the pre-processing of acquired raw information. The features, such as statistical traits, higher-order statistical features, Standardized Mean Absolute Deviation (SMAD), and entropy-based features, will then be retrieved from the pre-processed data. The discovered attributes will then be narrowed down to the best ones using an original, improved Chi-square test. The Bi-directional Long Short-Term Memory Networks (Bi-LSTMs) and The Deep Belief Networks (DBNs) these components will be combined to create the hybrid classifier. When the suggested performance of the models is compared to other strategies, the accuracy achieved—97.44%—is found to be superior to that of the other techniques.
1. Introduction
The development of systems to improve health and reduce global issues is vital, given the expanding population. The creation of such a system is improving in effectiveness as scientific research develops [1] [2] [3]. Healthcare systems are made to give individuals the things they need for optimal health as well as to accurately and quickly diagnose diseases and disorders, as recommended by traditional approaches. Patients are often quite worried about the standard of the healthcare system and the facilities that are available to offer treatment. People with chronic conditions typically benefit more directly from advancements in healthcare systems, and this population is largely made up of those who suffer from conditions like diabetes, high blood pressure, and blood sugar problems [1] [4] [5] [6]. One in ten Americans, and the number of new cases of type 1 and type 2 diabetes among children. Has grown considerably, as per the 2020 report by National Diabetes Statistics. Artificial intelligence and computational methods must be used in [2] developing the latest methods considering their use in healthcare systems in order to reduce the risk of such diseases in our generation, promote a healthier society, and improve life quality. Health and healthcare are essential pillars of a healthy society, so using these capabilities to succeed in the latest methods considering the application of healthcare systems is essential [7] [8] [9] [10].
Technology development has had a significant influence on the medical field. The outcome of someone’s health could depend on a few seconds if they are unable to access a hospital or emergency care. For all those to whom its advantages are given, technology fills this gap in accessibility and availability [11][12][13] [14][15]. Technologies related to video have advanced thanks to the use of magnetic resonance imaging instruments. Patients may receive customised services through web-based applications. The remaining work can be completed via high-tech services like telemedicine after a few clinical appointments. To better meet their requirements, doctors and patients can communicate online [3]. The availability of such equipment to trauma victims in urban and rural areas where clinical treatment may not be available in an emergency is one application of video technology [4]. The use of technology can improve the efficiency and security of home healthcare [5] [16 ][17 ][18 ][19]. One of the biggest issues facing hospitals, which are responsible for keeping and further processing patient data, has been identified as data availability and accuracy. In the context of medical treatments, numerous machine learning and deep learning methods have been successfully applied. The widespread use of technologies like the development of matching algorithms and natural language processing, which resulted in several cutting-edge concepts [6], is what led to these technologies. As opposed to depending on expert knowledge, data mining may be used to directly extract data. These techniques are thought to create distinctive and one-of-a-kind patterns that help hospitals design customised programmes [7] [20 ][21 ][22 ][23].
Diabetes mellitus (DM) is a condition that is not frequently observed on a worldwide scale. This particular illness results from the body’s systems failing to effectively use food as a source of energy. Type 1, type 2, other different types, and gestational diabetes are the four main categories for the many diabetes presentations. It is important to highlight that among these, type 1 and type 2 diabetes are the most common [8]. Diabetes type 1 is insulin-dependent and often develops in people under the age of 40. Patients must take insulin dosages for the rest of their lives. Contrarily, type 2 is more common in those over 40 and is frequently associated with patients’ weight. Over 90% of instances of diabetes are type 2, which is believed to be more prevalent internationally [9]. Numerous academics and medical professionals have offered algorithms and techniques for its treatment and identification because this disease has long been among the most dangerous ones in the world, according to rankings. Deep learning and machine learning are the foundational fields upon which these algorithms are built. Examples of neural networks that might be used for predictive analysis include recurrent neural networks (RNNs) and convolutional neural networks (CNNs). These networks are capable of autonomously acquiring key traits of a certain model [10, 11]. In several instances, researchers have combined methods like gradient-boosted trees with machine-learning approaches. This combination makes it possible to develop forecast models that can precisely predict the transition from prediabetes to diabetes. This research’s main goal is to speed up early detection in order to enhance treatment results and reduce any new dangers [12] [24] [25].
The foremost contribution of the paper is given below:
Our research paper introduces SI-BIOA-Bi-LSTM-DBN, a unique and sophisticated deep learning framework, to detect the existence of diabetes in its early phases. In this proposed model, the data cleansing and data normalization, During the preprocessing step, an improved technique for data standards is introduced to sanitize the incoming raw data.
After the preprocessing step is finished, statistical features, higher-order statistical features, the Improved Mean Absolute Deviation (I-MAD), and entropy are used to extract the required characteristics.
The upgraded chi-square test is then used to choose the best features from the collection of extracted features. This completes the feature selection procedure.
Finally, the SI-BIOA-Bi-LSTM-DBN deep learning architecture is employed to help diagnose diabetes. We compare the performance of the recommended methodology to that of standard approaches to determine its effectiveness.
The planning of the paper is described as follows: The analysis of current studies that are pertinent to our research is covered in depth in the second section, the third section explains a detailed description of the proposed methodology, the fourth section discusses with respect to the discussions and results, eventually fifth section with a conclusion which concludes the paper.
2. Literature Review
In this section, the recent existing papers related to diabetes disease detection are discussed. These papers have some drawbacks, which are discussed in the problem statement. The objective of the study and also the research questions are discussed in this section.
Ganie et al. [1] A novel strategy built on ensemble learning has been created to take into account the use of lifestyle markers for the early identification of type II diabetes. These include the use of boosting, bagging, and voting, among other ensemble learning approaches. Exploratory data analysis is used to enhance the evaluation of the dataset’s quality. The K-fold cross-validation method is used to achieve class balance, and synthetic minority oversampling methods are used to validate the aforementioned results. Feature engineering is used to ascertain the influence of lifestyle variables. The provided framework might be used in the medical field to detect diabetes early. It is also useful for other datasets that have data on diabetes in common.
To make it easier to diagnose diabetes clinically, Olisah et al. [2] For the development of a diabetes prediction model in 2022, a solid framework has been developed. The framework uses Spearman correlation to fill in missing data and polynomial regression to pick characteristics in order to improve performance. Additionally, a number of supervised machine learning techniques have been proposed for classification tasks, including random forest (RF), support vector machine (SVM), and our most recent double-expansion deep neural network models (2GDNN). Stratified k-fold cross-validation and grid search are used repeatedly to tune the model hyperparameters, and the models’ scaling to the prediction issue is evaluated.
Rajagopal et al. [3] developed a novel approach to anticipate the onset of diabetes by using a hybrid artificial neural network (ANN) and genetic algorithm. Our redesigned hybrid model makes use of an improved method to find obvious patterns in the interactions between the variables. The input medical dataset is first treated to state-of-the-art normalization, which guarantees consistent performance across all degrees of data skewness. Our suggested decision-making algorithm then gives importance to the factors that are thought to be the most important, appropriately assessing the level of significance of each element in influencing the conclusion. Because the positive numbers are preferred over the negative numbers in this type of tailored regularisation approach, The dataset was chosen based on its traits, and this led to the conclusion that it had an asymmetrical nature. The suggested method may be tailored to a particular dataset and consider missing values differently from numerical inputs. The UCI Machine Learning Repository provided the Pima Indian Diabetes dataset, and the recommended customized combination model and its associated decision-making method produced predictions with an accuracy rate of 80%.
Samet et al. [4] have used a hybrid strategy to identify the existence of diabetes at an early stage, which relies on the most important three findings and integrates six different supervised machine learning classification algorithms. The Pima Indians’ Diabetes Database may be accessed through the machine learning repository at UC Irvine. Each of the metrics is assessed based on a range of metrics. It’s important to recognize that these hybrid models outperform other cutting-edge methods, obtaining an accuracy rate of 90.62%.
Raihan et al. [5] K-means and hierarchical clustering, two well-regarded machine learning methods, were used to analyze a dataset regarding diabetes and provide predictions about this illness. Machine learning is widely regarded as a significant area of algorithms that has enormous relevance in the present decade with regard to predicting a variety of human illnesses.
Islam et al. [6] collected 340 cases of patients who had diabetes and displayed a range of symptoms; these patients were separated into two categories: Typical and Non-Typical. Three AI algorithms—boosting, linear regression, and decision trees—were used to sort the data. Following the training of the dataset, which was completed using the cross-validation process, this classification was carried out. Bagging’s accuracy, which is 89.12%, Logistic Regression’s accuracy, which is 83.24%, and Random Forest’s accuracy, which is 90.29%, are all quite positive.
In 2022, Charitha et al. [7] have obtained it from the UCI archive. In this study, A variety of machine learning models were used to predict the prevalence of Type II diabetes mellitus following a protracted process of engineering characteristics, using models like Random Forest relevance and RFE to assess the relevance of features. These models were developed utilizing the techniques of Logistic Regression, KNN, Random Forest, SVM, LightGBM, and XGBoost, and they were trained and evaluated using various division ratios, including 55-45, 70-30, and 85-15. With an 80-20 train-test split, the accuracy of the lightGBM model was proven to be 91.47%, outperforming all other models in terms of performance.
2.1. Problem Statement
The application of artificial intelligence methods for the non-invasive and automated detection of diabetes has been the subject of several studies. Machine learning was implemented based on feature extraction, feature selection, and classification processes. Classifiers were tested, and characteristics were retrieved, which varied among the various studies. Additionally, it was demonstrated that due primarily to the size of the data handled, standard machine learning algorithms perform below acceptable levels in the fundamental artificial intelligence issues of speech recognition and object identification. Deep learning research was motivated by the shortcomings of machine learning. Another industry where deep learning has consequences is healthcare. Recently, many studies have been published, primarily in the field of healthcare anomaly detection. Using deep learning techniques, [26] was able to recognise diabetes from the input HRV data with an accuracy number that closely equalled the best level of automated diabetes detection accuracy available at the time.
2.2. Objectives
To undertake a thorough analysis of the most current studies on the subject of diagnosing diabetes mellitus and to determine the particular problem that is being addressed in this respect.
Employing improved pre-processing approaches to pre-process the collected data.
To extract the improved features for efficient recognition of the diabetic mellitus disease.
To select the optimal features with improved feature selection techniques for reducing the computational complexity of the model.
To design an optimized hybrid classifier for efficient diabetic mellitus detection.
An inferior optimization strategy is used to get a less accurate prediction output in order to further optimize the depth of the deep learning model.
It is essential to carry out a comparison analysis to verify the recommended model’s efficacy.
2.3. Research Questions
How is the collected raw data pre-processed to make it noise-free?
What traits were discovered from the pre-processed data to instruct the classifier?
How are the relevant features selected among all the extracted features?
What classifier is used for diabetic mellitus disease detection?
Which meta-heuristic model is used for optimizing the hyper-parameters of the deep learning model?
3. Proposed Methodology
Diabetes, a medical illness brought on by the pancreas not making enough insulin, is an exceptionally rare issue that only affects a small percentage of people globally. It is essential to either avoid the beginning of diabetes or discover it at an early stage in order to stop it from developing into a complicated array of problems. People can live happy lives by getting a fast diagnosis of diabetes and the right medical care. The development of an automated system becomes necessary for the detection of diabetes through the analysis of clinical and physical data in the event that conventional methods of diabetes detection prove to be challenging. Figure 1 shows the block diagram of the proposed diabetes detection model in its early stages.
Four main steps will be followed in this research activity to build a novel diabetes detection model.
Pre-processing.
Feature extraction.
Feature selection.
Diabetics detection.
3.1. Pre-processing
A diabetic database typically contains noise and missing numbers and may even be in an unacceptable format, making it impossible to apply deep learning models to it directly. To make the data usable for the prediction model, it must first be cleaned and refined. This is done to improve the estimating model’s efficacy and accuracy. Data cleansing, data normalisation, and an improved data standards technique are all included in the pre-processing procedure.
Data cleaning
The process of data cleaning consists of identifying and eliminating wrong or corrupt entries through tables, record sets, or data. It also mentions the process of separating and recognizing knowledge that is incomplete, imprecise, erroneous, or irrelevant. Additionally, data cleansing may be done manually using data twenty-five haggle tools or automatically with programming. Information cleaning up, or cleansing, is another term for information cleansing.
Data normalization using Max-Min Normalization
The Min-Max normalisation strategy produces a balance of value comparisons between the original data and the modified data when linear modifications are made to the original data. For this process, the following formula may be employed.
HDS
The purpose of standardization is to make the data available in a set of entity types and attributes that can be shared throughout the whole company. This procedure turns unformatted raw data into a standardized one. Standardized formats are used for the standardization of data values because they make it easier to combine data from different sources, spot duplicate entries, and improve corporate communication. In data standardization, the normal mean value is replaced by the harmonic mean to improve the data standard.
3.2. Feature Extraction
Various qualities, such as statistical properties (such as mean, median, standard deviation, variance, and range), advanced statistical properties (such as skewness and kurtosis), I-MAD, and features based on entropy, will be retrieved after the pre-processing step has ended.
Table 1: Formula for Statistical and higher order statistical features
| Sl. No | Statistical feature | Formula |
| 1. | Mean | |
| 2. | Median | |
| 3. | SD ( | |
| 4. | Variance | |
| 5. | Kurtosis (high order) | |
| 6. | Skewness (high order) |
3.2.1. Min- Max
Maximum and minimum are terms used to denote the biggest and smallest values, respectively, in a data collection (or min). When determining the range, The lowest value is subtracted from the highest value in the measurement, known as the difference between the highest and lowest numerical values.
3.2.2 SMAD
A MAD data set is a mean distance connecting individual data points and data mean. Specifically, it shows how much variance there is within the data collection relative to the mean value. Additionally, the average absolute difference between each value in a given dataset and the mean value is used to calculate the modification measure, a quantitative statistic, divided by the average of that absolute difference. The standard deviation function is added to enhance the deviation value.
3.2.3. Entropy
In general, entropy serves as a metric for energy quality, with lower values indicating greater calibre. The efficient library has less entropy than energy that is not kept in a well-organized manner. High entropy energy is energy that has been stored in a chaotic manner (the random-pile library).
3.3. Feature selection using ICST
The reduction of vast amounts of text categorization data by feature selection is successful. It could improve the categorization procedure. In order to reduce classification process complexity, feature selection eliminates unnecessary and noisy data and selects a representative subset of all data. This test is used when a population has two category variables. It is used to establish whether the connection between the two variables is meaningful
One of the two chi-square tests that are available is the chi-square test for independence, with the chi-square goodness of fit test being the other. The formula (n-1) (m-1) may be used to determine the degree of independence for the chi-square test, where n is the number of rows and m is the number of columns. The probability function has been added to this test to improve its efficiency. The Eqn. (4) represents the value of ICST.
*P(i, j) (4)
Where S is the degree of freedom, is the observed value, is the expected value, and P(i, j) is the probability function.
3.4. Diabetes detection using SI-BIOA-Bi-LSTM-DBN model
In this part, the SI-BIOA is employed to increase the weight of the Bi-LSTM, while the DBN and Bi-LSTM are hybridised to detect diabetes. A novel SI-BIOA approach is used to fine-tune the weight of Bi-LSTM in order to increase the detection accuracy of the predicted diabetes disease detection model. The hybrid classifier’s identified result will be the final result. This algorithm’s optimization procedure is comparable to a game of pool. The best solutions are viewed as pockets, and each solution contender is a multidimensional billiards ball.
3.4.1. Bidirectional LSTM
Recurrent neural networks (RNN) include LSTM, among others. The system is made up of a number of memory blocks, each of which has many gates. The input, output, and forget gates are among the three types of perceptron gates that make up the LSTM gate. The input and output gate control the network’s input and output while the cell memory is set by the forget gate. Because they are in charge of organising memory cells during the processing and storage of information, gates play a crucial function in LSTM. Due to the system’s reliance on data sequence information, LSTM is particularly well suited for processing series data. However, LSTM can only analyse data that have been arranged before. To manage information moving in two opposing directions, typically forward and backwards, inside two distinct hidden layers, bi-directional LSTM is used. As a result, BI-LSTM is made up of two LSTM units. The initial LSTM unit processes input by successively reading it from the left and guiding it towards the right, as shown in Figure 2, whereas the second LSTM processes it from the right and directs it towards the left.
‘Out’ stands for output gate, d is for cell, F stands for feature vector, ‘We’ stands for weight matrix, stands for sigmoid function, ‘ip’ stands for input data, b stands for biased matrix, y stands for forget gate, and ip stands for input gate.
3.4.2. SI-BIOA
The primary origin of the BIOA may be traced back to the physics-based game of billiards and the collisions between the balls. Vector algebra and conservation rules control how the balls interact with one another. Aside from the sum of the two momenta, the kinetic energy of balls is preserved in collisions with perfect elasticity before and after impacts. In light of these facts, the following equation is used to calculate the final velocities of colliding spheres in both parallel and perpendicular orientations to the line of impact of the spheres, as per Eq. (16) & Eq. (17), respectively. In SI-BIOA, the Euclidian distance between the balls has been newly considered to enhance the convergence of the solutions.
Where and represent the speeds of the first and second balls before impact and represent their subsequent speeds. Additionally, the symbols stand for parallel and perpendicular parts, respectively. The masses of the balls are represented by the parameters. Additionally, C is used to represent the connecting vector’s unit vector. As the forces only operate along the collision line, it is imperative that the perpendicular components of the velocities stay unchanged. As a result, the momenta’s perpendicular module with respect to the balls is preserved. According to a careful examination of the aforementioned equations, if the balls have similar masses, they just exchange their parallel components of velocities. Figure 3 shows the balls’ individual velocities both before and after the impact.
Each solution candidate in this approach, which includes several choice factors, is viewed simultaneously as a multi-dimensional ball. The SI-BOA’s search operatives are represented by these balls, and each about their diameter corresponds to a separate variable. In a nutshell, the procedure begins with random-distributed, non-dominated solutions, and an initial generation of balls is then transferred towards an external repository. A part of the repository process is chosen even as pockets in the course of one and all cycles. The balls are then divided into two separate groups: cue balls and normal balls. Each target ball struck by a cue ball is then moved in the direction of a predetermined pocket. Vector algebra and collision principles regulate the collisions between cue balls. They outline the motion of the balls when they collide, as well as their ultimate condition.
3.4.3. DBN
One kind of Boltzmann machine is the restricted Boltzmann machine (RBM). RBM was separated into two layers: the concealed layer and the visible layer. There was no connection between the units on the same layer, yet each unit on the visible layers was connected to each unit in the hidden layers. Under no circumstance is there a relationship between the hidden groups and the ones that are not visible? This issue can be resolved by combining many RBMs, in which the hidden levels of one RBM become the visible layers for other RBMs. The DBN represents a model of probabilistic generative with numerous sheets of hidden constants, all of which are capable of capturing the relationships connecting the concealed feature’s operations to those of the layer beneath. Each layer in DBN is composed of a unit group that can have a binary or real value. Although DBN possesses a hierarchical formation in the company of excellent representational power, training greedy via layer by layer for each RBM is straightforward. The priming process for DBN is divided into two phases. The RBM at the bottom is primed using priming facts before being applied. Second, the output of the lower RBM from the unsupervised technique led to the discovery of the upper RBM.
A generating dataset is produced continuously by unsupervised pretraining during the initial RBM. These procedures are carried out by encrypting input data into the secondary RBM. The findings were processed by the second RBM and then sent back to the initial RBM through decrypting. Equations 1 and 2 are used to calculate probability during the encrypting and decrypting process.
The relationship between the visible and hidden layers is represented by the weight matrix w, where a and b are the partial vectors about the hidden and visible layers, respectively. The top layer of the DBN was introduced in order to categorise it, utilising the supervised technique in this investigation. The DBN’s final output in this investigation is represented by the probability value for each class label for each sample.
4. Result And Discussion
According to the present division, execution metrics including sensitivity, accuracy, F-score, specificity, MCC, recall, NPV, FPR, and FNR should be used to evaluate the model’s performance, and it is compared with the existing techniques like Bi-LSTM-DBN, Bi-LSTM, DBN, LSTM, and CNN.
4.1 Performance metrics
The performance metrics and their calculation formulas are given below.
Sensitivity
Simply dividing the total positive cases by the proportion of genuine positive predictions yields the resulting sensitivity value.
Specificity
By accurately dividing the overall number of negative events by the predicted number of negative outcomes, specificity is calculated.
Accuracy
The proportion of information that is appropriately structured to all of the information in the log is how accuracy is defined. On the other hand, accuracy is discussed.
Precision
By employing the entire number of samples used in the classification process, Precision is the representation of the total number of genuine samples that are correctly acknowledged during the categorization process.
Recall
The recall rate may be thought of as the evaluation of the enormous number of real samples that are used in the classification of data, using all the samples that are accessible from the same categories discovered in the training data.
F- Score
The harmonic mean, often known as the F-score, is the mathematical average of recall rate and accuracy. (46)
Negative Prediction Value (NPV)
The NPV provides evidence of a diagnostic test’s or any other quantitative measure’s effectiveness.
Matthew’s correlation coefficient (MCC)
The MCC binary variable association measure, which uses a two-by-two structure, is illustrated.
False Positive Ratio (FPR)
The denominator is the ratio of unfavourable occurrences to the incorrectly labelled negative episodes as good incidents.
False Negative Ratio (FNR)
The likelihood that a test may miss detecting a true positive is known as the false-negative rate, or “miss rate.”
4.2. Dataset Description
The UCI dataset was used to create the dataset for estimating the risk of early-stage diabetes. This dataset was subsequently used in the course of this inquiry. The dataset is made up of 520 instances, 17 characteristics, 16 inputs, and 1 output. In terms of early-stage diabetes risk prediction, the output class includes “positive” and “negative” results.
4.3 Comparative analysis for the performance metrics
The proposed method’s performance measures are contrasted with those of current methods like Bi-LSTM-DBN, Bi-LSTM, DBN, LSTM, and CNN. The FNR and FPR error measurements are utilized in this situation to assess the loss values, and the other metrics are used to determine how effective the proposed approach is. Table 1 displays a comparison of the performance metrics.
Table 2: Performance metrics comparison between the proposed methodology with presently used methods
| Techniques | Sen | Spec | Acc | Precision | Recall | F-Measure | NPV | MCC | FPR | FNR |
| Proposed SI-BIOA-Bi-LSTM-DBN | 0.9896 | 0.9500 | 0.9744 | 0.9694 | 0.9896 | 0.9794 | 0.9828 | 0.9458 | 0.0500 | 0.0104 |
| Bi-LSTM-DBN | 0.9792 | 0.9333 | 0.9615 | 0.9592 | 0.9792 | 0.9691 | 0.9655 | 0.9186 | 0.0667 | 0.0208 |
| Bi-LSTM | 0.9375 | 0.9500 | 0.9423 | 0.9677 | 0.9375 | 0.9524 | 0.9048 | 0.8800 | 0.0500 | 0.0625 |
| DBN | 0.9479 | 0.8833 | 0.9231 | 0.9286 | 0.9479 | 0.9381 | 0.9138 | 0.8368 | 0.1167 | 0.0521 |
| LSTM | 0.9271 | 0.8500 | 0.8974 | 0.9082 | 0.9271 | 0.9175 | 0.8793 | 0.7823 | 0.1500 | 0.0729 |
| CNN | 0.8750 | 0.8167 | 0.8526 | 0.8842 | 0.8750 | 0.8796 | 0.8033 | 0.6896 | 0.1833 | 0.1250 |
The metrics values are tallied and compared from the table. When compared to other methods, the suggested model is highly accurate. Graphs are used to display the performance comparison.
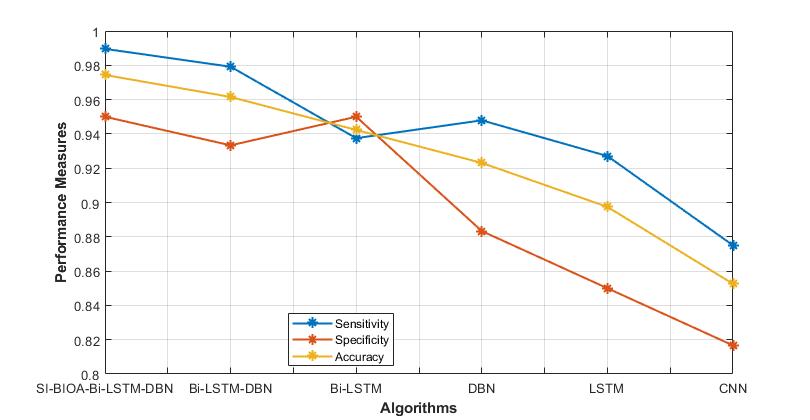
Figure 4: Comparison of sensitivity, specificity and accuracy
Figure 4 illustrates the graphical representation of the performance metrics, such as sensitivity, specificity, and accuracy, for the proposed and existing techniques. The SI-BIOA-Bi-LSTM-DBN model has high accuracy, sensitivity and specificity as compared to the existing techniques.
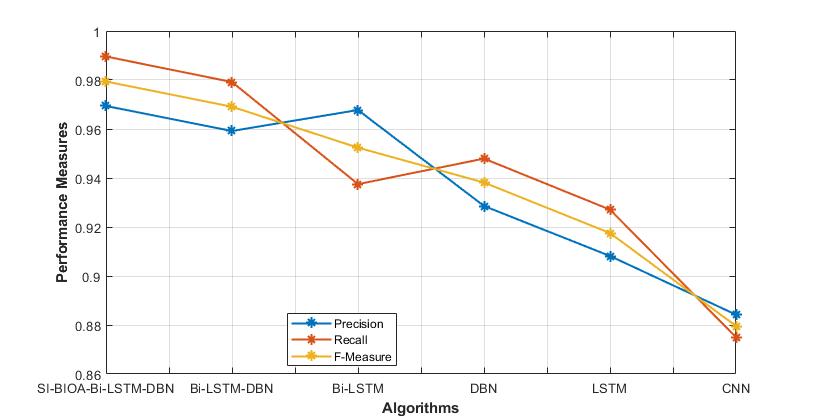
Figure 5: Comparison of precision, recall and F- Measure
The present and suggested approaches can both be used; figure 5 shows the graphical depiction of performance parameters, including precision, recall and F- Measure. In comparison to previous methods, the SI-BIOA-Bi-LSTM-DBN model has good precision, recall and F- Measure.
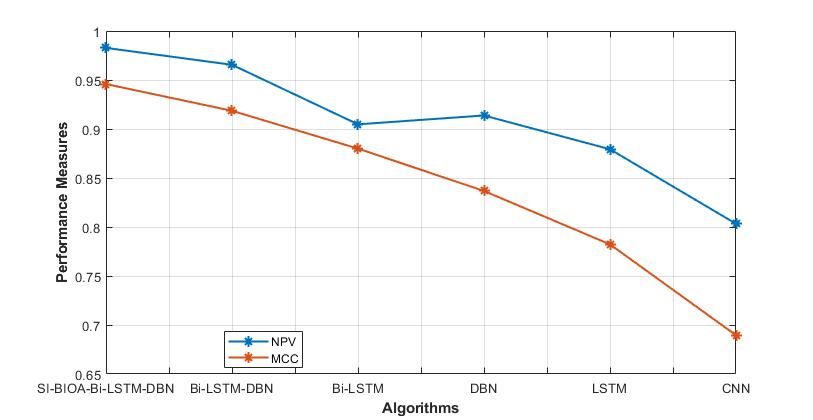
Figure 6: Comparison of NPV and MCC
The graphical depiction of performance parameters, including NPV and MCC for the suggested and current approaches, is shown in Figure 6. When compared to the currently used approaches, the SI-BIOA-Bi-LSTM-DBN model has higher NPV and MCC.
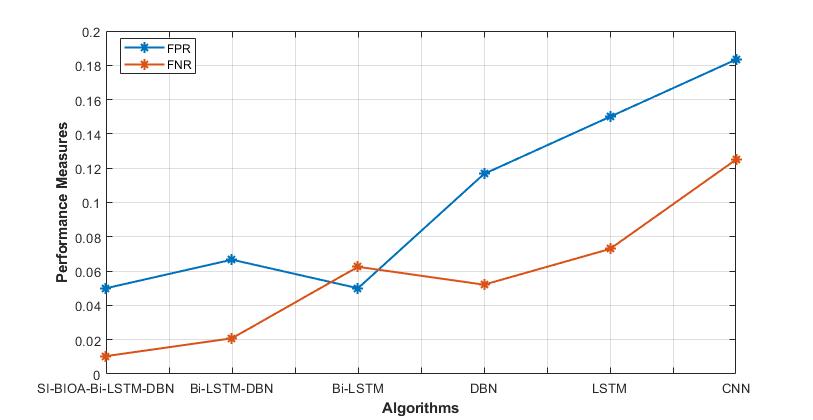
Figure 7: Comparison of FPR and FNR
The FPR and FNR performance indicators for both proposed and current approaches are represented graphically in Figure 7. Comparing the SI-BIOA-Bi-LSTM-DBN model to the currently used methods reveals that it has lower FPR and FNR.
5. Conclusion
The goal of this study was to put a prognostic model for assessing diabetes susceptibility into practice. As was already established, a sizable portion of people worldwide suffer from diabetes. It poses a significant threat to the entire world if left unchecked. Thus, by using many classifiers on the dataset for predicting early-stage diabetes risk, we have shown in our suggested inquiry that a profound learning model has the ability to attenuate risk variables and boost detection in terms of efficiency and accuracy. In this paper, the hybrid model SI-BIOA-Bi-LSTM-DBN is used to detect whether the diabetes disease is present or not in the patient. The SI-BIOA algorithm is mainly used to improve the weight of the Bi-LSTM. The technique’s effectiveness is evaluated by contrasting it with earlier efforts like Bi-LSTM-DBN, Bi-LSTM, DBN, LSTM, and CNN. The model suggested in this study outperforms the efficacy of competing approaches with a greater accuracy rate of 98.96%.
Our goal is to create a robust infrastructure that can use the suggested deep learning algorithm in the future to help healthcare professionals quickly identify the presence of diabetes. This infrastructure may become apparent as a mobile app or an internet portal.
Reference
Shahid Mohammad Ganie, Majid Bashir Malik," An ensemble Machine Learning approach for predicting Type-II diabetes mellitus based on lifestyle indicators", Healthcare Analytics, 2022.
Chollette C. Olisah, Lyndon Smith, Melvyn Smith, Diabetes mellitus detection and diagnosis from a data preprocessing and machine learning perspective; Computer Methods and Programs in Biomedicine, 2022.
Aghila Rajagopal, Sudan Jha, Ganeshsree Selvachandran," A novel hybrid machine learning framework for the prediction of diabetes with context-customized regularization and prediction procedures; Mathematics and Computers in Simulation, 2022.
S. Samet, M. R. Laouar and I. Bendib, " Diabetes mellitus early stage risk prediction using machine learning algorithms," 2021 International Conference on Networking and Advanced Systems (ICNAS), 2021, pp. 1-6, doi: 10.1109/ICNAS53565.2021.9628955.
M. Raihan, M. T. Islam, F. Farzana, M. G. M. Raju and H. S. Mondal, " An Empirical Study to Predict Diabetes Mellitus using K-Means and Hierarchical Clustering Techniques," 2019 10th International Conference on Computing, Communication and Networking Technologies (ICCCNT), 2019, pp. 1-6, doi: 10.1109/ICCCNT45670.2019.8944552.
M. T. Islam, M. Raihan, F. Farzana, M. G. M. Raju and M. B. Hossain, An Empirical Study on Diabetes Mellitus Prediction for Typical and Non-Typical Cases using Machine Learning Approaches," 2019 10th International Conference on Computing, Communication and Networking Technologies (ICCCNT), 2019, pp. 1-7, doi: 10.1109/ICCCNT45670.2019.8944528.
C. Charitha, A. Devi Chaitrasree, P. C. Varma and C. Lakshmi, " Type-II Diabetes Prediction Using Machine Learning Algorithms," 2022 International Conference on Computer Communication and Informatics (ICCCI), 2022, pp. 1-5, doi: 10.1109/ICCCI54379.2022.9740844.
K. Kölle, T. Biester, S. Christiansen, A. L. Fougner and Ø. Stavdahl, " Pattern Recognition Reveals Characteristic Postprandial Glucose Changes: Non- Individualized Meal Detection in Diabetes Mellitus Type 1," in IEEE Journal of Biomedical and Health Informatics, vol. 24, no. 2, pp. 594-602, Feb. 2020. doi: 10.1109/JBHI.2019.2908897
V. Dremin et al., " Skin Complications of Diabetes Mellitus Revealed by Polarized Hyperspectral Imaging and Machine Learning," in IEEE Transactions on Medical Imaging, vol. 40, no. 4, pp. 1207-1216, April 2021. doi: 10.1109/TMI.2021.3049591.
L. Zhang, Y. Wang, M. Niu, C. Wang and Z. Wang, " Nonlaboratory-Based Risk Assessment Model For Type 2 Diabetes Mellitus Screening in Chinese Rural Population: A Joint Bagging-Boosting Model," in IEEE Journal of Biomedical and Health Informatics, vol. 25, no. 10, pp. 4005-4016, Oct. 2021. doi: 10.1109/JBHI.2021.3077114.
A. H. Syed and T. Khan, " Machine Learning-Based Application for Predicting Risk of Type 2 Diabetes Mellitus (T2DM) in Saudi Arabia: A Retrospective Cross-Sectional Study," in IEEE Access, vol. 8, pp. 199539-199561, 2020. doi: 10.1109/ACCESS.2020.3035026.
E. A. Pustozerov et al., " Machine Learning Approach for Postprandial Blood Glucose Prediction in Gestational Diabetes Mellitus," in IEEE Access, vol. 8, pp. 219308-219321, 2020. doi: 10.1109/ACCESS.2020.3042483.
C. Ouyang, Z. Gan, J. Zhen, Y. Guan, X. Zhu and P. Zhou, " Inter-Patient Classification With Encoded Peripheral Pulse Series and Multi-Task Fusion CNN: Application in Type 2 Diabetes," in IEEE Journal of Biomedical and Health Informatics, vol. 25, no. 8, pp. 3130-3140, Aug. 2021. doi: 10.1109/JBHI.2021.3061114
A. Gudigar et al., " Local Preserving Class Separation Framework to Identify Gestational Diabetes Mellitus Mother Using Ultrasound Fetal Cardiac Image," in IEEE Access, vol. 8, pp. 229043-229051, 2020. doi: 10.1109/ACCESS.2020.3042594.
B. Lobo, L. Farhy, M. Shafiei and B. Kovatchev, " A Data-Driven Approach to Classifying Daily Continuous Glucose Monitoring (CGM) Time Series," in IEEE Transactions on Biomedical Engineering, vol. 69, no. 2, pp. 654-665, Feb. 2022. doi: 10.1109/TBME.2021.3103127.
H. Shang and Z. -P. Liu, " Prioritizing Type 2 Diabetes Genes by Weighted PageRank on Bilayer Heterogeneous Networks," in IEEE/ACM Transactions on Computational Biology and Bioinformatics, vol. 18, no. 1, pp. 336-346, 1 Jan.-Feb. 2021. doi: 10.1109/TCBB.2019.2917190.
H. G. Clausen et al., " A New Stochastic Approach for Modeling Glycemic Disturbances in Type 2 Diabetes," in IEEE Transactions on Biomedical Engineering, vol. 68, no. 10, pp. 3161-3172, Oct. 2021. doi: 10.1109/TBME.2021.3074868.
S. Lekha and S. M, " Recent Advancements and Future Prospects on E-Nose Sensors Technology and Machine Learning Approaches for Non-Invasive Diabetes Diagnosis: A Review," in IEEE Reviews in Biomedical Engineering, vol. 14, pp. 127-138, 2021. doi: 10.1109/RBME.2020.2993591
S. Gupta, A. Singh, A. Sharma and R. K. Tripathy, "dSVRI: A PPG-Based Novel Feature for Early Diagnosis of Type-II Diabetes Mellitus," in IEEE Sensors Letters, vol. 6, no. 9, pp. 1-4, Sept. 2022, Art no. 7003404. doi: 10.1109/LSENS.2022.3203609.
M. R. Eissa, T. Good, J. Elliott and M. Benaissa, " Intelligent Data-Driven Model for Diabetes Diurnal Patterns Analysis," in IEEE Journal of Biomedical and Health Informatics, vol. 24, no. 10, pp. 2984-2992, Oct. 2020. doi: 10.1109/JBHI.2020.2975927
D. Wen et al., " Feature Classification Method of Resting-State EEG Signals From Amnestic Mild Cognitive Impairment With Type 2 Diabetes Mellitus Based on Multi-View Convolutional Neural Network," in IEEE Transactions on Neural Systems and Rehabilitation Engineering, vol. 28, no. 8, pp. 1702-1709, Aug. 2020. doi: 10.1109/TNSRE.2020.3004462
C. Saint-Pierre, F. Prieto, V. Herskovic and M. Sepúlveda, " Team Collaboration Networks and Multidisciplinarity in Diabetes Care: Implications for Patient Outcomes," in IEEE Journal of Biomedical and Health Informatics, vol. 24, no. 1, pp. 319-329, Jan. 2020. doi: 10.1109/JBHI.2019.2901427
E. Montaser, J. -L. Díez, P. Rossetti, M. Rashid, A. Cinar and J. Bondia, " Seasonal Local Models for Glucose Prediction in Type 1 Diabetes," in IEEE Journal of Biomedical and Health Informatics, vol. 24, no. 7, pp. 2064-2072, July 2020. doi: 10.1109/JBHI.2019.2956704
S. Selvakumar, " Decision support system for type II diabetes and its risk factor prediction using bee-based harmony search and decision tree algorithm" Int. J. Biomedical Engineering and Technology, Vol. 29, No. 1, 2019
Xiaohua Li, Jusheng Zhang, Fatemeh Safari, Improving the Accuracy of Diabetes Diagnosis Applications through a Hybrid Feature Selection Algorithm" Neural Processing Letters, 2021
A. Kaveh, M. Khanzadi, M. Rastegar Moghaddam, "Billiards-inspired optimization algorithm; a new meta-heuristic method", Structures, 2020
Cite This Work
To export a reference to this article please select a referencing stye below:

Academic Master Education Team is a group of academic editors and subject specialists responsible for producing structured, research-backed essays across multiple disciplines. Each article is developed following Academic Master’s Editorial Policy and supported by credible academic references. The team ensures clarity, citation accuracy, and adherence to ethical academic writing standards
Content reviewed under Academic Master Editorial Policy.


