Abstract
A beta coronavirus called Severe Acute Respiratory Syndrome Coronavirus 2 (SARS-CoV-2) has single-stranded (positive-sense) Ribonucleic acid (RNA) genomes that are enclosed and of zoonotic origin. The prediction of Coronavirus variants is a most complicated work. This proposed model presents an innovative approach to preprocessing Deoxyribonucleic acid (DNA) sequences using K-mers, resulting in the transformation of genetic data into English-like statements. The K-mer technique employs a sliding window with a specified stride to generate overlapping sequences, facilitating comprehensive sequence analysis. Label Binarization is then utilized to assign unique index values to each K-mer, enabling efficient data encoding. The model further incorporates both sequential and statistical feature extraction methods to capture high-level features from DNA sequences. This approach accommodates various K-mer sizes, enhancing feature learning performance and utilizing Word2Vector (W2V) to represent K-mer words feature vectors. In addition to Continuous Bag of Words (CBoW)-based feature extraction, the model leverages statistical feature extraction techniques, including Harmonic Mean, Median, Standard Deviation, Gain Ratio, ReliefF, Symmetrical Uncertainty (SU), and Information Gain (IG), to achieve high-level classification accuracy. To optimize feature selection, the model introduces the Self-Adaptive Coati Optimization (SACO) algorithm, which outperforms traditional Coati Optimization through a three-way self-adaption process based on Levy strategies, the Easom Function, and Inertial Weighting. The SACO algorithm demonstrates superior performance, establishing it as a robust choice for feature selection in comparison to existing methods. The Support Vector Machine (SVM) is employed for classifying the Coronavirus variant. The python platform is utilizing for implementation and achieved the accuracy of …
Introduction
In December 2019 in Wuhan, the provincial capital of Hubei, China, a patient with pneumonia was found to have the SARS-CoV-2, also known as COVID-19 [1], [2], [3]. The WHO declared COVID-19 to be a global outbreak on January 30, 2020, and March 11, 2020, accordingly. According to the most recent WHO data, the COVID-19 has infected over 65 million individuals, caused 1.5 million fatalities globally, and spread to more than 200 nations [4], [5]. Due to the newness of the virus and its characteristics, no viable treatment or vaccination has yet to be developed. To lower the rate of transmission and reproduction, nations and health organizations are implementing and advising preventative and isolating measures. It is essential to comprehend the roles of the SARS-CoV-2 genome to create treatments or vaccinations that generate lasting protection [6], [7], [8].
The positive sense strand RNA genome of SARS-CoV-2 is between 26 and 32 kb in size and is a member of the family Coronaviridae of the genus Beta coronavirus. The replication enzyme coding region (ORF 1a and 1b) [9], [10], the envelope protein, the membrane protein [11], the nucleocapsid protein, the spike protein, and several other accessory genes (ORF 3a, 6, 7a, 7b, and 8) are the six major open reading frames (ORFs) found in the SARS-CoV-2 genome. For the viral particle to be physically complete, the structural proteins membrane protein, spike protein, nucleocapsid protein, and envelope protein must all be present [12], [13], [14]. Spike glycoprotein directs the entry of the coronavirus into the host cells. 16 non-structural proteins (nsp1-6) that are highly conserved across coronaviruses make up the replication enzyme that is encoded by ORF 1a and 1b [15], [16]. The four nucleotide bases that make up an organism’s nucleic acids—Adenine, Guanine, Cytosine, and Thymine—combine to form its genome, which represents the total of its genetic capacity [17], [18]. The one-stranded DNA sequence of the RNA-based COVID-19 gene is approximately 30 Kb long. Genome sequencing is the process of determining the nucleotide order of a genome.
Biomedical experts can create hypotheses regarding how genetic features may influence the frequency of sickness presentations in the population thanks to the discovery of these traits. But this is frequently a labour- and time-intensive procedure that heavily relies on subject-matter knowledge. In the COVID-19 pandemic, for example, early gene sequencing of several SARS-CoV-2 strains failed to yield timely useful information, and numerous aspects of disease activity are still unexplained [19], [20]. Sequential pattern mining (SPM), a technique used in Artificial Intelligence (AI), has the potential to speed up the development of useful insights and, eventually, increase the efficacy of global reactions. Pattern analysis provides efficient computer-based techniques that enable users, particularly bio-informaticians, to analyze complex and enormous genetic and genomic data.
The suggested model has improved preprocessing by processing sequences with K-mers, which results in a sequence that looks like an English sentence. Overlapping sequences are formed by utilizing a sliding window and stride. Then, by transforming the sequences into an array of integers, the use of Label Binarizer enables the encoding of Sequence data for extremely effective Feature learning. For the suggested study, the proposed model has utilized both sequential feature extraction and statistical feature extraction.
- To efficiently convert the DNA sequence into statements the adaptive K-mers is introduced. Depending on the properties of the sequence being analyzed, adaptive k-mers let the k value to change or be optimized.
- To overcome the SACO algorithm to fall in the local optima, the levy flight strategy is included in the exploration phase of the SACO algorithm. This may improve the overall fitness score of the SACO algorithm.
- To update the position of the optimization algorithm, Easom function is utilized. This may help to escape from the local minima and continue searching for the global minimum and also helping the algorithm navigate the search space effectively.
- To obtain the trade-off between global and local optima, the inertia weight is introduced in the exploitation stage. This may produce a balance between exploitation and exploration.
The organization of the paper is as follows, section 2 explain the recent existing papers in literature review section, section 3 gives the detailed description of proposed methodology, section 4 discussed the results obtained for the proposed technique and compared it with the existing techniques and finally section 5 conclude the paper with detailed conclusion.
- Literature review
The recent existing papers related to identifying coronavirus variant is discussed in this section.
In 2021, Nawaz, et. al., [21] have analyzed the COVID-19 genome with AI methods. The study examines how to extract useful information from COVID-19 genomic sequences using AI approaches. Sequential pattern mining (SPM) was originally used to the COVID-19 genome sequences in an effort to look for any fascinating hidden patterns that would point to a regular sequence of nucleotide bases and how they interact with one another. The corpus was then subjected to sequence predictive algorithms to see if nucleotide bases could be predicted from previous ones. Third, a procedure is developed for analyzing mutations in genome sequences to identify the locations in which the nucleotide bases changed and to calculate the mutation rate.
In 2022, Ahmed and Jeon [22] have developed an AI for COVID 19 and related virus genome sequence analysis. In the paper, a new AI-based technique for COVID-19 genome sequence evaluation as well as genome sequence analyses for corresponding viruses including SARS, Middle East Respiratory Syndrome, and Ebola was presented. With the use of the method, considerable information may be extracted from different viral genome sequences. which do a comparison of data by gathering basic data from the COVID-19 and other genome sequences, such as details on the frequency and structure of nucleotides, the composition of trinucleotides, the quantity of amino acids, aligning of genome patterns and DNA similarity data.
In 2020, Dey, et. al., [23] have discussed the SARS-CoV-2 and human protein interactions predicted using machine learning approaches based on sequence. A variety of machine learning models were developed in that article to forecast the PPIs between virus and human proteins. These models were then further confirmed by biological tests. The classification models were developed using a variety of sequence-based properties of human proteins, including conjoint triad, pseudo amino acid substance, and amino acid concentration. Finding prospective targets for more efficient COVID drug development may be aided by that work.
In 2020, Pathan, et. al., [24] have discussed the COVID-19 time series prediction using recurrent neural network-based LSTM model with mutation rate analysis. That study investigates the overall genome sequence’s mutation rate using patient datasets from various nations. The processed dataset was used to distinguish between nucleotide and codon mutations. Thymine (T) and Adenine (A) are shown to have undergone significant amounts of mutation throughout all areas, while codons do not undergo as much mutation as nucleotides. To forecast the virus’s future mutation rate, a recurrent neural network-based Long Short-Term Memory (LSTM) model has been used.
In 2021, Wang and Jiang [25] have invented the COVID 19 genome sequence studies using principal component analysis. The aligned big size genome sequences were subjected to a principle component analysis (PCA), and the letters were translated into numbers using a method that has been published for the study of protein sequence clusters. The key human viral sequences were separated from the pangolin and bat collections in the study’s preliminary finalist sequence evaluation, and the PCA score plot showed acceptable compatibility with low-quality data.
In 2020, Saha [26] have suggested the genome-wide analysis for genetic mutation and SNP identification. The study examined 566 Indian SARS-CoV-2 genomes to search for SNPs, removal, introduction, and substitution alterations. Our research found 64 SNPs, 1609-point mutations in the forms of substitution, deletion, and insertion, and 100 mutation clusters (mainly deletions). The 6 coding areas include 57 of the 64 SNPs total. SNPs were being sought for in order to pinpoint the genomic region that may be used to characterize the viral strain in India.
In 2021, Arslan [27] have predicted based on the genetic connections among the human SARS-CoV-2 and the bat SARS-like coronavirus (COVID-19). According to the suggested technique, each human coronavirus sequence was given one of three similarity scores that take into account nucleotide similarities and mutations that result in a pronounced lack of cytosine and guanine nucleotides. The suggested traits were then combined with genomic sequence CpG island features to enhance COVID-19 prediction. Thus, five real numbers may be used to represent each genome sequence. On a dataset of SARS-CoV-2-equivalent people coronavirus DNA sequences, that employ six machine learning classifiers to demonstrate the usefulness of the suggested features.
In 2021, Singh, et. al., [28] have employed machine learning methods to classify SARS-CoV-2 and non-SARS-CoV-2. That work uses complementary DNA, which was made from the single-stranded RNA virus, to categorize the SARS-CoV-2 virus without needing alignment. A total of 1582 samples were gathered from multiple data sources, with diverse genome sequence lengths from various areas, and split into two groups: those with and without SARS-CoV-2. Utilizing DSP methods, retrieved eight biomarkers based on three-base periodicity, and using a filter-based feature selection, graded them.
In 2022, Paul, et. al., [29] have discussed visualization and artificial neural network for the detection of intra-family coronavirus genomic sequences. In that study, chaotic game representation (CGR) is introduced as a tool for analyzing the pattern of genetic sequences. It serves as a visual representation of the genome for the sequence as a whole. The DNA sequence’s bases are mapped using the CGR representation, which places each base in the correct location in the two-dimensional plane. The one to one mapping to nucleotides and sequence that CGR offers was significant. An initial genom’s base and position may be determined from a CGR plane coordinate.
In 2021, Tarique, et. al., [30] have recommended a genome-wide comparative annotation and analysis of the novel SARS-CoV2 and Other Coronaviruses. The study’s main objectives were to assess how closely related and how their mutational adaptability of other coronaviruses from different hosts and geographical locations were to the SARS-CoV2, as well as to provide a better means of comprehending the mutational rate for the creation of targeted medications. That study compares each annotation, focusing on SNPs, repeat analysis with different classifications for short- and The genomes contain projected mature peptides with precise lengths and locations, as well as long-sequence repetitions, various UTRs, transcription elements, and long-sequence repetitions.
2.1. Problem statement
Understanding the propagation and evolution of the virus depends heavily on the discovery of SARS-CoV-2 variants from viral genome sequences. Existing approaches generally rely on sequential feature extraction and selection procedures, which may have issues correctly anticipating the variations. A unique strategy that integrates feature extraction and selection methods for improved feature learning is suggested to get around these restrictions. To provide more precise variant prediction, feature selection approaches’ performance can be further improved. In order to increase the efficiency of feature selection in the identification of SARS-CoV-2 variants, it is necessary to develop a method that uses the SACO algorithm.
By using weighted feature learning approaches, the suggested model also tries to solve the problem of subpar feature learning. The model aims to improve the overall feature learning process and, as a result, the performance of variant prediction for SARS-CoV-2 by including weighted feature learning. For the purpose of successfully predicting SARS-CoV-2 variations from viral genome sequences, the problem statement calls for the development of a method that combines sequential feature extraction, feature selection using the SACO algorithm, and weighted feature learning.
- Proposed methodology
The primary goal of the model is to get knowledge from genetic sequences. The genetic sequence of organisms, such the SARS-CoV-2 virus that causes COVID-19, is represented by their genomic sequences. These patterns are sometimes depicted as a series of letters (A, C, G, T, and F), where each letter denotes a distinct genetic basis. The model studies the sequencing and structuring of the genetic components since it considers sequential factors. Analyzing the sequential component is necessary to comprehend genetic data. The model considers sequential aspects as well as statistical factors. Finding numerical characteristics or trends is a necessary step in the process of collecting statistical features from genetic data. These qualities could provide important details about the sequences. The correlation between two variables, which are traits derived from genetic sequences, is depicted statistically by the SU statistic. It provides a method to estimate how much information one feature carries about another by taking into account both features’ statistical characteristics. The IG then broadens to include, varying the value of various features according to their applicability. The ultimate goal of the model is to classify genomic sequences into a variety of COVID-19-related categories. This suggests that based on the genetic sequences of the viruses, the SVM model can distinguish between distinct viral strains or variants. The block diagram of the proposed COVID-19 variants prediction model is shown in figure 1.
Figure 1: Block diagram of the proposed COVID-19 variants prediction framework
- Data Preprocessing
In the pre-processing stage, the genomic sequence is taken from the dataset and it is pre-processed using the K-mers for converting the DNA sequence into statements. After that the Word2Vec and the label binarizer are utilized for converting the words into vectors and converting the vectors into binary formats respectively.
- Convert DNA sequence into Statement using Adaptive K-mers
The K-mers are short subsequences of fixed length () that are extracted from a longer sequence. In some cases, using a fixed k might not be the most informative approach. Different regions of a sequence might have different functional significance or patterns, and using a single fixed k might miss important information. In adaptive k-mers, the value is allowed to vary or be optimized based on the characteristics of the sequence being analyzed. For instance, an adaptive approach might involve using shorter k-mers in regions of high variability or complexity and longer k-mers in regions with more conserved patterns. This can help to capture different scales of information within the sequence.
The length of the sliding window is equal to the current k-mer, and it was used to divide the DNA sequence S into overlapping k-meters of length ( = 5 is used in this study). The suggested model features improved preprocessing, where sequences are processed using k-mers and turned into English-like statements. Overlapping sequences are produced using a sliding window and stride. A right character is moved at a time to create the next k-mer for DNA sequence S, with windows covering the first bases. Consider the sequence with length , the value of and which can be modified to ,
(1)
It was shown that k-mer embedding, as opposed to the one-hot encoding described in earlier publications, provides a number of benefits for describing input sequences. In comparison to one-hot encoding, it enhances model performance first and decreases computing time and space requirements for model execution second. This is because one-hot encoding encodes each word in a large amount of text data, which might result in a high-dimensional word vector.
Example for k-mers
For the purpose of employing K-mers, a sample DNA sequence (“MESLVPGH”) is obtained here. As a result, the k-mers transform the sequence into the various mer combinations that are displayed below.
MESLV
ESLVP
SLVPG
LVPGH
- Word2vec algorithm
A well-liked word embedding method called Word2Vec renders words as dense vectors in a continuous space. Based on patterns of word co-occurrence in a large corpus of text, it captures connections between words in terms of semantic and syntactic meaning. Each k-mer is mapped into a d-dimensional vector space using the word2vec technique. The Continuous Bag-Of-Words (CBOW) or Continuous Skip-Gram (CSG) algorithms are two that Word2vec may use to produce a distributed representation of words. All of our tests used a CBOW, which can be trained more quickly than a skipgram and performs well when given a lot of training data.
For applications involving natural language processing, such as text categorization, sentiment analysis, and language modelling, the CBOW neural network architecture is utilized. Word2Vec is a neural network-based model for producing word embeddings, and two of its prominent variations are CBOW and Skip-Gram. Although CBOW and Skip-Gram both have advantages and disadvantages, using both simultaneously can often produce even better outcomes.
Although their methods for deriving the result are different, both learning algorithms have input, projection, and output layers. The total of many vectors is stored in the projection layer, which is equivalent to an array of multidimensional vectors. The output layer is the layer that produces the vector results from the projection layer. The output word is predicted by CBOW using other near-word vectors, which makes it comparable to the feedforward Neural Network Language Model (NNLM). The fundamental idea behind CBOW is to forecast word appearances by looking at nearby words. All words are projected by CBOW’s projection layer at the same location; thus, their vectors maintain an average and share their places. The CBOW structure has the benefit of organizing the data spread throughout the data set equally. On the other hand, the Skip-gram displays a framework for deriving vectors of additional words from a single word. Predicting additional words that will come surrounding a certain word is the fundamental idea behind Skip-gram. The words around a word introduced into the input layer are predicted by the Skip-gram’s projection layer. The Skip-gram’s structure demonstrates the benefit of vectorizing when additional words are present. When the data quantity is huge, the CBOW is quicker and more appropriate compared to Skip-gram, while Skip-gram performs better compared to CBOW when learning new words.
A more potent word embedding model may be produced by combining the Continuous Bag of Words and Skip-Gram versions. The CBOW-SkipGram model is an effective tool for problems involving natural language processing because it can capture both the semantic connections between frequently occurring words and the contexts of uncommon words.
The CBoW and Skipgram are two versions, and they both use a single hidden layer neural network that has been trained to predict a target word from its context words, with CBoW using the opposite strategy as its target word prediction method and Skipgram using the opposite strategy.
- Label Binarizer
Label Binarizer is a method for converting binary vectors of category labels or target variables. Label Binarizer is frequently used in the context of classification tasks, where the output is a set of discrete class labels, to convert these labels into a binary format appropriate for machine learning methods.
In order to acquire extremely effective feature learning, sequence data is then encoded using Label Binarizer by turning the sequences into an array of integers. The following is a sequence encoding example.
| M | 1 |
| E | 2 |
| S | 3 |
| L | 4 |
| V | 5 |
LabelBinarizer creates a single warm representation from a collection of string labels. If a value would ordinarily be given to the value 0, it is assigned to the values in one warm representation as 1. In a later stage of pre-processing, the tokenizer function from the Keras library is used to turn each character in the sequence into a number. Additionally, for correct processing, the length of each sequence is standardized. The character limit for this text is 256. After the K-mers are created, the features present in the statements are extracted using the feature extraction techniques.
- Feature Extraction (FE)
Feature extraction techniques aim to extract a compact and informative representation of the data, enabling efficient storage, transmission, and processing. By condensing the data into a smaller set of meaningful features, feature extraction facilitates the handling of large datasets and enhances computational efficiency.
- Sequential FE
The sequential features are extracted using the techniques like reliefF algorithm, symmetric uncertainty and information gain.
- ReliefF Algorithm
The collected features are extracted into a more manageable subset by using the ReliefF approach. In order to choose effective hybrid features, the ReliefF feature extraction approach was used in this study. The study of feature extraction is important for both machine learning and data mining. In several feature extraction applications, the ReliefF method, one of the most important feature extraction algorithms, produces successful results. By creating ReliefF, the Relief statistical model has been improved. The Relief technique performs the feature extraction process using a sample from the dataset by creating a model based on the relevant sample’s distance from samples from other classes and its proximity to samples from those classes. The following describes how the ReliefF algorithm chooses features:
(1) From the original feature set, sample S is first chosen at random.
(2) The sample subset H is made up of samples k that are selected using the closest neighbour method according to the samples with a similar labelling as the sample.
(3) The sample subset M is formed by determining samples k from the sample with various labels one at a time in accordance with the closest neighbour concept.
(4) Determine the weight W(N) of each N feature. The weight coefficient update formula for the ReliefF method is given in Eq. (2) as follows:
(2)
Where The percentage of samples in the training set that fall within category C is represented by , and the percentage of samples that fall into the same category as sample . if N is continuous.
(3)
if N is discrete
(4)
The values of feature N on samples and are represented by and , respectively. The aforementioned procedure is repeated m times in order to choose m random samples. In the end, filter the characteristics whose weights correspond to the computed features and are below the predetermined threshold.
- Symmetric Uncertainty
The pair-wise similarity between actual and Covid-19 variants are evaluated in this work using SU, an information entropy-based technique. A system’s level of disorder or uncertainty is measured by Shannon’s information entropy. As a result, it may be used to assess how much information, such as irregularity, complexity, etc., is present in a time-series. By means of the concept of mutual information (MI), this information entropy capacity may be used to the evaluation of comparison between two consecutive series. The MI is a calculation of the amount of data shared by two variables. The MI may be calculated using the following formula if and are, respectively. The distribution functions of the measured and grid-based data, and is the distribution function that combines the data.
(5)
Entropy may be utilized in Eq. (8) to estimate MI since it is intuitively understood to represent the amount of information included in a distribution. The MI may be defined as the variance between the entropy of the time series being studied (gridded data) and the sum of the entropies of the actual and gridded time series as a function of information entropy,
(6)
In this case, H(y|x) denotes the level of uncertainty that persists in gridded time series following knowledge of the observed time series and where the denotes the level of uncertainty in gridded time series,. As a result, Once the gridded time series has been learned from the observed time series, a lower MI and a higher value of indicate increased uncertainty. Measured and gridded data were compared in this experiment using MI to see whether there was any informative overlap. If no exchanged data exists, then the MI is 0; however, if the details from the gridded data can completely explain the knowledge from the data being collected, then the MI is 1. The time series with a higher number of values was discovered to be influenced by the MI, despite the fact that it is less similar to the input data. Additionally, even if are tightly related, a little variation between them might result in a high value for and a low MI. This disadvantage can be solved by the SU when the predicted IG is split by the entropy sum of , as in Eq. (7):
(7)
The values fall into the 0 to 1 range, with 1 denoting perfect resemblance between the observed and gridded timeseries.
- Information gain
Information acquisition is carried out via a decision tree with good categorization performance. In the field of machine learning, it is a widely used entropy-based measure. The statistical distribution of feature weights in information gain is based on correlations between characteristics and categories. Eq. (8), which calculates the entropy of the dataset.
Every characteristic in the data categorization system contributes to the information gain (IG). The (q = 1, 2,…, p) attribute of the dataset is represented by . The appropriate conditional entropy is for the property is:
(8)
Where is the value of the k-valued attribute, p(aqj) is the categorical variable C’s prior probability. The conditional probability of the variable C after the fixation of the attribute is denoted by the expression . According to the following formula, the difference between represents the amount of information gain of the attribute :
(9)
A larger information gain often denotes the feature’s importance for categorization.
- Objective Function
Finding the ideal feature subset, which is what feature selection aims to achieve for a given dataset, with the least number of features and the maximum classification accuracy. When it comes to categorization performance, these two indications each have a distinct effect. Once they have been combined into a single weighted indicator, the same fitness function should be used:
(10)
Where T stands for the total number of characteristics and N for the number of attributes that were chosen. Here, and have values of 1 and 0.001, respectively. The KNN classifier’s classification accuracy is shown by the term acc(classifier), which may be calculated using Eq. (11).
(11)
The numbers and represent the number of instances that were incorrectly and correctly classified, respectively. The goal of the fitness value is to have the characteristics chosen have the maximum classification accuracy and the fewest features feasible.
- Statistical FE
Statistical features, commonly referred to as descriptive statistics, are numerical values obtained from data that reveal details like its distribution, central tendency, variability, and other crucial properties. These characteristics succinctly and quantitatively summarize and characterize the data. Here are a few typical statistical traits:
- Harmonic Mean
According to its definition, the HM is the reciprocal of the average of the reciprocals of the data values. It has a strict definition and is based on all of the observations. In order to achieve proper value balance, harmonic mean gives smaller values more weight and larger values less weight. The HM of the series is given in Eq. (12),
(12)
Where n is the number of total elements in the series.
- Median
Utilizing the median, which displays the middle value in an ordered set of data, is another method for describing central tendency. The median separates the data into two equal sections, with half of the numbers dropping lower and the other half rising above it. Compared to the mean, the median is more resilient to outliers—extremely high or low figures. The median is distinguished in Eq. (13),
(13)
Where “” denotes the series’ final number.
- Standard Deviation (SD)
A measurement of the data’s dispersion from the mean is referred to by the abbreviation SD (). The data are believed to be grouped around the mean whenever the standard deviation is minimal, but when it is high, the data are widely spread. The SD is shown in Eq. (14),
( (14)
When N is the total number of input variables, represents the input variable, and represents the mean value.
- SACO based Feature Selection
In the SACO approach, coatis are viewed as constituents of this algorithm’s population, which is a population-based metaheuristic. Values for the decision variables are determined by each coati’s location inside the search area. The SACO’s inclusion of coatis as a consequence offers a potential solution to the problem. At the beginning of the SACO implementation, Eq. (15) is utilized to randomly initialize the coatis’ position in the search space.
(15)
Where denotes the location of the coati in the search space, denotes the number of decision variables, denotes the value of the decision variable, denotes the number of coatis, denotes a random real number in the range [0, 1], and and denote the lower bound and upper bound of the decision variable, respectively. The population matrix, which is represented mathematically by the following matrix X, represents the coati community in the SACO,
(16)
The placement of potential solutions in decision factors leads to the evaluation of various values for the desired function of the issue. These values are displayed when Eq. (17) is used.
(17)
Where is the vector of the achieved target function and Fi is the measurement of the newly obtained objective variable based on the coati. When using metaheuristic methods, such as the one proposed for SACO, the value of the goal function acts as a standard for the quality of potential solutions. Therefore, the best population individual is the one whose assessment yields the highest value for the target function. Every time the algorithm iterates, the algorithm updates the candidate solutions, updating the most qualified member of the population.
- Mathematical model of COA
Modelling two of the coatis’ natural behaviours forms the basis of the process of revising the location of coatis (candidate solutions) in the SACO. These actions include (i) the tactics used by coatis to assault preys and (ii) the ways in which they flee from predators. As a result, there are two periods of updating the SACO population.
Phase 1: Levy based exploration phase
Applying a computerized model of their prey-attacking strategies, the coati density in the search region is first updated. Several coatis mount the tree in this technique to approach and frighten a target. While they wait behind a tree, more coatis congregate around the prey when it hits the ground. When the prey lands, the coatis attack and pursue it. By employing this technique, coatis are able to go to various regions within the search region, demonstrating the SACO’s capability for extensive search within the field of solving issues.
The SACO design believes that the prey is the population’s finest member. On top of that, it’s thought that half of the coatis climb the tree whereas the other half awaits for the prey to drop to the ground. A random search method based on the Levy flight distribution is therefore added to mimic the coatis’ position as they emerge from the tree in order to avoid falling victim to local optima traps, which is defined in Eq. (18).
(18)
and j=1,2,….,m, the Levy flight process is denoted by the symbol . Employing this Levy random walk approach, a new offspring solution is created and, if it has a higher fitness score, it is utilised to replace the original solution. This Levy operation demonstrates excellent search capability in navigating an uncharted vast search region.
The prey is dropped to the ground and then positioned at random inside the search area. Using Eq. (19) and Eq. (20) to mimic the search space, Using this arbitrary position as a guide, coatis on the ground migrate.
(19)
(20)
For
If each coati’s new position raises the objective function’s value, the update mechanism will accept it; otherwise, the search agent will stay in its former position. The Easom function is introduced in the position updating while the fitness function is greater than the fitness of the prey. The Easom function is a mathematical function commonly used for optimization and testing optimization algorithms. The Easom function is defined as follows:
(21)
The function’s global minimum is found at , where its value is -1. Because it contains a single global minimum at and a remarkably deep, narrow valley leading to it, the Easom function is frequently used as a benchmark issue for evaluating optimization techniques. This update condition is for the simulated values of provided by Eq. (22).
(22)
Where is the updated position of the coati at dimension, is its fitness value, using the exploitation phase of SACO, is its dimension, is a random variable and ranges between [0, 1].
In reality, the position of the best member is represented by the iguana, which represents the prey’s positioning in the search area. is its dimension; is an integer chosen at random from the range of [1, 2]. The randomly created position of the prey on the earth is indicated by the variable and is its dimension, is its value of the objective function, and ⌊·⌋ is the floor function.
Phase 2: Inertia weight-based exploitation phase
Coatis’ natural behaviour while coming across and evading predators is used as the basis for the mathematical modelling of the second step in the procedure for upgrading coatis’ location in the search space. A coati runs away from the area where a predator is attacking it. The SACO’s possibility of local search exploitation is illustrated by Coati’s activities in this method, which lead to it being in a secure area close to its present position. The trade-off between global and local exploitation is influenced by inertia weight. For the purpose of modelling this conduct, a random position is produced based on Eq. (23) and Eq. (24), close to the location where each coati is positioned.
(23)
(24)
Where and j=1,2,….,m, is the inertia weight, and it can be expressed as,
Where refers to maximum number of iteration and is the current iteration. The experimental analysis in Eq. (24) showed that a higher is good for exploration while a smaller is beneficial to exploitation. In order to balance these two characteristics of exploration and exploitation, it is essential to choose the inertia weight value. Exploration is encouraged by a high inertia weight, which aids in escaping local optima, whereas exploitation is encouraged by a low inertia weight, which concentrates on perfecting local solutions.
If the objective function’s value increases, the newly predicted position is appropriate, which this condition replicates using Eq. (25).
(25)
Where is the updated position of the coati at dimension, is its fitness value, using the exploitation phase of SACO, is its dimension, and are the lower and upper bound of the local decision variable respectively, and are the lower bound, is the iteration count, and upper bound of the decision variable, respectively.
- Coronavirus variant Classification using SVM
In SVM, a function (hyperplane) is used to execute the classification operation on a data set. In order to concurrently get the best response (an ideal hyperplane), the margin should be increased and the quantity of improperly categorized data should be decreased, as illustrated in Figure 2.
Figure 2: Structure of the basic SVM
The balance between margin and improperly categorized data is controlled by the C parameter, also known as the penalty parameter in Eq. (26).
(26)
(27)
Where a mapping function () that maximizes the separation between the hyperplane and the closest point in the sample data, he weight vector’s second term is indicated by the symbol the punishment parameter is shown by (C), while the degree of data infringement from the associated margin is indicated by (ξ). (, ) is a data sample in the second section, where is connected to data categorization and are, respectively, vectors of weight and bias. From zero to infinity, ‘s value is possible. A big number for causes the model’s error on the training data to drop, this results in the taught machine performing the identical task less generally. If C is a small number, the penalty for mistakes is now minimized. Because the SVM precludes any imperfection in the training set, the final model is complicated if C is arbitrarily high. On the other hand, the model is less difficult when goes to zero since the findings can tolerate significant quantities of error. Based on the aforementioned problems, Reduce the quantity of data that are mistakenly categorized (minimize empirical risk) while also increasing the spacing of data from the hyperplane in order to minimize structural risk, which lowers model error on training data and improves generalization on test data.
The kernel operation moves the used data to a feature region with more dimensions where the linear model may be extended, increasing the computational efficiency of the linear learning machines thus far investigated. A linear function is used in the feature space to conduct the separation of the data, which is seen to be impossible in the input space. As a result, the choice function or goal function is expressed in Eq. (28) as the linear function below:
(28)
The dual display variant of linear learning machines is used to rewrite this Eq. (29) as follows:
(29)
The mapping function and the Lagrangian component are both present in this equation. When the training values and test values are internally multiplied, the decision function is shown as the result. The kernel function is a function that may be compared to the result of internal multiplication (). With this parameter, a nonlinear model may be extended in accordance with Eq. (30) and Eq. (31) by performing linear machine training after mapping the input region to the feature space.
(30)
(31)
where stands for the kernel function and the function is used to determine categorization. The ideal bias vector and Lagrangian coefficient values are and . Additionally, the data are in test mode. The objective of this work is to identify the appropriate (penalty factor) and (kernel operation) parameters for estimating and categorizing the coronavirus variants.
- Result and discussion
In this section, the performance of the proposed SACO-SVM model is evaluated with the help of the performance metrics. Then these results are compared with the existing techniques. The dataset is used for evaluation and the implementation is performed in the Python platform.
4.1. Overall comparison of the proposed model
The table 1 provides a comparison of different metrics for four different methods or algorithms: PSO (Particle Swarm Optimization), GA (Genetic Algorithm), MFO (Moth Flame Optimization), and a proposed method. These metrics are often used to evaluate the performance of classification or prediction models, typically in a binary classification context.
Table 1: Comparison of the existing and proposed techniques
| Metrics | PSO | GA | MFO | PROPOSED |
| Accuracy | 0.9075 | 0.9510 | 0.9230 | 0.9650 |
| Precision | 0.8693 | 0.9432 | 0.9686 | 0.9571 |
| Sensitivity | 0.9539 | 0.9590 | 0.8743 | 0.9731 |
| Specificity | 0.8618 | 0.9431 | 0.9710 | 0.9570 |
| F-Measure | 0.8802 | 0.9214 | 0.8920 | 0.9349 |
| MCC | 0.8696 | 0.9452 | 0.8701 | 0.9899 |
| NPV | 0.9074 | 0.9128 | 0.8433 | 0.9494 |
| FPR | 0.0259 | 0.0276 | 0.0212 | 0.0206 |
| FNR | 0.0069 | 0.0059 | 0.0044 | 0.0036 |
In the provided table, four different methods or algorithms, namely PSO, GA, MFO, and a proposed method, are evaluated using various performance metrics in a binary classification context. The proposed method stands out with the highest accuracy (96.5%), indicating that it correctly classifies the most instances. It also demonstrates strong precision (95.71%) and sensitivity (97.31%), meaning it makes accurate positive predictions and identifies actual positive instances effectively. Furthermore, the proposed method achieves a high Matthews Correlation Coefficient (MCC) of 0.9899, signifying excellent overall performance while maintaining low rates of false positives (FPR) and false negatives (FNR). These results collectively suggest that the proposed method excels in binary classification tasks, offering a balanced trade-off between precision and recall, making it a promising choice for the task at hand.
- Accuracy
This metric measure how well the model correctly classified both the positive and negative instances. An accuracy of 0.9650 indicates that the proposed method achieved an accuracy rate of 96.50%, meaning it correctly classified approximately 96.50% of the cases in the dataset. Figure 3 compares the accuracy of the proposed model and the existing techniques.

Figure 3: Comparison of the accuracy metric
- Precision
Precision indicates how many of the positive predictions made by the model were correct. A precision of 0.9571 means that about 95.71% of the cases predicted as positive by the proposed method were true positives. The precision values are compared in figure 4.
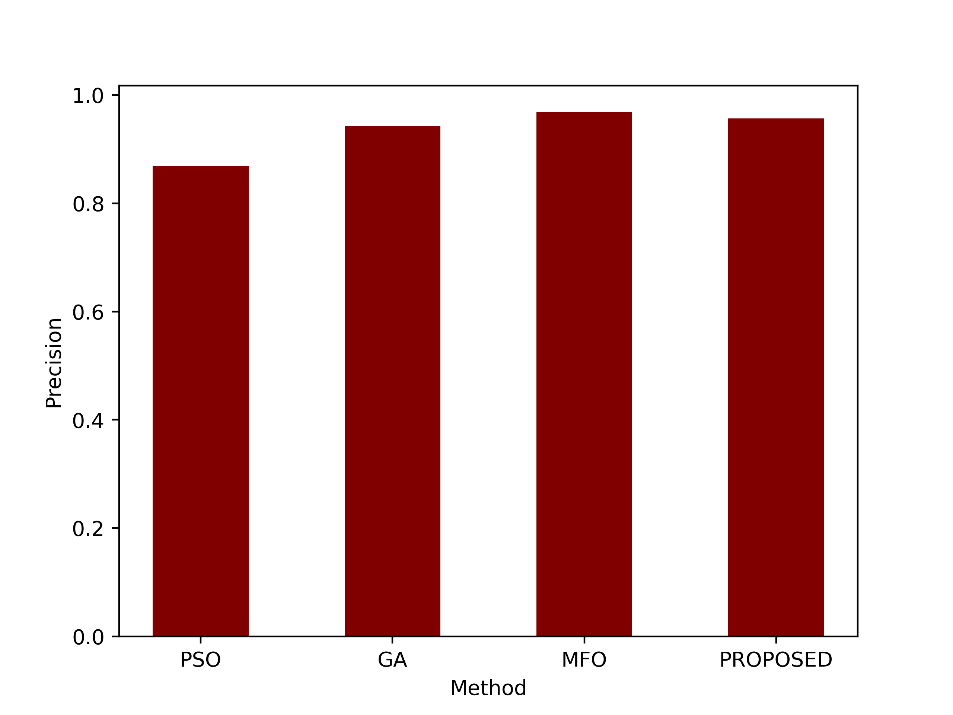
Figure 4: Comparison of the precision metric
- Sensitivity
Sensitivity measures the model’s ability to correctly identify positive instances out of all actual positive instances. A sensitivity of 0.9731 indicates that the proposed method correctly identified approximately 97.31% of the actual positive cases. Sensitivity values of the proposed and the existing PSO, GA and MFO are shown in figure 5.
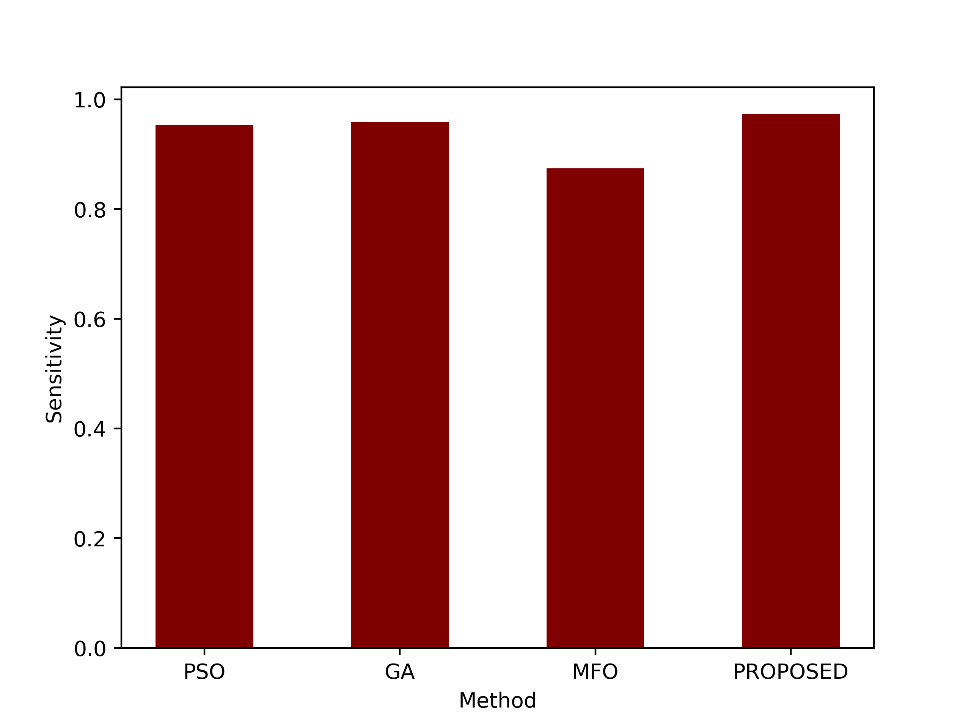
Figure 5: Comparison of the sensitivity metric
- Specificity
Specificity measures the model’s ability to correctly identify negative instances out of all actual negative instances. A specificity of 0.9570 means that the proposed method correctly identified approximately 95.70% of the actual negative cases. Figure 6 displays the proposed and current PSO, GA, and MFO’s specificity values.
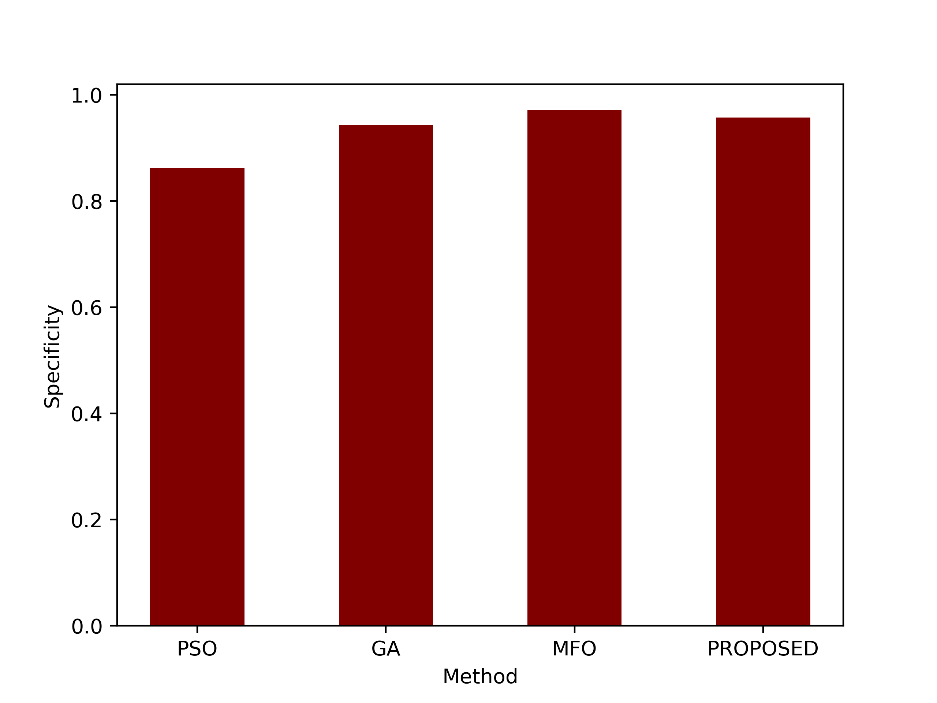
Figure 6: Comparison of the specificity metric
- F- Measure
The F-Measure is the harmonic mean of precision and sensitivity. It provides a single value that balances both precision and recall (sensitivity). An F-Measure of 0.9349 suggests a good balance between precision and recall for the proposed method. Figure 7 compares the graphical comparison of the F-Measure values.
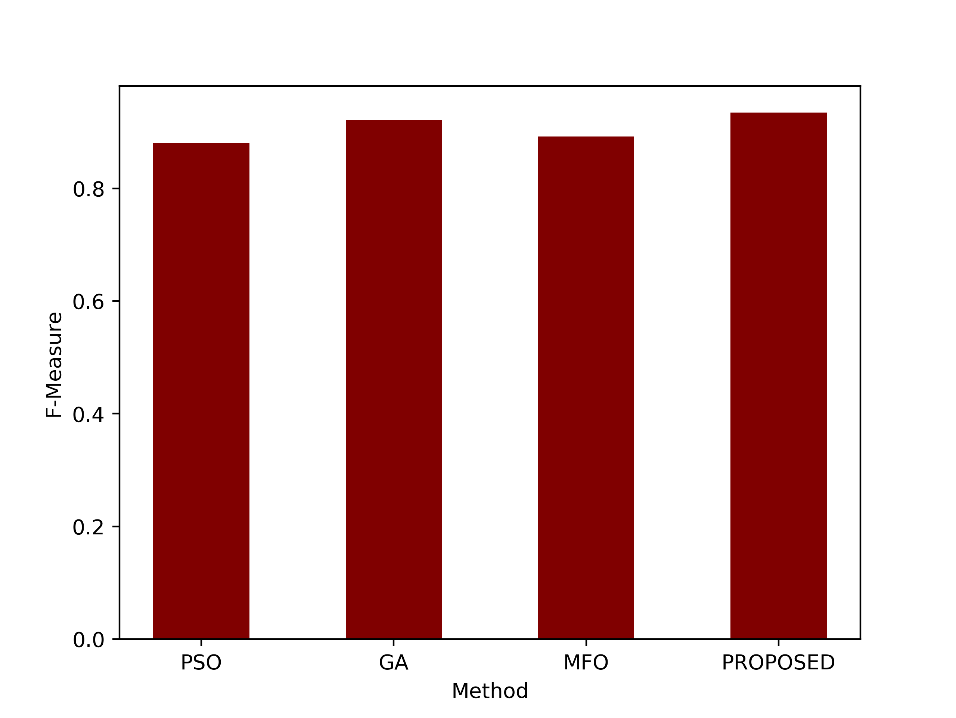
Figure 7: Comparison of the F-Measure metric
- NPV
NPV measures the proportion of true negative predictions out of all negative predictions made by the model. An NPV of 0.9494 means that approximately 94.94% of the cases predicted as negative by the proposed method were true negatives. Figure 8 illustrates the graphical representation of the proposed and the existing techniques.
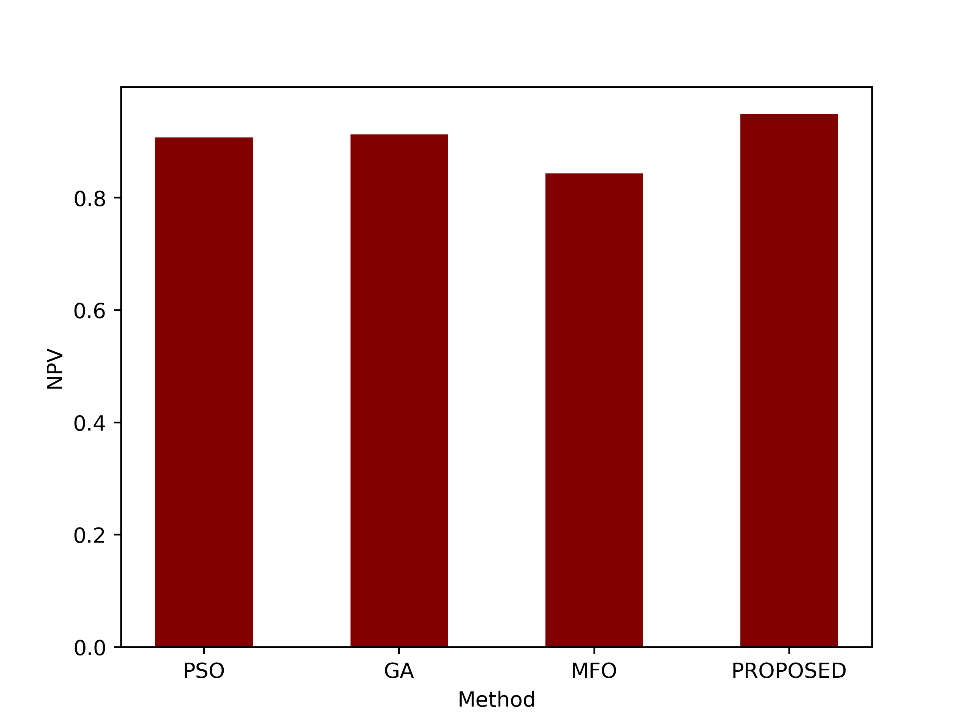
Figure 8: Comparison of the NPV metric
- MCC
MCC measures the correlation between the predicted and actual classifications, accounting for both true and false positives and negatives. An MCC of 0.9899 indicates a very strong correlation between the predictions and actual classifications, suggesting excellent model performance. The MCC values of proposed and the existing techniques are compared in figure 9.
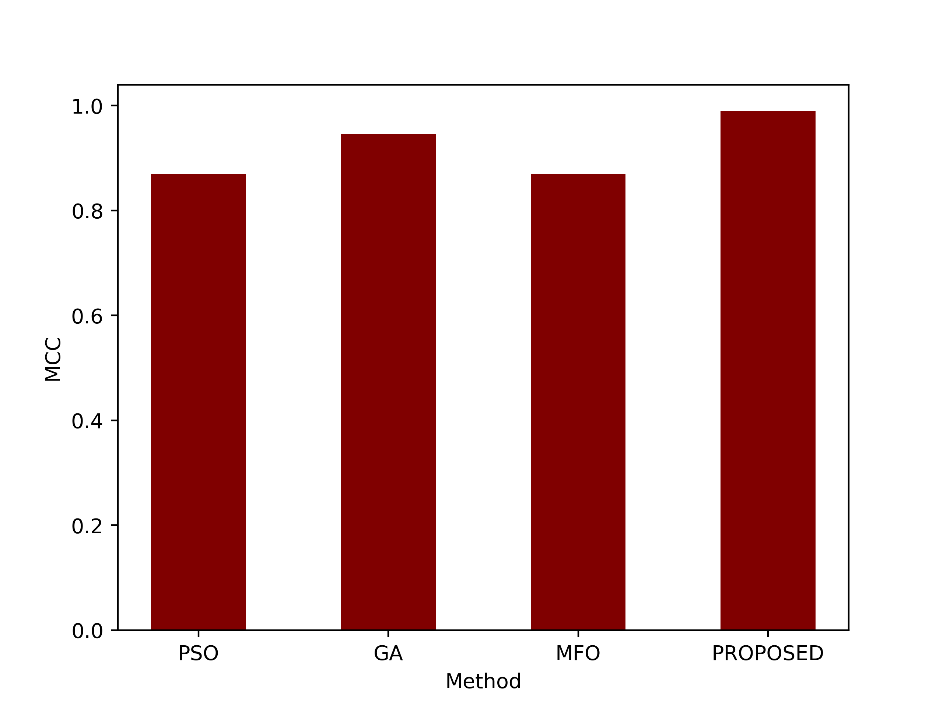
Figure 9: Comparison of the MCC metric
- FNR
FNR measures the proportion of false negative predictions out of all actual positives. An FNR of 0.0036 indicates a very low rate of false negatives, suggesting that the proposed method rarely missed positive cases. The FNR values are shown as a graph in figure 10.
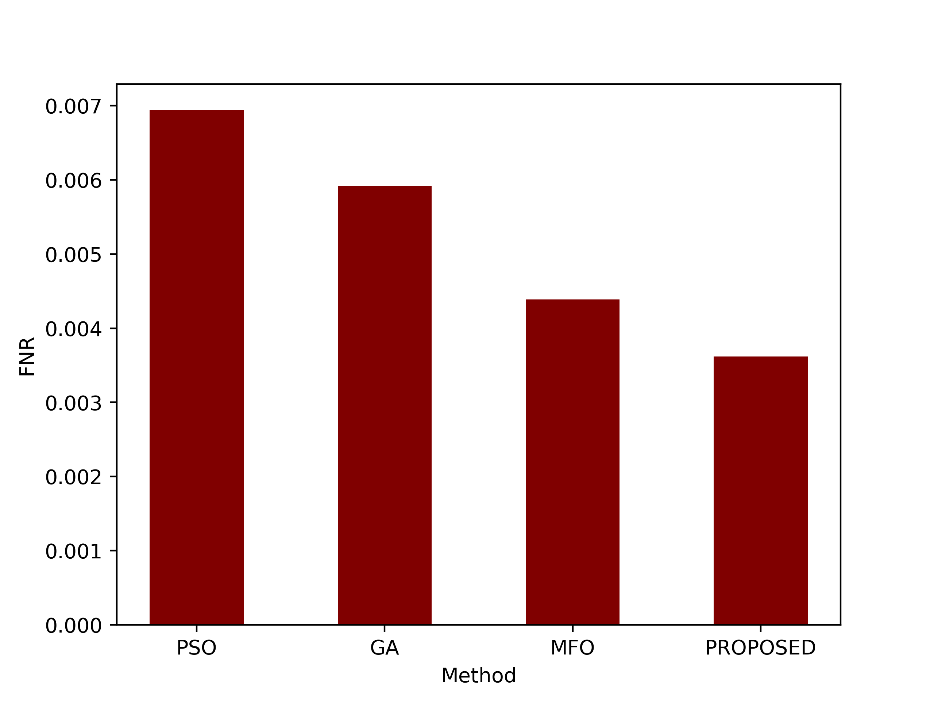
Figure 10: Comparison of the FNR metric
- FPR
FPR calculates the proportion of false positive predictions out of all actual negatives. An FPR of 0.0206 suggests a relatively low rate of false positive predictions by the proposed method. Figure 11 shown the graphical comparison of the FPR values.
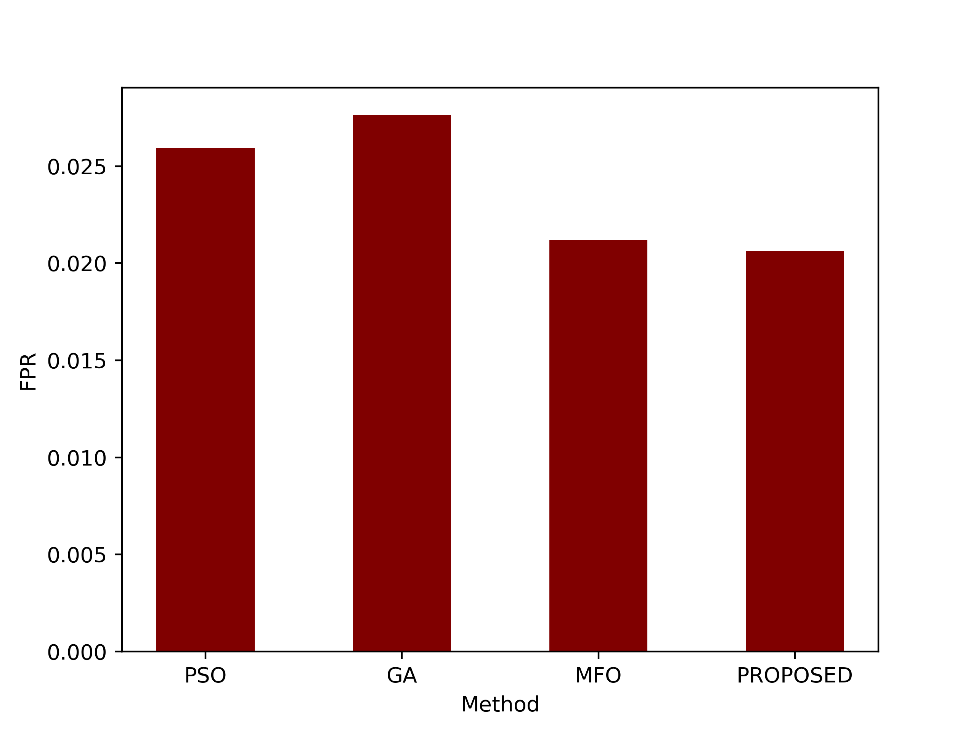
Figure 11: Comparison of the FPR metric
The confusion matrix for the proposed model is shown in figure 12.
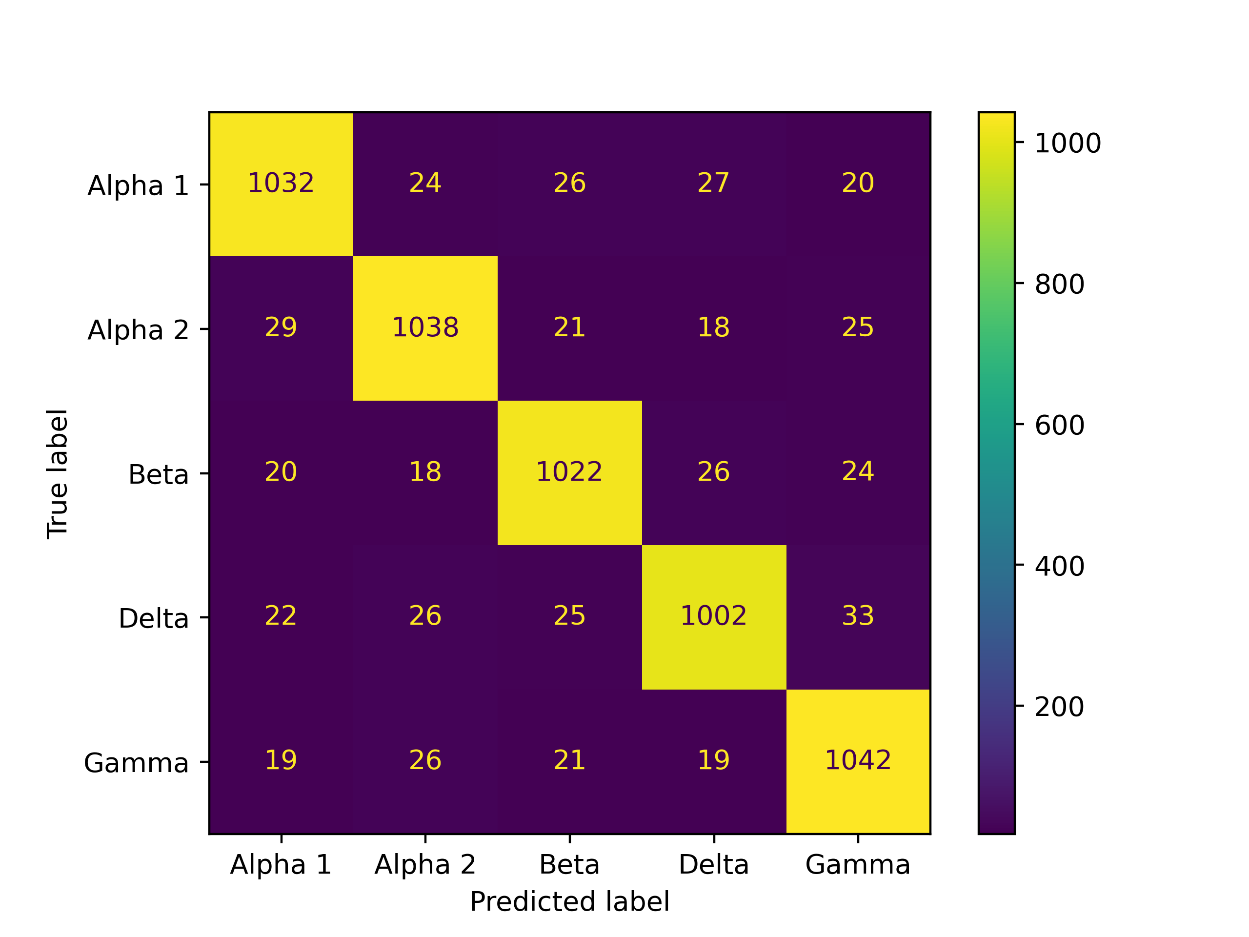
Figure 12: Confusion matrix of the proposed Covid-19 variant prediction
Conclusion
In conclusion, the suggested strategy represents a significant development in the field of predicting variants of the Coronavirus. It provides a thorough and remarkably precise strategy for categorizing the SARS-CoV-2 variations by integrating a range of efficient feature extraction methods with cutting-edge preprocessing strategies. Genetic data may be thoroughly evaluated by combining sequential and statistical feature extraction techniques with K-mers to convert DNA sequences into statements. This technique is useful in a number of situations since it enhances feature learning and allows for different K-mer sizes. By employing the Word2Vector method to encode K-mer words as feature vectors together with statistical feature extraction techniques like Harmonic Mean, Median, Standard Deviation, and others, a high level of classification accuracy is also attained.
As a significant advancement above conventional techniques, the SACO algorithm for feature selection has been introduced. Because SACO is self-adaptive and is based on Levy methods, the Easom Function, and Inertial Weighting, it is a solid option for maximising feature selection in the context of coronavirus variant classification. The SVM used by the model to classify data assures the accuracy and precision of variant prediction in real-world applications. Together, this research lays the path for more precise and knowledgeable decisions to be made about managing and controlling SARS-CoV-2 variations, which is crucial in the continuing fight against the COVID-19 pandemic.
Reference
- Lai, C.C., Shih, T.P., Ko, W.C., Tang, H.J. and Hsueh, P.R., 2020. Severe acute respiratory syndrome coronavirus 2 (SARS-CoV-2) and coronavirus disease-2019 (COVID-19): The epidemic and the challenges. International journal of antimicrobial agents, 55(3), p.105924.
- Abd El-Aziz, T.M. and Stockand, J.D., 2020. Recent progress and challenges in drug development against COVID-19 coronavirus (SARS-CoV-2)-an update on the status. Infection, Genetics and Evolution, 83, p.104327.
- Joly, B.S., Siguret, V. and Veyradier, A., 2020. Understanding pathophysiology of hemostasis disorders in critically ill patients with COVID-19. Intensive care medicine, 46(8), pp.1603-1606.
- El-Sheekh, M.M. and Hassan, I.A., 2021. Lockdowns and reduction of economic activities during the COVID-19 pandemic improved air quality in Alexandria, Egypt. Environmental Monitoring and Assessment, 193, pp.1-7.
- De Bruin, Y.B., Lequarre, A.S., McCourt, J., Clevestig, P., Pigazzani, F., Jeddi, M.Z., Colosio, C. and Goulart, M., 2020. Initial impacts of global risk mitigation measures taken during the combatting of the COVID-19 pandemic. Safety science, 128, p.104773.
- Ura, T., Yamashita, A., Mizuki, N., Okuda, K. and Shimada, M., 2021. New vaccine production platforms used in developing SARS-CoV-2 vaccine candidates. Vaccine, 39(2), pp.197-201.
- Chavda, V.P., Vora, L.K., Pandya, A.K. and Patravale, V.B., 2021. Intranasal vaccines for SARS-CoV-2: From challenges to potential in COVID-19 management. Drug discovery today, 26(11), pp.2619-2636.
- Oberemok, V.V., Laikova, K.V., Yurchenko, K.A., Marochkin, N.A., Fomochkina, I.I. and Kubyshkin, A.V., 2020. SARS-CoV-2 will constantly sweep its tracks: a vaccine containing CpG motifs in ‘lasso’for the multi-faced virus. Inflammation Research, 69(9), pp.801-812.
- Rohaim, M.A., El Naggar, R.F., Clayton, E. and Munir, M., 2021. Structural and functional insights into non-structural proteins of coronaviruses. Microbial pathogenesis, 150, p.104641.
- Naqvi, A.A.T., Fatima, K., Mohammad, T., Fatima, U., Singh, I.K., Singh, A., Atif, S.M., Hariprasad, G., Hasan, G.M. and Hassan, M.I., 2020. Insights into SARS-CoV-2 genome, structure, evolution, pathogenesis and therapies: Structural genomics approach. Biochimica et Biophysica Acta (BBA)-Molecular Basis of Disease, 1866(10), p.165878.
- Li, Y., Wei, L., He, L., Sun, J. and Liu, N., 2022. Interferon-induced transmembrane protein 3 gene polymorphisms are associated with COVID-19 susceptibility and severity: a meta-analysis. Journal of Infection, 84(6), pp.825-833.
- Mukherjee, S., Bhattacharyya, D. and Bhunia, A., 2020. Host-membrane interacting interface of the SARS coronavirus envelope protein: Immense functional potential of C-terminal domain. Biophysical chemistry, 266, p.106452.
- Dharmaraj, S., Ashokkumar, V., Hariharan, S., Manibharathi, A., Show, P.L., Chong, C.T. and Ngamcharussrivichai, C., 2021. The COVID-19 pandemic face mask waste: a blooming threat to the marine environment. Chemosphere, 272, p.129601.
- Simon, M., Veit, M., Osterrieder, K. and Gradzielski, M., 2021. Surfactants–compounds for inactivation of SARS-CoV-2 and other enveloped viruses. Current Opinion in Colloid & Interface Science, 55, p.101479.
- Aslani, M., Mortazavi-Jahromi, S.S. and Mirshafiey, A., 2021. Cytokine storm in the pathophysiology of COVID-19: Possible functional disturbances of miRNAs. International Immunopharmacology, 101, p.108172.
- Radzikowska, U., Eljaszewicz, A., Tan, G., Stocker, N., Heider, A., Westermann, P., Steiner, S., Dreher, A., Wawrzyniak, P., Rückert, B. and Rodriguez-Coira, J., 2023. Rhinovirus-induced epithelial RIG-I inflammasome suppresses antiviral immunity and promotes inflammation in asthma and COVID-19. Nature communications, 14(1), p.2329.
- Lai, W., Mo, J., Yin, J., Lyu, C. and Wang, H., 2019. Profiling of epigenetic DNA modifications by advanced liquid chromatography-mass spectrometry technologies. TrAC Trends in Analytical Chemistry, 110, pp.173-182.
- Wang, X.X., Zhu, L.J., Li, S.T., Zhang, Y.Z., Liu, S.Y., Huang, K.L. and Xu, W.T., 2021. Fluorescent functional nucleic acid: Principles, properties and applications in bioanalyzing. TrAC Trends in Analytical Chemistry, 141, p.116292.
- Younis, I., Longsheng, C., Zulfiqar, M.I., Imran, M., Shah, S.A.A., Hussain, M. and Solangi, Y.A., 2021. Regional disparities in Preventive measures of COVID-19 pandemic in China. A study from international students’ prior knowledge, perception and vulnerabilities. Environmental Science and Pollution Research, 28, pp.40355-40370.
- Swayamsiddha, S., Prashant, K., Shaw, D. and Mohanty, C., 2021. The prospective of artificial intelligence in COVID-19 pandemic. Health and Technology, pp.1-10.
- Nawaz, M.S., Fournier-Viger, P., Shojaee, A. and Fujita, H., 2021. Using artificial intelligence techniques for COVID-19 genome analysis. Applied Intelligence, 51, pp.3086-3103.
- Ahmed, I. and Jeon, G., 2022. Enabling artificial intelligence for genome sequence analysis of COVID-19 and alike viruses. Interdisciplinary sciences: computational life sciences, 14(2), pp.504-519.
- Dey, L., Chakraborty, S. and Mukhopadhyay, A., 2020. Machine learning techniques for sequence-based prediction of viral–host interactions between SARS-CoV-2 and human proteins. Biomedical journal, 43(5), pp.438-450.
- Pathan, R.K., Biswas, M. and Khandaker, M.U., 2020. Time series prediction of COVID-19 by mutation rate analysis using recurrent neural network-based LSTM model. Chaos, Solitons & Fractals, 138, p.110018.
- Wang, B. and Jiang, L., 2021. Principal component analysis applications in COVID-19 genome sequence studies. Cognitive computation, pp.1-12.
- Saha, I., Ghosh, N., Maity, D., Sharma, N., Sarkar, J.P. and Mitra, K., 2020. Genome-wide analysis of Indian SARS-CoV-2 genomes for the identification of genetic mutation and SNP. Infection, Genetics and Evolution, 85, p.104457.
- Arslan, H., 2021. COVID-19 prediction based on genome similarity of human SARS-CoV-2 and bat SARS-CoV-like coronavirus. Computers & Industrial Engineering, 161, p.107666.
- Singh, O.P., Vallejo, M., El-Badawy, I.M., Aysha, A., Madhanagopal, J. and Faudzi, A.A.M., 2021. Classification of SARS-CoV-2 and non-SARS-CoV-2 using machine learning algorithms. Computers in biology and medicine, 136, p.104650.
- Paul, T., Vainio, S. and Roning, J., 2022. Detection of intra-family coronavirus genome sequences through graphical representation and artificial neural network. Expert Systems with Applications, 194, p.116559.
- Tarique, M., Ahmad, S., Malik, A., Ahmad, I., Saeed, M., Almatroudi, A., Qadah, T., Murad, M.A., Mashraqi, M., Alam, Q. and Al-Saleh, Y., 2021. Novel severe acute respiratory syndrome coronavirus 2 (SARS-CoV2) and other coronaviruses: a genome-wide comparative annotation and analysis. Molecular and Cellular Biochemistry, 476, pp.2203-2217.
Cite This Work
To export a reference to this article please select a referencing stye below:

Academic Master Education Team is a group of academic editors and subject specialists responsible for producing structured, research-backed essays across multiple disciplines. Each article is developed following Academic Master’s Editorial Policy and supported by credible academic references. The team ensures clarity, citation accuracy, and adherence to ethical academic writing standards
Content reviewed under Academic Master Editorial Policy.


