Abstract
In the context of smart cities, ensuring safety and security is paramount, and the increasing deployment of surveillance cameras presents both an opportunity and a challenge. This paper introduces an automated Crime Anomaly Detection System (CADS) that harnesses the capabilities of Deep Learning (DL) and computer vision to address this challenge. CADS follows a systematic workflow, starting with the collection of video data from smart city surveillance cameras. It then employs a series of preprocessing steps, including video-to-frame conversion, noise reduction using the Sobel Filter, and contrast enhancement via contrast stretching. Segmentation is achieved through optimized Region-based Convolutional Neural Networks (ORCNN), which identify Regions of Interest (ROIs) within frames. These ROIs serve as the focal points for feature extraction, which encompasses a diverse set of techniques such as Scale-Invariant Feature Transform (SIFT), Histogram of Oriented Gradients (HOG), Speeded-Up Robust Features (SURF), Zernike Moments, and Binary Robust Invariant Scalable Key points (BRISK). Then, the DL model with Siamese-based Convolutional Networks (SCN) is also used to extract the segmented images’ features. These two types of features are concatenated and given to feature selection. To refine the extracted features, CADS introduces a hybrid feature selection approach that combines White Shark Optimizer (WSO) and Squirrel Search Algorithm (SSA) called Hybrid Squirrel updated White Shark Optimization (HSWSO). The selected features are given to Optimized Recurrent Neural Networks (ORNNs) to accurately identify and classify criminal activities, including abnormal behaviour, theft, and violence.
Introduction
Video surveillance has drawn a lot of attention in our daily lives due to the steadily growing demand for protection for people and their possessions. The administration and monitoring of public zones may be done more safely and securely due to video surveillance systems. Observation recordings can particularly pick up a variety of real-world anomalies [1,2]. The authorities can be informed of such unusual events so they can respond immediately when they are discovered. As a result, an important problem that has been researched in a number of application sectors is the automated identification of abnormalities. In terms of crime detection, this paper presents an overview of numerous techniques used to identify actual abnormalities in video surveillance [3,4,5]. Anomalies, often known as outliers, are data points that do not fit the definition of normal behaviour. The term “anomaly detection” refers to the identification of anomalous activity or events that deviate from normal behaviour. The importance of finding anomalies comes from the fact that data anomalies may be translated into information that can be applied to or used in a variety of application fields [6,7,8]. Considering that complex systems have several moving parts that constantly redefine what constitutes “standard” performance, a new proactive strategy is needed to identify abnormal behaviour.
In order to increase public safety, surveillance cameras are often employed more and more in public spaces, such as roads, stores, shopping malls, and sidewalks. However, the capacity of law enforcement agencies for monitoring has not kept up [9,10,11]. As a result, the usage of surveillance cameras and an inefficient camera-to-human monitor ratio provide a glaring flaw. So, the simplest approach to anomaly identification is to choose a zone representing typical behaviour and label it as an anomaly in the data, as well as any discovery that does not correlate to this region [12,13]. The automatic identification and correct detection of anything unfamiliar as anomalous is a challenging issue that has been approached in a number of ways throughout the years. Video surveillance is particularly important for identifying unusual occurrences like robberies, accidents, or other illegal activities [14,15].
The majority of the methods now in use for video surveillance anomaly detection take into account a variety of problem formulation elements, including the presence of the data, access to the labelled data, the nature of the abnormalities to be discovered, etc. Furthermore, due to the increasing dimensionality of data, traditional kinds of data-driven algorithms only produce less-than-ideal outcomes. Therefore, it is urgently necessary to create clever computer vision algorithms for automatically spotting abnormalities in surveillance footage in order to reduce labour and time waste. Nevertheless, the aim of any effective anomaly detection system is to be able to promptly alert users to an event that deviates from normal patterns. The following is the paper’s primary contribution,
To improve the efficiency of anomaly detection, the visual-based features are extracted using the newly introduced Siamese-based Convolutional Network model. In this model, the Siamese network is formed using the CNN model and the Huber loss function is used to predict the overall loss function, which can extract the visual features.
To accurately select the optimal features from the extracted features, the Hybrid Squirrel updated White Shark Optimization (HSWSO) is introduced, which is the combination of White Shark Optimizer (WSO) and Squirrel Search Algorithm (SSA). The optimal shark movement can be improved by hybrid the updated position of the Squirrel from the SSA optimization.
To effectively detect the anomalies, the basic RNN model is optimized using the HSWSO algorithm, and this algorithm is also used to optimize the RCNN model, which is used in the segmentation task.
The remaining part of the paper is divided into the following sections: section 2, which includes the literature review, and Section 3, which describes the specific proposed technique. The results obtained for the proposed methodology are compared with the existing techniques in Section 4, and finally, section 5 concludes the paper with a detailed conclusion.
Literature Review
In this section, some of the recent papers related to crime anomaly detection are discussed, along with their drawbacks.
In 2022, Watanabe et al. [16] suggested real-world video anomaly detection via the extraction of key features from videos. The paper provides a quick and reliable approach for detecting video anomalies. The suggested approach analyses the whole movie and automatically extracts and learns the aspects that were crucial for classifying anything as normal or abnormal. With a straightforward self-attention method, salient characteristics may be extracted. A typical video merely captures the usual condition in all of its frames. However, the aberrant video consists of a mix of frames in both normal and abnormal states.
In 2023, Kamoona et al. [17] used deep temporal encoding decoding to detect multiple instance-based video anomalies. The study treats video scenes (clips) as sequential visual information rather than a collection of distinct instances. After that, a deep temporal encoding-decoding system was created to capture the spatiotemporal evolution of video instances across time. This also implies a novel loss function that widens the difference between predictions for normal and abnormal case types. In real surveillance applications, a low false alarm rate provided by the new loss function is essential.
In 2023, Ali [18] introduced video anomaly detection in real-time for intelligent surveillance. In order to create a completely automated surveillance system, that study uses background subtraction (BS), convolutional autoencoder, and object identification. The foreground items were then supplied to the convolutional autoencoders, which separate aberrant events from regular ones and instantly recognize warning indicators of violence. In order to reduce human involvement in video stream processing, The whole scene was then subjected to object identification, and a bounding box was used to indicate the area of interest. When a possible anomaly is detected, the network raises an alarm to warn of the discovery of possibly suspicious behaviours.
In 2023, Qasim and Verdu [19] utilized deep convolutional and recurrent models, a method for detecting video anomalies. In that study, an algorithm that can automatically identify anomalies in films is developed by combining a deep CNN with a simple recurrent unit (SRU). The ResNet design obtains high-level visualizations of features from the input video frames as opposed to the SRU, which collects temporal features. The expressed recurrence and flexibility to construct the SRU in highly parallel implementation made the video anomaly detection method more accurate.
In 2021, Pustokhina et al. [20] recommended an automatic deep learning-based anomaly detection for the protection of vulnerable road users in pedestrian crossings. This research creates an automatic deep learning-based anomaly detection technique (DLADT-PW) for the defence of vulnerable road users. The DLADT-PW model aims to identify and categorize the different anomalies that exist in pedestrian pathways, such as autos, skateboarders, jeeps, etc. Preprocessing is the first stage in the DLADT-PW model, and it was used to reduce noise and improve picture quality. Additionally, the detection method uses the Mask-RCNN with the DenseNet model of the Mask Region Convolutional Neural Network.
In 2020, Zahid et al. [21] introduced an ensemble framework for detecting anomalies in security videos. The study’s provided bagging framework, IBaggedFCNet, employs the power of ensembles for accurate categorization to discover abnormalities in movies. The approach, which investigates the state-of-the-art Inception-v3 image categorization network, eliminates the need for video segmentation before feature extraction because it can lead to unreliable segmentation findings and a large memory footprint. They have used a bagging ensemble (IBaggedFCNet) to empirically demonstrate the resilience of binary classifiers.
In 2021, Sarker et al. [22] suggested anomaly detection in unsupervised scenes of video surveillance. In this study, it is suggested that a weakly supervised learning system be used to detect anomalies in video surveillance settings. Each surveillance video has its spatiotemporal properties extracted using a temporal convolutional 3D neural network (T-C3D). Then, a special ranking loss function reduces the likelihood of false negatives by increasing the distance between the categorization scores of anomalous and normal videos. The approach has been evaluated and compared to cutting-edge techniques, producing superior results without fine-tuning, which also confirms its generalization possibilities.
In 2023, Islam et al. [23] suggested an anomaly detection system for smart city surveillance with IoT support. That research effort proposes an effective and reliable approach for identifying abnormalities in surveillance huge video data using Artificial Intelligence of Things (AIoT). The research study suggests a hybrid approach that combines 2D-CNN with ESN for smart surveillance, a crucial application of the AIoT. The input videos are fed into the CNN as a feature extractor, which then refines the features before being sent through the autoencoder; this was then used to feed data into the ESN for anomalous activity identification and sequence learning. To ensure the proposed model’s capabilities and applicability throughout AIoT contexts in a smart city, it was lightweight and deployed over edge devices.
In 2021, Ullah et al. [24] described a strong, deep, feature-based intelligent anomaly identification system that can work in surveillance cameras with reduced time complexity. The recommended framework sends each frame to a trained CNN model in order to initially extract spatiotemporal properties from a series of frames. The traits that may be derived from the series of frames were useful for identifying unusual events. The multilayer Bi-LSTM model is then used to classify the retrieved deep features, which can reliably categorize ongoing anomalous/normal occurrences in complex surveillance scenes of smart cities.
In 2022, Ul Amin et al. [25] suggested EADN, a minimally complicated deep learning-based model that may be used in a surveillance system for anomaly detection. Using a shot boundary detection method, the video is split into prominent shots at the model’s input. Next, a CNN with time-distributed 2D layers is given the selected frame sequence in order to extract prominent spatiotemporal properties. The collected characteristics were enhanced with useful data that makes it easier to detect anomalous events. Lastly, LSTM cells were employed to collect spatiotemporal data collected from an array of frames per sample of each anomalous occurrence for the goal of anomaly identification.
Problem statement
The need for reliable and effective techniques to identify abnormalities in video data is increasing in a world that is continuously changing, and that depends more and more on video surveillance and monitoring systems. The difficulty is in differentiating between typical and aberrant occurrences or behaviours in video feeds, which can vary from security breaches and accidents to peculiar actions in crowded places, all of which have significant ramifications for the safety and security of the general public. Existing methods for detecting video anomalies have a number of drawbacks, including high false alarm rates, issues with managing a variety of video material, and a requirement for time-consuming human parameter adjustment. In addition, conventional approaches frequently find it difficult to adjust to altering environmental factors and developing hazard scenarios.
In order to overcome these difficulties, the cited studies provide novel strategies that make use of DL techniques like CNNs, RNNs, ensemble methods, and other cutting-edge methodologies to automatically and precisely identify abnormalities in video data. The ultimate goal of these techniques is to increase the overall reliability of anomaly detection and the performance of surveillance and security systems by extracting spatiotemporal information, learning temporal patterns, and doing all three simultaneously. The goal of these research efforts is to create effective, real-time anomaly detection systems that are capable of reliably recognizing anomalous occurrences or behaviours in video streams while minimizing false alarms. These systems have the ability to improve the security and safety of a variety of contexts, including smart cities, transport networks, and surveillance applications, by offering early warning and prompt response to unanticipated events.
Overall, the issue raised in these publications is the need for highly effective and reliable algorithms for detecting anomalous occurrences or behaviours in video data for improved surveillance, security, and safety applications. By doing so, they hope to create solutions for anomaly identification that are more precise and effective than those offered by conventional methods.
Proposed Methodology
The most crucial component of security systems with a wide variety of applications in daily life is video surveillance systems. It is particularly important for remote facility monitoring in both public and private spaces. Video surveillance, in this sense, means keeping an eye out for instances of incorrect human behaviour, sometimes known as real-world anomalies. However, the conventional method of integrating humans in real-world anomaly detection takes a long time and entails a number of overheads. As a result, an important field of research is automated anomaly identification in video surveillance utilizing intelligent algorithms. This work provides a thorough analysis of automated anomaly identification in video surveillance using pre-processing, segmentation, feature extraction, classification, and prediction techniques with an emphasis on crime detection in particular. Figure 1 depicts the general block diagram of the proposed model.
The anomaly detection begins with the conversion of video data into individual frames; it employs video-to-frame conversion techniques. Subsequently, the frames undergo denoising using the Sobel Filter method to enhance their quality, followed by contrast enhancement through contrast stretching. The system identifies ROIs within the frames, a critical step achieved by OR-CNN. Diverse feature extraction techniques are employed, encompassing handcrafted features like HOG, SIFT, and SURF. Texture and shape features are harnessed through Zernike Moments, while local features are described using BRISK. The visual-based features are extracted using the SCN. These two features are concatenated and given to the HSWSO so that the optimal features can be selected. Then, the Optimized RNN model is introduced for anomaly detection, encompassing a wide range of activities, including abnormal behaviour, theft, and violence.
Pre-processing
Preprocessing is the method used to get rid of the shadow and noise areas in the video frames. The first phase in video processing is called preprocessing, and it involves utilizing filtering algorithms to separate the noise or the shadow region.
Video-to-Frame Conversion
The first collection of surveillance videos is done using IoT devices. The process of frame conversion then takes place. In this instance, video frames may be recovered and converted into photos. The input video must be transformed into frames in the following steps after being captured. By breaking up various human behaviours into smaller frames, framing is performed. The number of movements present in the video is simply determined.
Denoise the frames using the Sobel Filter.
For the purpose of eliminating the noise content contained in the input picture, the Sobel operator, a gradient-based edge detection approach, is used. The gradient of the picture intensity function is approximated using a discrete differentiation operator. The traditional Sobel operator uses two kernels, one for each picture. Represents the gradient estimate in the direction while representing the gradient estimation in the y-direction.
Because it can detect edges in pictures with redundant information like noise, the Sobel operator is a popular gradient-based operator for edge detection. The reason is that each picture is differently divided into two rows and columns here, increasing the edge components on both sides and giving the edges a highly brilliant and thick appearance.
Contrast stretching
The critical and fundamental step of contrast stretching must be included in all image processing-based methods that improve a picture’s visual quality. Numerous techniques are available in this sector to improve the object quality of the image. Contrast stretching is a method for enhancing contrast in images that involves extending the image’s intensity values to span the desired range from 0 to 1. It eliminates any potential uncertainty in distinct regions of the dataset’s picture. The distance between the top and lower brightness values in this function rises nonlinearly when the picture contrast is increased.
Segmentation using ORCNN
The pre-processed image is given to the ORCNN for segmentation. The basic RCNN model is optimized using the HSWSO algorithm to improve segmentation accuracy. The anomaly regions are segmented in this stage. Since the CNN-based object detection methods employ a similar sliding window mechanism to discover objects, they need a lot of computational power. ORCNN adopted a selective search strategy to improve CNN’s performance by providing fewer region recommendations. To overcome spatial linkages, various aspect ratios of the items may be recognised, and detect images at different pyramid levels while maintaining the fine details for melanoma detection, the regions must be down sampled. To effectively recreate these oscillations and precisely follow the shape and location of the damaged parts, ORCNN image pyramids collect deep feature descriptions. By continuous smoothing and downsampling, the visual pyramid represents the picture, and the subscript indicates different layers of the image pyramid.
The selective search stage of the ORCNN precisely represents the anomalous attributes by capturing the texture, colour, and intensity of patches over many layers. Each layer represents a probable abnormality at the local level. The amount, number, and arrangement of output features are three ORCNN architectural hyper-parameters.
Feature Extraction
The features present in the segmented regions are extracted using Handcrafted Features like HOG, SIFT, SURF, Texture and Shape Features like Zernike Moments and Local Feature Descriptors like BRISK. Then, the SCN model is also used for extracting the visual features, and these two types of features are combined and given to the feature selection stage.
Handcrafted Features
HOG
Segmenting and organizing the image into blocks of cells is the first stage in the HOG calculation. A feature vector is used to describe the distribution of the unsigned gradient orientation for each block cell, weighted according to their magnitude. The descriptor for each block is produced by normalizing these feature vectors and concatenating them; this is symbolized by the letters, where the number of blocks in the picture and n is the number of feature vectors. These blocks serve as the picture sample’s focal points in order to create the keypoint matrix; the descriptor for each block should be extracted independently, where the number of items in the block descriptor and m is the number of elements in the training set of pictures.
SIFT
The one-dimensional SIFT approach is a novel use of the two-dimensional SIFT technology. The technique is frequently used to extract characteristics from photos so that image recognition may be done. Since they are distinguishable from the surrounding images and are unaffected by brightness or rotation, the characteristics of a picture that successfully passes SIFT’s screening procedure are considered vital when it comes to image identification. Therefore, in the context of image processing, the spectral spots picked by SIFT are referred to as crucial regions. These spectral points were designated as typical spectral points in the current investigation because they extract the main visual characteristic of the spectrum. It should be emphasized that chemical information from the spectrum was not taken into account while selecting these sites. Building a Gaussian pyramid, deducting from it to produce a Difference of Gaussian (DOG) pyramid, and then searching for unique spots of varied sizes are the basic steps of the SIFT technique. The essential SIFT stages are as follows:
Construct a pyramid with Gaussian-shaped sides. The base picture (spectrum) is first altered using a Gaussian transform and other scale-changing factors. A spectrum’s Gaussian filtering is finished at various transformation scales by the addition of the spectrum and the Gaussian convolution kernel.
The spectrum is constructed using various x-sample intervals and sampling scales. Different sample intervals result in various picture extraction scales.
The scale at which the spectrum is smoothed depends on its value. The Gaussian scale transforming factor is another name for it. As a consequence, groups of images (spectra) are produced using the converted spectra at different sampling rates, and each group has a multi-layer spectrum after Gaussian filtration. The Gaussian pyramid is a shape formed by several scale spaces designated by letters. Gaussian transforming factors r, that is, the product of the initial transforming factor, generate several layers inside a single group. Initial, which is recorded as refers to the first layer in the first group. Images in the same group have identical sizes. The Gaussian pyramid’s structure is therefore determined by O and S (the number of levels in each group) as well as the initial Gaussian scale adjustment factor.
SURF
The use of the SURF descriptor to extract anomaly features is made possible by its reliability, speed, and enhanced robustness. In this scenario, simple 2D box filters are used to determine the interest locations. The scale-invariant blob detector it employs is based on the proposed derivative of the Hessian matrix ||.
Using a relative weight known as the Hessian matrix, it is balanced in this scenario. The Gaussian function difference is used to determine the local maxima of each blob descriptor. In order to obtain a stable point, the first selected square matrix is subjected to non-maximum 3×3×3 suppression. With the help of these techniques, the crucial characteristics are extracted and added to the dual classification.
Texture and Shape Features
Zernike Moments
The image function is projected onto the orthogonal polynomial to produce the Zernike moment. The definition of the -order and -degree Zernike moments for a single-channel digital picture is given.
The calculation origin of the picture boundary points is shifted to the image’s centroid and normalized simultaneously in order to guarantee the algorithm’s scale and translation invariance.
The Zernike moments of any order of single-channel digital photographs may be found by combining Eq. (12) through Eq. (16). In general, low-order moments are useful for describing an object’s basic properties, but high-order moments are useful for describing an object’s finer intricacies.
Local Feature Descriptors using BRISK
BRISK is a method for scale-space Key point identification and binary description. The picture pyramid’s octave layers are where key points are found. Using quadratic function fitting, the position and scale of each key point are transformed into a continuous domain representation. The BRISK descriptor is generated as a binary string in two steps after the BRISK characteristics have been discovered. The first step aids in the creation of a rotation-invariant description by estimating the key points’ orientation. Strong brightness comparisons are used in the second step to provide a description that accurately and effectively describes the characteristics of the local location. A sample pattern that looks like concentric circles and designates places is used by the BRISK description. To avoid aliasing effects, the pattern’s intensity of each pi-point is smoothed with a Gaussian. The sample points are collected into pairs and sorted into two classes: short pairs if the distance between is less than or equal to, and long pairs if the distance exceeds. While the short pairings are utilized to construct the descriptor following rotation correction, the large pairs are used to estimate rotation.
The average gradient in the directions is used to estimate the rotation angle. To get a descriptor that is rotation-invariant, the short pairs are rotated by angle. In order to construct the descriptor, BRISK takes the collection of short pairs (), rotates the pairings by the orientation to obtain −θ to get (), and then compares the smoothed intensity.
An encoded binary string known as the binary descriptor can be used to characterize each important point.
Visual Feature extraction using SCN
A specific type of neural network architecture called a siamese network is made for similarity-based tasks like image comparison or verification. The word “Siamese” refers to the concurrent processing of two input samples by two twin subnetworks that are identical to one another. When given similar inputs, these networks learn to produce similar embeddings, and when given different inputs, distinct embeddings. SCN can be used in the context of visual feature extraction to collect visual representations that highlight similarities or contrasts between pictures or regions of interest. The process of extracting significant and pertinent information from visual data, such as pictures or video frames, is typically involved in this. For purposes of further analysis or activities, such as object recognition, classification, or anomaly detection, visual feature extraction seeks to represent the data in a way that maintains key properties.
The Siamese design with CNN is used in this article to develop a Siamese backbone for the visual extraction of features. The target branch of the backbone receives the monitoring template patch as input, while the query branch receives the search region. The result of the two branches’ design for CNN is two feature maps with letters on them. A reaction map R may be created using the Huber loss on X with Z to integrate the data from these two branches. It anticipates that the response map will be able to maintain a wealth of information association since it will need to decode it in the upcoming bounding box prediction subnetwork in order to learn the target’s location and scale. Although it is noted that separate feature channels often absorb diverse semantic information, the Huber loss can only offer a single-channel reduced response map, lacking important characteristics and decoding-related data.
The channel-wise correlation procedure is shown by where. The resulting response map R, that contains the similar number of channels as is rich in data for regression and classification. Given that CNN features are retrieved using many layers, each layer encodes characteristics of various aspects at varying depths. While high-level features are better at capturing the semantic elements that are crucial for discrimination, low-level features like edge, corner, colour, and shape that better reflect visual attributes are crucial for localization. This combines the characteristics derived from the last three leftover backbone blocks that are designated in order to improve inference for recognition and discrimination.
The response map is then shrunk to 256 channels using a kernel convolution. The following computation may speed up, and the number of parameters can be greatly decreased by the dimension reduction. For the RNN’s forecasting of bounding boxes, the last dimension-reduced reaction map R* is utilized as input.
Huber loss function
A loss function used in robust regression is called Huber loss. Compared to least squares, it is less susceptible to data outliers than mean squared error. They deliver more consistent and dependable outcomes. The formula combines the mean absolute error for big mistakes with the mean squared error for minor errors. The Eq. (21) define the Huber loss function.
Delta is a parameter that regulates the transition between the two regimes, “linear” and “quadratic” sections of the loss function, and error is the difference between the predicted value and the real value. The visual features are concatenated with the other features and given to the feature selection stage.
Feature Selection using HSWSO algorithm
In feature selection, the concatenated features are given as the input, and the optimal features are chosen using the HSWSO algorithm. HSWSO is a combination of the White Shark Optimizer (WSO) and Squirrel Search Algorithm (SSA). The movement towards the optimal shark can be improved by using the updated position of SSA optimization. This may prevent the optimization from falling in local optima.
Initialization of HSWSO
The subsequent 2D matrix shows a population of WSO in a search region space, with each shark’s position representing a potential fix for the anomaly detection problems.
Here is a random variable that ranges between 0 and 1. The initial fitness values for the initial solutions provided in Eq. (22) are computed, and if the new location is better than the prior one, an updating procedure is then implemented.
Speed of the shark towards Prey
The great white shark glides towards its prey in undulating motions at a pace of when it detects the position of its prey by its wave hesitation. Eq. (24), which shows how a white shark locates a prey, uses a delay in the waves caused by the prey’s movement.
Then, the swarm’s knowledge of the most popular place is depicted during iteration. The great white sharks’ optimal position is determined by a number called, which may be described as follows.
The acceleration factor was found to be 4.125 after significant investigation and is denoted by the symbol τ.
Squirrel-based Optimal Shark Movement
Sharks may hold their ground in front of the nearest target, the most beneficial competitor. Eq. (35) illustrates the expression for this phenomenon. The position updating strategy of the Squirrel is utilized to improve the optimal shark movement.
Where is the air density, is its body’s surface area, is its frictional drag coefficient, is the squirrel’s gliding speed, and is a chance value.
Anomaly detection using ORNN
The HSWSO algorithm is used to optimize the basic RNN model, and then the Optimized RNN (ORNN) model is utilized to perform anomaly detection. Unsupervised and supervised learning are combined in conventionally used ORNN. The sequence data used to create this model might be as deep as it is lengthy. Each layer in the RNN model is connected by a feedback loop that has the ability to remember data from earlier input. Because of this, the model could become more reliable. This model’s input layer has an index of at time, whereas the hidden layer has an index of at the same time. The layer is hidden at times. The output layer at a time is designated as an index. The weight matrix U links the hidden layer with indices to the input. The weight matrix connects layers with the indices that were previously hidden. With input units and an index of the weight matrix, the hidden layer and the output layer are linked. Hidden units and output units are present.
To create a composite representation of the data, these findings are connected along a predefined axis in a process known as concatenation. The final prediction made by the model, which is typically a binary classification, is the model’s output.
Result And Discussion
In this section, the efficiency of the proposed anomaly detection model is compared with the existing anomaly detection techniques in terms of performance metrics. The anomaly detection dataset [26] is used to implement this proposed work, and the Matlab platform is utilized for implementation.
Performance metrics
The performance metrics and their calculation formulas are given in this section.
Sensitivity
Simply dividing the total positives by the percentage of genuine positive forecasts yields the sensitivity value.
Specificity
Specificity is determined by dividing the number of accurately anticipated negative outcomes by the total number of negatives.
Accuracy
The proportion of correctly identified information to all of the data in the record is known as accuracy.
Precision
By employing all the samples used in the classification process, precision is the representation of the total number of genuine samples that are appropriately taken into consideration during the classification process.
Recall
Recall rate is a measure of how many genuine samples overall are considered when categorizing data using all samples from the same categories from the training data.
F- Score
The definition of the F-score is the harmonic mean of recall rate and accuracy.
Negative Prediction Value (NPV)
The NPV is defined as the ratio of TN and the sum of TN and FN.
Matthews correlation coefficient (MCC)
The two-by-two binary variable association measure, sometimes referred to as MCC, is shown in the equation.
False Positive Ratio (FPR)
When calculating the FPR, the total number of negative outcomes is divided by the total number of unfavourable events that were wrongly categorized as positive.
False Negative Ratio (FNR)
It is often known as the “miss rate,” which is the probability that a true positive may go unnoticed by the test.
Overall comparison of the proposed anomaly detection model
This section compares the proposed anomaly detection model’s results to those of other methods, including CNN, RNN, Bi-directional Long Short-Term Memory (Bi-LSTM), Gradient Recurrent Unit (GRU), and Long Short-Term Memory (LSTM). In Table 1, the performance metrics for the proposed and current strategies are contrasted.
Table 1: Overall comparison of the proposed and existing techniques
| Techniques | Sensitivity | Specificity | Accuracy | Precision | Recall | F-Measure | NPV | FPR | FNR | MCC | Youden Index |
| Proposed | 0.902149 | 0.992473 | 0.986021 | 0.902149 | 0.902149 | 0.902149 | 0.992473 | 0.007527 | 0.097851 | 0.894622 | 0.894622 |
| CNN | 0.85435 | 0.988796 | 0.979193 | 0.85435 | 0.85435 | 0.85435 | 0.988796 | 0.011204 | 0.14565 | 0.843146 | 0.843146 |
| RNN | 0.819438 | 0.986111 | 0.974205 | 0.819438 | 0.819438 | 0.819438 | 0.986111 | 0.013889 | 0.180562 | 0.805548 | 0.805548 |
| Bi-LSTM | 0.834621 | 0.987279 | 0.976374 | 0.834621 | 0.834621 | 0.834621 | 0.987279 | 0.012721 | 0.165379 | 0.821899 | 0.821899 |
| GRU | 0.624178 | 0.971091 | 0.946311 | 0.624178 | 0.624178 | 0.624178 | 0.971091 | 0.028909 | 0.375822 | 0.595269 | 0.595269 |
| LSTM | 0.69793 | 0.976764 | 0.956847 | 0.69793 | 0.69793 | 0.69793 | 0.976764 | 0.023236 | 0.30207 | 0.674694 | 0.674694 |
The table displays the results from a binary classification problem using multiple machine learning models, including Proposed, CNN, RNN, Bi-LSTM, GRU, and LSTM. Each metric assesses a different aspect of the model’s performance. Sensitivity (or recall) measures the models’ ability to correctly identify positive instances, with the Proposed model achieving a score of 0.902149. Specificity gauges the models’ aptitude for correctly identifying negative instances, with the Proposed model scoring 0.992473. Accuracy reflects overall correctness, where the Proposed model achieves 98.60%. Precision quantifies the accuracy of positive predictions, with the Proposed model scoring 90.21%. Negative Predictive Value measures the accuracy of negative predictions, with a score of 99.25% for the Proposed model. The False Positive Rate is low at 0.007527, and the False Negative Rate stands at 0.097851. The Matthews Correlation Coefficient is high at 0.894622, indicating strong model performance and the Youden Index aligns with this value. Overall, the Proposed model demonstrates robust performance across these metrics, making it a promising choice for the binary classification task.
In the proposed technique, sensitivity is 0.902149, indicating that 90.21% of actual positive instances were correctly classified as positive. Specificity measures the proportion of true negative predictions among all actual negative instances. In the proposed technique, specificity is 0.992473, indicating that 99.25% of actual negative instances were correctly classified as negative. The sensitivity and specificity are shown in Figure 3.

Figure 3: Comparison of the sensitivity and specificity
In the proposed technique, accuracy is 0.986021, meaning that 98.60% of all instances were correctly classified. In the proposed technique, precision is 0.902149, indicating that 90.21% of the positive predictions were true positives. The Youden Index is a measure of the model’s effectiveness in distinguishing between the two classes. In the proposed technique, the Youden Index is 0.894622, indicating a good ability to discriminate between positive and negative instances. Figure 4 compares the accuracy, precision and Youden Index for the proposed and the existing techniques.
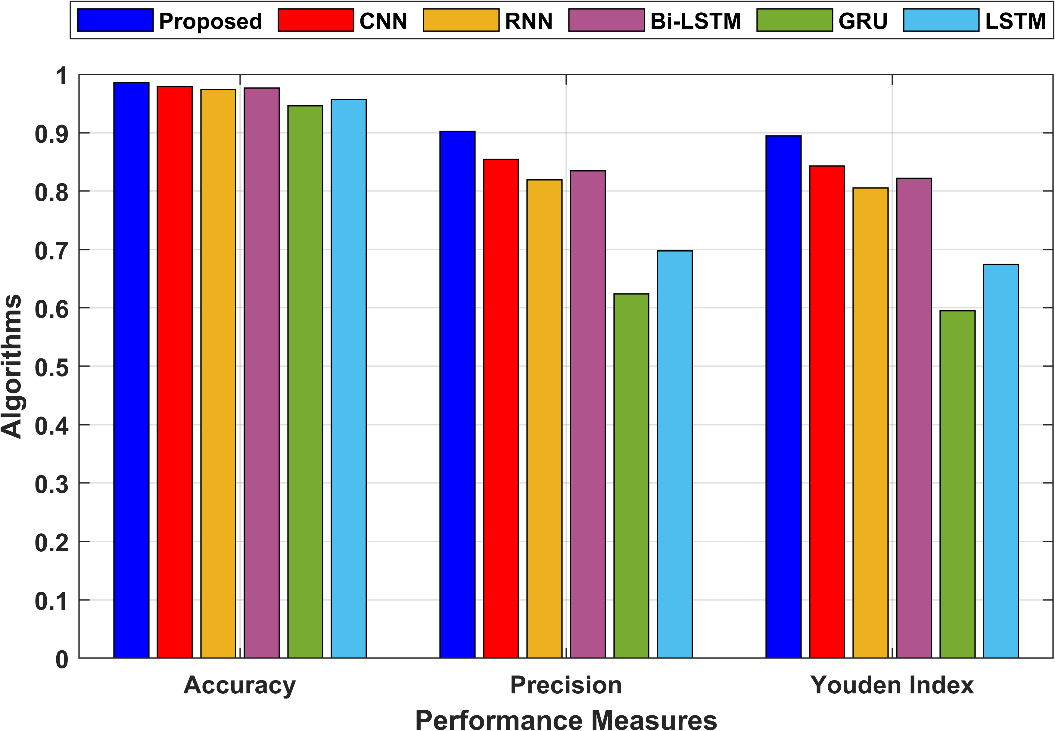
Figure 4: Comparison of the accuracy, precision and Youden Index
A balanced evaluation of a model’s performance is provided by the F-measure, which is the harmonic mean of accuracy and recall. In the proposed technique, the F-Measure is 0.902149, indicating a balanced performance. MCC is a correlation coefficient between the observed and predicted binary classifications. In the proposed technique, MCC is 0.894622, indicating a strong positive correlation. The MCC and the F-Measure values are compared in Figure 5.
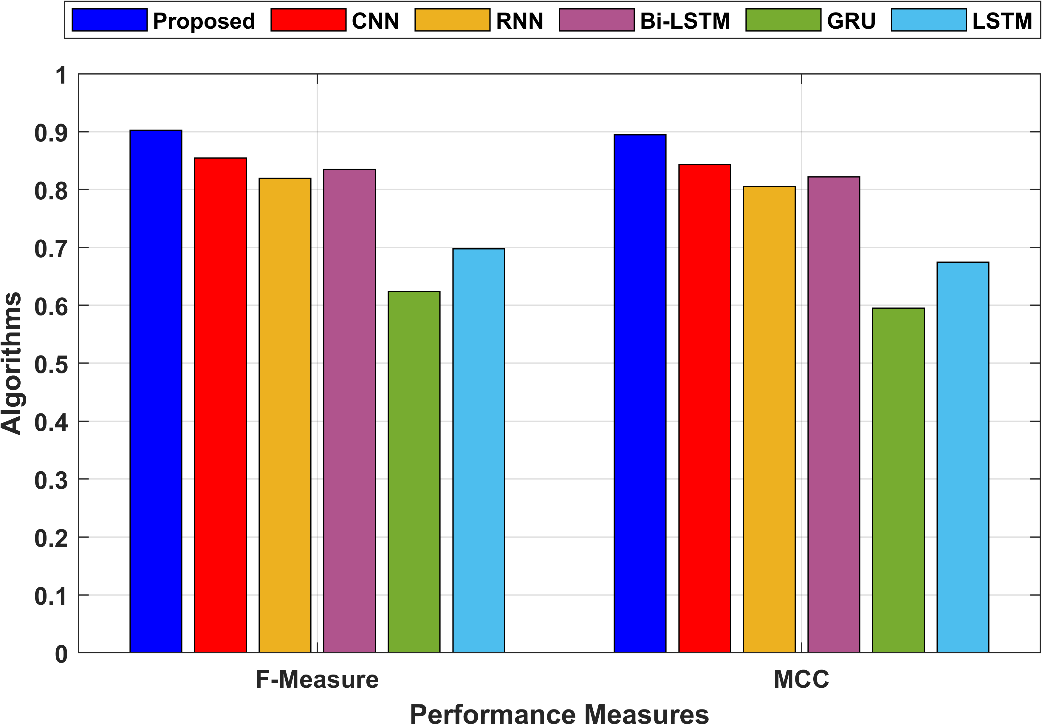
Figure 5: Comparison of the MCC and F-Measure
Recall has already been explained in point 1. It calculates the percentage of accurate positive predictions among all occurrences of positive behaviour. Recall in the suggested method is also 0.902149. NPV calculates the percentage of all projected negative events that actually occur. In the proposed technique, NPV is 0.992473, indicating that 99.25% of the negative predictions were true negatives. Figure 6 compares the recall and NPV values of the proposed and existing models.
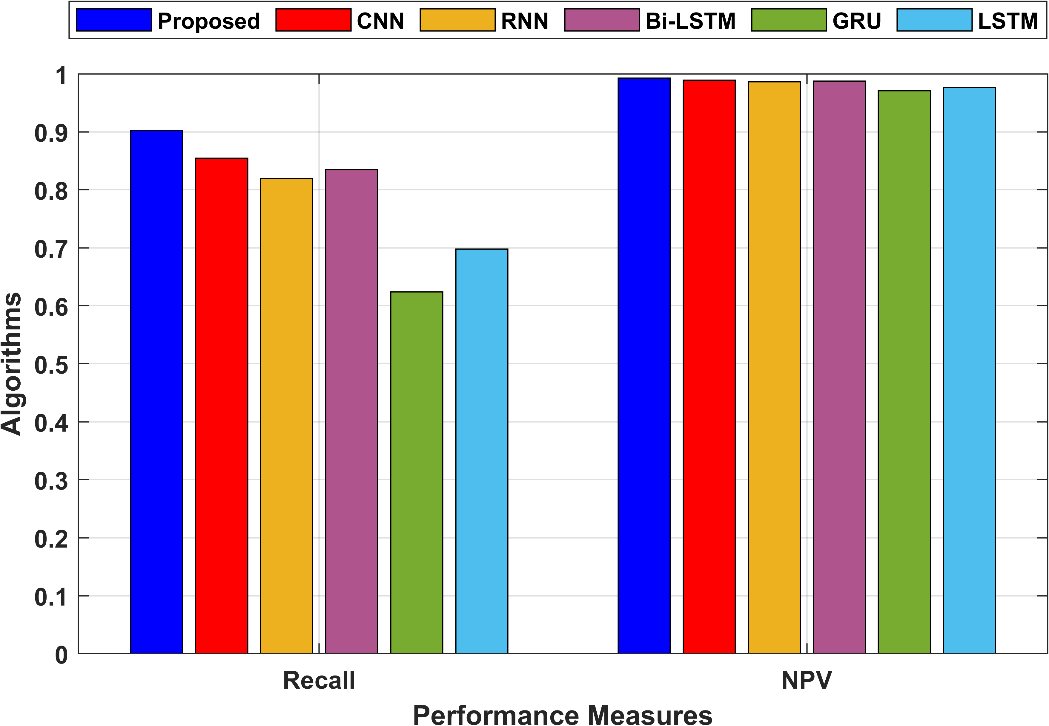
Figure 6: Comparison of the Recall and NPV
FPR measures the proportion of false positive predictions among all actual negative instances. In the proposed technique, FPR is 0.007527, indicating a low rate of false positives. FNR measures the proportion of false negative predictions among all actual positive instances. In the proposed technique, FNR is 0.097851, indicating a moderate rate of false negatives. The graphical comparison of FPR and FNR is shown in Figure 7.
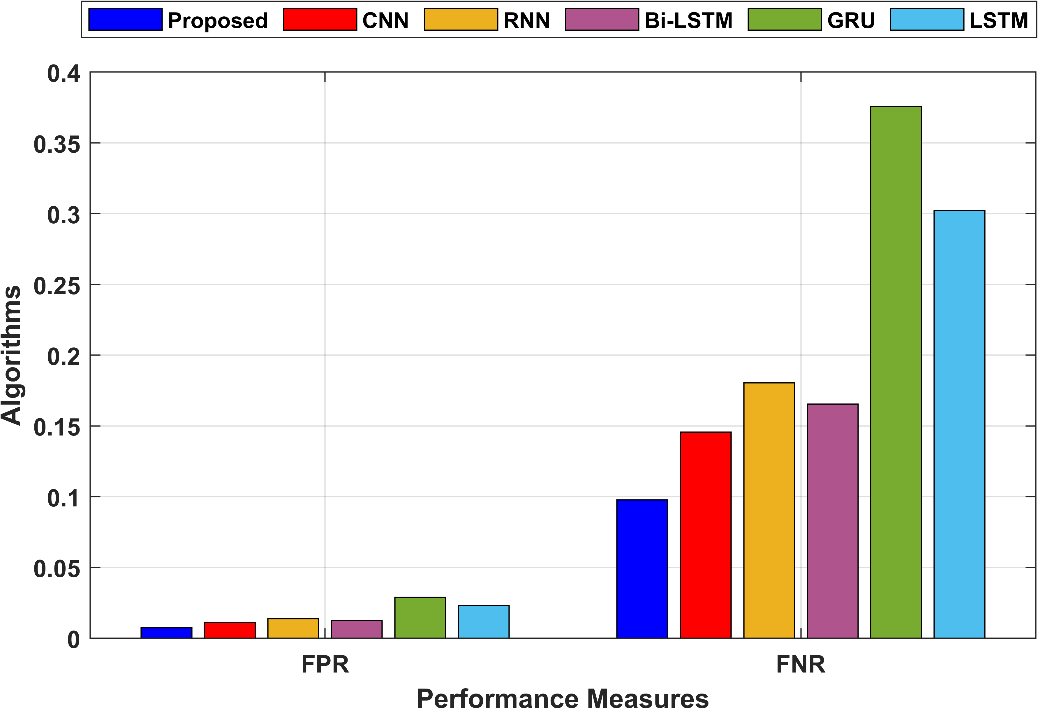
Figure 7: Graphical comparison of FNR and FPR
Conclusion
In conclusion, the introduction of the Automated Crime Anomaly Detection System (CADS) presents a significant advancement in the realm of smart cities, where safety and security are of paramount concern. With the proliferation of surveillance cameras, CADS seizes the opportunity to enhance public safety while also addressing the challenge of efficiently monitoring vast volumes of video data. CADS follows a systematic workflow, beginning with data collection from smart city surveillance cameras and proceeding through a series of preprocessing steps, segmentation, and feature extraction techniques, including cutting-edge deep learning models like Siamese Convolutional Networks. The culmination of these efforts is the accurate identification and classification of criminal activities, spanning abnormal behaviour, theft, and violence.
The Hybrid Squirrel updated White Shark Optimizer (HSWSO), which ensures that only the most relevant features are retained for analysis. This refinement process not only improves the efficiency of the system but also enhances the precision of anomaly detection. In the dynamic landscape of smart cities, CADS serves as a beacon of technological progress, showcasing how advanced deep learning and computer vision technologies can be harnessed to create safer and more secure urban environments. CADS offers a blueprint for the integration of cutting-edge technology into urban security infrastructure, paving the way for the continued development of smarter and safer cities.
Reference
Elia, R., Plastiras, G., Pettemeridou, E., Savva, A. and Theocharides, T., 2022. A real‐world data collection framework for a fused dataset creation for joint human and remotely operated vehicle monitoring and anomalous command detection. CAAI Transactions on Intelligence Technology, 7(3), pp.432-445.
Blanchard, A. and Sapsis, T., 2022. Informative path planning for anomaly detection in environment exploration and monitoring. Ocean Engineering, 243, p.110242.
Patrikar, D.R. and Parate, M.R., 2022. Anomaly detection using edge computing in a video surveillance system. International Journal of Multimedia Information Retrieval, 11(2), pp.85-110.
Ullah, W., Ullah, A., Hussain, T., Khan, Z.A. and Baik, S.W., 2021. An efficient anomaly recognition framework using an attention residual LSTM in surveillance videos. Sensors, 21(8), p.2811.
Tariq, S., Farooq, H., Jaleel, A. and Wasif, S.M., 2021. Anomaly detection with particle filtering for online video surveillance. IEEE Access, 9, pp.19457-19468.
Thakare, K.V., Sharma, N., Dogra, D.P., Choi, H. and Kim, I.J., 2022. A multi-stream deep neural network with late fuzzy fusion for real-world anomaly detection. Expert Systems with Applications, 201, p.117030.
Ingle, P.Y. and Kim, Y.G., 2022. Real-time abnormal object detection for video surveillance in smart cities. Sensors, 22(10), p.3862.
Lin, W., Gao, J., Wang, Q. and Li, X., 2021. Learning to detect anomaly events in crowd scenes from synthetic data. Neurocomputing, 436, pp.248-259.
Maqsood, R., Bajwa, U.I., Saleem, G., Raza, R.H. and Anwar, M.W., 2021. Anomaly recognition from surveillance videos using 3D convolution neural network. Multimedia Tools and Applications, 80(12), pp.18693-18716.
Balasundaram, A. and Chellappan, C., 2020. An intelligent video analytics model for abnormal event detection in online surveillance video. Journal of Real-Time Image Processing, 17(4), pp.915-930.
Wu, C., Shao, S., Tunc, C., Satam, P. and Hariri, S., 2021. An explainable and efficient deep learning framework for video anomaly detection. Cluster computing, pp.1-23.
Mandala, J., Akhila, P. and Reddy, V.S., 2021. An Integrated Reinforcement DQNN Algorithm to Detect Crime Anomaly Objects in Smart Cities. International Journal of Advanced Computer Science and Applications, 12(12).
Zhu, S., Chen, C. and Sultani, W., 2020. Video anomaly detection for smart surveillance. In Computer Vision: A Reference Guide (pp. 1-8). Cham: Springer International Publishing.
Rehman, A., Saba, T., Khan, M.Z., Damaševičius, R. and Bahaj, S.A., 2022. Internet-of-things-based suspicious activity recognition using multimodalities of computer vision for smart city security. Security and Communication Networks, 2022.
Isafiade, O.E. and Bagula, A.B., 2020. Series mining for public safety advancement in emerging smart cities. Future Generation Computer Systems, 108, pp.777-802.
Watanabe, Y., Okabe, M., Harada, Y. and Kashima, N., 2022. Real-World Video Anomaly Detection by Extracting Salient Features in Videos. IEEE Access, 10, pp.125052-125060.
Kamoona, A.M., Gostar, A.K., Bab-Hadiashar, A. and Hoseinnezhad, R., 2023. Multiple instance-based video anomaly detection using deep temporal encoding–decoding. Expert Systems with Applications, 214, p.119079.
Ali, M.M., 2023. Real‐time video anomaly detection for smart surveillance. IET Image Processing, 17(5), pp.1375-1388.
Qasim, M. and Verdu, E., 2023. Video anomaly detection system using deep convolutional and recurrent models. Results in Engineering, 18, p.101026.
Pustokhina, I.V., Pustokhin, D.A., Vaiyapuri, T., Gupta, D., Kumar, S. and Shankar, K., 2021. An automated deep learning based anomaly detection in pedestrian walkways for vulnerable road users safety. Safety Science, 142, p.105356.
Zahid, Y., Tahir, M.A., Durrani, N.M. and Bouridane, A., 2020. Ibaggedfcnet: An ensemble framework for anomaly detection in surveillance videos. IEEE Access, 8, pp.220620-220630.
Sarker, M.I., Losada-Gutiérrez, C., Marron-Romera, M., Fuentes-Jiménez, D. and Luengo-Sánchez, S., 2021. Semi-supervised anomaly detection in video-surveillance scenes in the wild. Sensors, 21(12), p.3993.
Islam, M., Dukyil, A.S., Alyahya, S. and Habib, S., 2023. An IoT Enable Anomaly Detection System for Smart City Surveillance. Sensors, 23(4), p.2358.
Ullah, W., Ullah, A., Haq, I.U., Muhammad, K., Sajjad, M. and Baik, S.W., 2021. CNN features with bi-directional LSTM for real-time anomaly detection in surveillance networks. Multimedia tools and applications, 80, pp.16979-16995.
Ul Amin, S., Ullah, M., Sajjad, M., Cheikh, F.A., Hijji, M., Hijji, A. and Muhammad, K., 2022. EADN: An efficient deep learning model for anomaly detection in videos. Mathematics, 10(9), p.1555.
The dataset is taken from https://www.dropbox.com/sh/75v5ehq4cdg5g5g/AABvnJSwZI7zXb8_myBA0CLHa?dl=0 dated 04/10/2023.
Cite This Work
To export a reference to this article please select a referencing stye below:

Academic Master Education Team is a group of academic editors and subject specialists responsible for producing structured, research-backed essays across multiple disciplines. Each article is developed following Academic Master’s Editorial Policy and supported by credible academic references. The team ensures clarity, citation accuracy, and adherence to ethical academic writing standards
Content reviewed under Academic Master Editorial Policy.


