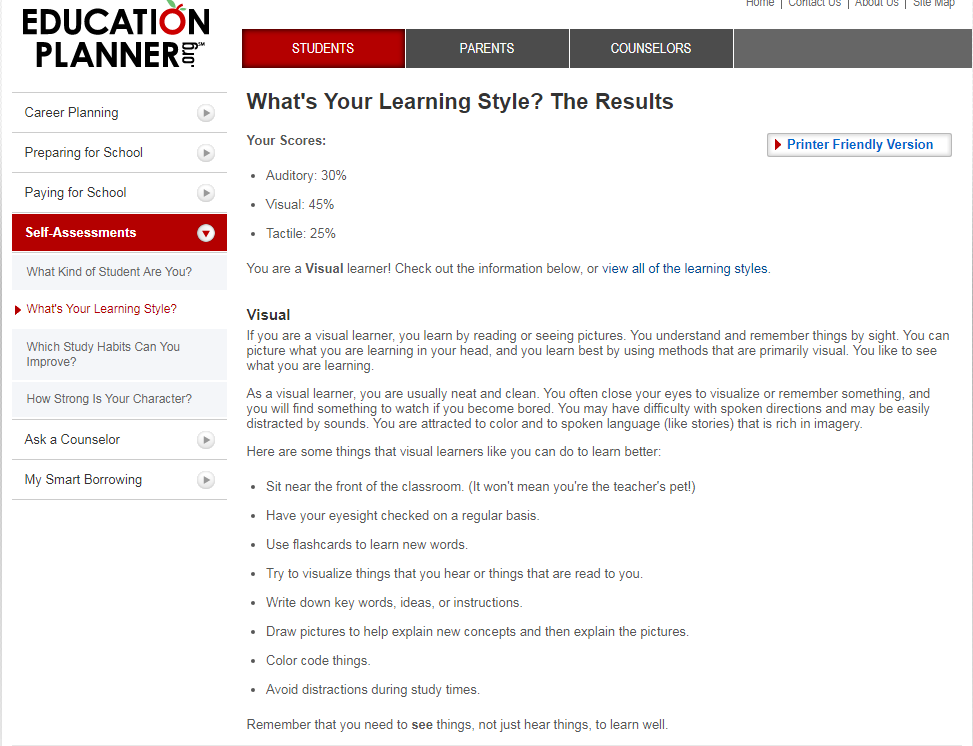
A preference of visual learners should be
- graphics/graphs, pictures, concepts, matrices, maps and any material in which images are more elaborative than the written content.
- In subjects such as Biology, Physics, and Arts, images and pictures offer a lot for visual learners. The visual learners after watching the images and diagrams, visualize the whole thing or concept in their mind. For this purpose, they need to focus on images and pictures closely.
- Some amount of description along with images also help a great deal in the learning process for a visual learner (Barnes et al).
- They should watch introductory videos and diagrams to have clear pictures in their minds.
- While reading any material, visual learners should draw an image in their mind to develop their understanding in a precise manner.
- They should use flash cards to learn new things
- They should have their eyesight checked regularly
- Note down new ideas, concepts and build a picture in your mind so that you can understand
- When you understand the concept behind the images and pictures, redraw those images to have much clearer picture
See the result of the test in Appendix
Most and Least Effective methods of conveying information to Visual Learners
Through graphical and visual presentations of any topic or subjects, visual learners can be conveyed information effectively. Such type of learners mostly recalls images and drawings instead of detailed description. Therefore, images containing useful information must be included in the information to facilitate learners. Adding graphics to texts is always a good idea to take visual learners onboard. Sometimes, the mind works in both ways. To process information, it first thinks of images and then translates the image into the text to get better interpretation (Donahue et al.). The global use of social media also prompt learners to use images more than textual description. The more effective tools in this regard are as under:
Infographics
The combination of words, images, and shapes is known as infographics. Many people around the world find it a simplified way of understanding the things. So, to make a particular information much more concise, images should be used effectively along with text so that learners find it useful
Concept Maps
The updated form of infographics is the concept maps. These maps are in structured form and describe a relationship and idea between. This is an effective tool for presentations, projects, and the whole course. The concept maps also develop a keen interest in visual learners to understand things better.
Why is visual learning essential to cater needs of learners
In the current age of globalization, technology is driving every aspect of life. Therefore, ways of learning have also transformed as more and more graphics and images are circulating and students are finding it easy to go through images, shapes, and diagrams to extract the relevant part (Meyer et al.). Also, they are producing good results as a result of infographic and concept maps. It proves helpful for them to understand the concept and that is why they are producing good results. The majority of students in this era like to learn through images, they have developed a good level of visualizing objects, they also plan and execute their projects with the help of an image. More importantly, the image remains in mind as compared to the detailed description. When students close their eyes after paying attention to certain images or infographics, it appears in their mind. Those who learn better through images are known to have developed visual skills. Visual media plays a vital role to develop such skills in students. Therefore, emphasis must be laid more on visual techniques to invoke an understanding of young generation.
References
Barnes, N. J., & Jacobsen, S. (2015). Meet the New Class, Same as the Old Class? Millennials and Their Surprising Learning Preferences. Journal of Higher Education Theory and Practice, 15(7), 24.
Donahue, J., Anne Hendricks, L., Guadarrama, S., Rohrbach, M., Venugopalan, S., Saenko, K., & Darrell, T. (2015). Long-term recurrent convolutional networks for visual recognition and description. In Proceedings of the IEEE conference on computer vision and pattern recognition (pp. 2625-2634).
Meyer, A. J., Stomski, N. J., Innes, S. I., & Armson, A. J. (2016). VARK learning preferences and mobile anatomy software application use in pre‐clinical chiropractic students. Anatomical sciences education, 9(3), 247-254.
Appendix


