ABSTRACT
The pandemic situation across the globe has forced educational institutions to shut down to control the spread of this virus. These incidents made the teaching professionals think of alternative methods of coaching during this lockdown. Thus, it paves the way towards web-based learning. This study will help to find out the students’ attitudes towards online class and exams during COVID – 19 Pandemic. It was done for the students who are studying in various colleges and contribution of e-learning during this pandemic.
- INTRODUCTION
The purpose of education is to form a person to be great. It provides the pathway to reach their future and inculcating social responsibilities. The main core of education is to learn new thinks and gain knowledge. Learning is a process of acquiring knowledge or skills through study, experience, or being taught. Any fluky accident that happens in the world will always leave its impact on education and the epidemic of COVID 19 has its footprints on education. The pandemic situation across the globe has forced educational institutions to shut down to control the spread of this virus. These incidents made the teaching professionals think of alternative methods of coaching during this lockdown. Thus, it paves the way towards web-based learning. Today scenario of learning has stepped into the digital world. In which teaching professionals and students are virtually connected. E-learning is quite simple to understand and implement. The use of a desktop, laptop, smart phones and the internet forms a major component of this learning methodology. E-learning provides rapid growth and proved to be the best in all sectors, especially in education during this lockdown. This study will help to find out the students’ attitudes towards online class and exams during COVID – 19 Pandemic. It was done for the students who are studying in various colleges and contribution of e-learning during this pandemic. It can be a learning pattern in educational institutions to enhance the student’s knowledge and skills through digital technologies. Government and Educational Department has to offer better infrastructure for e-learning for the betterment of students.
- REVIEW OF THE LITERATURE
Blagovesna Yovkova (2018) in his study” Factors affecting students’ attitudes towards online learning” found that students have a clearly stated positive attitude towards online distance learning. Education systematically indicates that they are more likely to accept it.
Ishmirekha Handique Konwar (2017) in his study “A Study on Attitude of College Students towards E-learning” found that found that students who used e-learning as a learning strategy received higher scores or percentages than the lower user of the elegance strategy.
Obaid Ullah (2017) in his study “Students’ Attitude towards Online Learning at Tertiary Level” that found, the results of the study did not reveal any significant relationship between the interests of computer students and the acquisition of knowledge through online learning at the undergraduate level.
Michelle Fong (2014) in his study “Student attitudes to traditional and online methods of delivery” found that male students who prefer online learning technology place relatively less emphasis on communication opportunities than female students.
2.1 Statement of the problem
Gurukulam is a type of education system in olden India shishya living near the guru in the same house. The term is also used today to refer to residential monasteries or schools operated by modern gurus and the next development of education is college. A place of higher education usually for people who have finished twelve years of schooling and where they can obtain more advanced knowledge and a get a degree to recognize this. Major world events are often an infection point for rapid innovation. Online classes post COVID 19, it is one of the few sectors where investment has not dried up. It has been made clear through this pandemic is the importance of disseminating knowledge across borders, companies and all part of society. If online technology can play a role here, it is incumbent upon all us explore it’s full. For those who do have way in the right technology, there is proof that learning online can be more effective in a number of ways. The effectiveness of online learning varies amongst age groups especially youngsters. Online learning has been shown to increase preservation of information, and take less time, meaning the changes coronavirus have caused might be here to stay. Online learning comes in so many shapes and sizes. Students have an endless number of chances to learn new things. The study focused on evaluating Students’ Attitude to Adopt E-learning System during COVID-19 Paramedic Situation.
- OBJECTIVES OF THE STUDY
- To know the demographic profile of the respondents.
- To analyze the effect of Enabling Conditions, Social Influence and Performance Expectancy on Actual Usage.
- Effect of Facilitating Conditions, Actual Usage and Performance Expectancy on Quality of Learning.
- To examine the impact of E-leaning in improving the Quality of Learning.
- RESEARCH METHODOLOGY
The study is based upon the descriptive research design to examine the Students’ Attitude to Adopt E-learning System during COVID-19 Paramedic Situation. The validity of any research depends on the systematic method of collecting the data and analyzing the same in appropriate order. In the present study, both secondary and primary data were collected and analyzed. Totally 240 samples were selected by using convenience sampling techniques.
- LIMITATIONS OF THE STUDY
The present research is restricted to Pune city only. The respondents’ response may have favouritism, which may not give a true picture about the chosen research topic. The sampling unit chosen is the respondents who are studying in colleges. The survey result may vary in other locations, based on their preference.
5.1 Analysis and Interpretation
Percentage analysis is one of the descriptive statistical measures used to describe the characteristics of the sample or population in total. Percentage analysis involves computing measures of variables selected for study.
Table 1: Details of Demographic Information
| Parameter | Observed Statistics | Implication |
| Gender | Male (23.3 %) and Female (76.7 %) | Respondents were selected from Male and Female to know their intention towards e-learning |
| Discipline | Commerce (65.8%) and Science (34.2%) | Respondents from different discipline were selected to know their intention towards e-learning |
| Device used for e-learning | Smart Phone (88.3%) Laptop (11.7%) | Device used for e-leaning details were collected to know quality of learning |
Source: Primary Data
The above table 1 interpret most of the respondents are female, Commerce Students and Using Smart Phone for e-learning.
5.2 Measurement Model
The measurement model specifies the relationships that suggest how measured variables represent a construct that is not measured directly (Hair et al. 2006). It was assessed with confirmatory factor analysis (CFA) using the AMOS 23.0 tool to examine convergent and discriminant validity.
Table 2: Results of Measurement Model
| Constructs | Loading | CR | AVE | MSV |
| Performance Expectancy | PE | 0.774 | 0.547 | 0.990 |
| E-learning is useful to score high marks | 0.43 | |||
| E-learning would increase understanding of Subject | 0.57 | |||
| E-learning would improve my performance | 0.74 | |||
| E-learning allows choosing topics to learn preferred topic. | 0.64 | |||
| Social Influence | SI | 0.798 | 0.537 | 1.191 |
| Teacher, Parents and Friends influence use E-learning System | 0.70 | |||
| Using E-leaning System are considered to be smart | 0.49 | |||
| Facilitating Condition | FC | 0.725 | 0.599 | 1.191 |
| Have enough resources to use the E-learning System | 0.68 | |||
| Have the knowledge necessary to use the E-learning System | 0.61 | |||
| Training is given to use E-learning System | 0.68 | |||
| E-learning System is compatible with other technologies | 0.58 | |||
| Actual Usage | AU | 0.793 | 0.566 | 0.863 |
| The use of E-Leaning System has become a habit | 0.86 | |||
| Plan to continue using E-Learning frequently after regular classes | 0.77 | |||
| Use the E-learning system a lot to course work | 0.63 | |||
| Quality of Learning | QL | 0.769 | 0.527 | 0.863 |
| E-Learning System helps for creative thinking | 072 | |||
| E-Learning System provide more opportunities to participate in the class discussion | 0.59 | |||
| E-Learning System trends to excel in the quality of learning to acquire Knowledge | 0.71 |
Source: Computed Data
CR- Composite Reliability, AVE-Average Variance Extracted, MSV- Maximum Shared Variance
Table 2 & Table 3describes the results of measurement model. Convergent validity is ascertained by examining indicator loadings. In this study, factor loading values were above 0.4 (Acceptable range) that indicates the validity of the construct. The convergent validity was also confirmed through estimation of average variance extracted (AVE) as recommended by Fornell and Larcker (1981), values must be greater than 0.5. Finally, composite reliability was assessed and all values exceeded 0.5.
Table 3: Discriminant validity of measurement model
| SI | FC | PE | AU | QL | |
| SI | 0.911* | ||||
| FC | 0.791 | 0.932* | |||
| PE | 0.691 | 0.695 | 0.899* | ||
| AU | 0.810 | 0.831 | 0.876 | 0.953* | |
| QL | 0.846 | 0.844 | 0.871 | 0.729 | 0.926* |
Source: Computed Data
*Diagonal elements (bold) are Square Root of AVE
Off diagonal elements present binary correlation among the construct
The results of correlation and square root of AVE for testing the discriminant validity of online shopping construct. According to Fornell and Larcker (1981), to measure the discriminant validity, the square root of average variance extracted (AVE) of each sub construct should be higher than correlation coefficient among sub constructs. There is a correlation between the Facilitating Conditions and Social Influence (0.791), Performance Expectancy and Social Influence (0.691), Performance Expectancy and Facilitating Conditions (0.695), Actual Usage and Social Influence (0.810), Actual Usage and Facilitating Conditions (0.831), Actual Usage and Performance Expectancy (0.876), Quality of Learning and Social Influence (0.846), Quality of Learning and Facilitating Conditions (0.844), Quality of Learning and Performance Expectancy (0.871), Quality of Learning and Actual Usage (0.729). As a result, square root of AVE in all cases is more than the correlation.
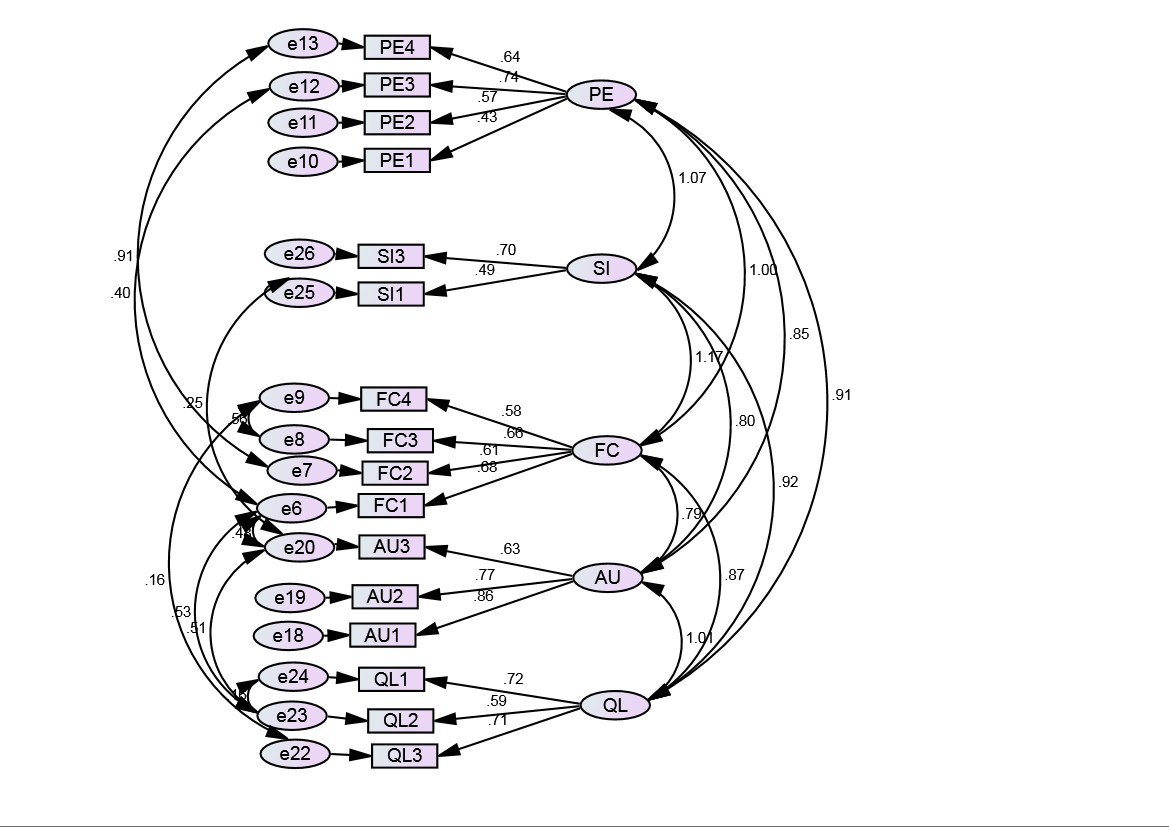
Figure 1: CFA Model with Standardized Factor Loading
Based on the CFA model shows in above figure1, it is possible to conclude that Performance Expectancy, Social Influence, Facilitating Conditions, Actual Usage and Quality of Learning are statistically significant, which means that the Performance Expectancy have a significant influence in the Social Influence, Facilitating Conditions, Actual Usage and Quality of Learning. Social Influence has a significant influence in the Performance Expectancy, Facilitating Conditions, Actual Usage and Quality of Learning. Actual Usage has a significant influence in the Performance Expectancy, Social Influence, Facilitating Conditions and Quality of Learning. Quality of Learning have a significant influence in Performance Expectancy, Social Influence, Facilitating Conditions and Actual Usage. Factor loading values of all indicators in the measurement model is above 0.43 which is to the acceptable range of above 0.4.
5.3 Goodness of Fit Test
The recommended approach to judging the adequacy of a model is to use several fit indices. A model can be considered to have adequate fit if most or all fit indices are acceptable.
Table 4: Goodness of Fit test of Path Analysis
| Measures | Estimate | Threshold | Interpretation |
| CMIN | 164.541 | — | — |
| DF | 99 | — | — |
| CMIN/DF | 1.662 | Between 1 and 3 | Excellent |
| CFI | 0.967 | >0.95 | Excellent |
| SRMR | 0.070 | <0.08 | Excellent |
| RMSEA | 0.061 | <0.06 | Acceptable |
| P Close | 0.138 | >0.05 | Excellent |
Source: Computed Data
Table 4 shows the value of CMIN/DF, CFI, SRMR, RMSEA are 1.662, 0.967, 0.070, 0 and 0.061 respectively. The minimum fit chi-square statistic was found to be significant (Chi square = 164.541; df= 99; p = 0.138), therefore, could be considered as a perfect model fit and implied that the model might adequate.
5.4 Testing the Path and Hypotheses
Under Structural equation modelling, relationships between the theoretical constructs are represented by regression or path coefficients between the constructs. The single headed arrows show the causal relationship present in the model, with the variable at the tail of the arrow being the cause of the variable at the point. Statistically, single headed arrows represent the regression coefficients shows in below figure 2.
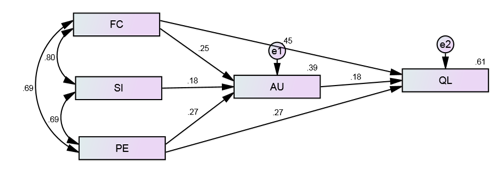
Figure 2: Path Diagram of the Model with Standardized Regression Weight
Table 5: Regression Weights
| Relationships between Exogenous and Endogenous | Estimate | S.E. | C.R. | P | Relationship | ||
|---|---|---|---|---|---|---|---|
| AU | <— | FC | 0.053 | 0.019 | 2.831 | .005 | Significant |
| AU | <— | SI | 0.074 | 0.037 | 2.015 | .044 | Significant |
| AU | <— | PE | 0.051 | 0.014 | 3.650 | *** | Significant |
| QW | <— | AU | 0.364 | 0.103 | 3.538 | *** | Significant |
| QW | <— | FC | 0.192 | 0.025 | 7.754 | *** | Significant |
| QW | <— | PE | 0.103 | 0.022 | 4.646 | *** | Significant |
Source: Computed Data
The relationships between different variable are measured through the Unstandardized regression coefficient (β). In the table 5, the unstandardized regression coefficient (β) shows that when exogenous variable (independent variable) goes up by 1 unit, the endogenous variable (dependent variable) goes up by the unit of its respective estimate (Jana & Chandra, 2016). The further explanation of relationships is given below:
Effect of Facilitating Conditions, Social Influence and Performance Expectancy on Actual Usage
Ho1: There is no significant effect of Facilitating Conditions, Social Influence and Performance Expectancy on Actual Usage
The critical ratio, regression coefficient and p value of the path from Facilitating Conditions to Actual Usage is 2.831, 0.053 and 0.005 respectively. The critical ratio, regression coefficient and p value of the path from Social Influence to Actual Usage is 2.015, 0.074 and 0.044 respectively. The critical ratio, regression coefficient and p value of the path from Performance Expectancy to Actual Usage is 3.650, 0.051 and <0.001 respectively. As p value is less than significant alpha value of 0.05, Ho1 is rejected that Facilitating Conditions, Social Influence and Performance Expectancy have a significant positive influence on Actual Usage. When Facilitating Conditions, Social Influence and Performance Expectancy goes up by 1, Actual Usage goes up by0.25, 0.18 and 0.27 respectively.
Effect of Facilitating Conditions, Actual Usage and Performance Expectancy on Quality of Learning
Ho2: There is no significant effect of Facilitating Conditions, Actual Usage and Performance Expectancy on Quality of Learning
The critical ratio, regression coefficient and p value of the path from Actual Usage to Quality of Learning is 3.538, 0.364 and <0.001 respectively. The critical ratio, regression coefficient and p value of the path from Facilitating Conditions to Quality of Learning is 7.754, 0.192and <0.001 respectively. The critical ratio, regression coefficient and p value of the path from Performance Expectancy to Quality of Learning is 4.646, 0.103 and <0.001 respectively. As p value is less than significant alpha value of 0.05, Ho2 is rejected that Facilitating Conditions, Actual Usage and Performance Expectancy have a significant positive influence on Quality of Learning. When Facilitating Conditions, Actual Usage and Performance Expectancy goes up by 1, Quality of Learning goes up by0.45, 0.18 and 0.27 respectively.
Table 6: Effect of Independent Variables on Dependent variable
| Dependent Variable | Independent Variable | Direct Effect | Indirect Effect | Total Effect | R2 |
| Actual Usage | Facilitating Conditions Social Influence Performance Expectancy | 0.250 0.179 0.266 | 0.000 0.000 0.000 | 0.250 0.179 0.266 | 0.39 |
| Quality of Learning | Facilitating Conditions Social Influence Performance Expectancy Actual Usage | 0.449 0.000 0.266 0.180 | 0.045 0.032 0.048 0.000 | 0.494 0.032 0.314 0.180 | 0.61 |
Table 6 shows the standardized total direct effects of Facilitating Conditions, Social Influence and Performance Expectancy on Actual Usage are 0.250, 0.179 and 0.266 respectively. The standardized total (direct and indirect) effects of Facilitating Conditions, Social Influence, Performance Expectancy and Actual Usage on Quality of Leaning are 0.494, 0.032, 0.314 and 0.180 respectively.
Squared Multiple correlation is estimated that the predictors of Actual Usage explain 39 percent of its variance and the predictors of Quality of Learning explain 61 percent of its variance.
SUGGESTIONS
The following suggestions offered by the researcher to improve the impact of E-leaning in Quality of Learning
- Educational institutions may use open book exams to develop application and analyze skills during Covid 19 Pandemic Situations
- Teachers may use presentation software to make the online classes more interactive.
- Workshops may be organized for the rural students to enhance their knowledge in E-leaning system.
- Teachers may give more opportunities to the students for active participation through Flipped Class Room.
- The government may provide free laptop to the poor students to enhance their E- learning interest.
CONCLUSION
E-learning system is an immediately helpful in the time of lock down restrictions. The teaching and learning of online classes are conducted successfully. The students believe offline classes better but they are comfortable with E-learning system. The questionnaire had very interesting answer such as most of the students have own cell phone and laptop for attending online classes. Most of the students are used headphones for attending online classes. Over all in future students are like to prefer E-learning system.
REFERENCES
- Chen, F.F. (2007) “Sensitivity of Goodness of Fit Indexes to Lack of Measurement Invariance”. Structural Equation Modelling: A Multidisciplinary Journal, vol.14, pp.464–504.
- El-Hussein, M. O. M., & Cronje, J. C. (2010), “Defining Mobile Learning in the Higher Education Landscape.” Educational Technology & Society, vol. 13, pp. 12–21.
- Fornell, C., &Larcker, D. F. (1981), “Evaluating Structural Equation Models with Unobservable Variables and Measurement Error”. Journal of Marketing Research, vol.18, pp.39 – 50.
- Ornell C, Larcker DF 1981 J. Mark. Res. 1 39-50
- Habboush, A., Nassuora, A., & Hussein, A.R. (2011), “Acceptance of Mobile Learning by University Students”. American Journal of Scientific Research, vol.22, pp.119–122.
- Hair, J., Blake, W., Babin, B., and Tatham, R. (2006). Multivariate Data Analysis. New Jersey: Prentice Hall.
- IshmirekhaHandique Konwar1. (2017), “A Study on Attitude of College Students towards E-learning with Special Reference to North Lakhimpur of Lakhimpur District”, Assam International Journal of Information Science and Education. ISSN 2231-1262 Vol 4, No pp. 1-9
- Michelle Fong (2014), “Student attitudes to traditional and online methods of delivery”, Journal of Information Technology Education:Vol 13,
- Nassuora, A. B. (2012), “Student Acceptance of Mobile Learning for Higher Education”. American Academic& Scholarly Research Journal, vol.4, pp.0–5.
- ObaidUllah, (2017), “Students Attitude towards Online Learning at Tertiary Level”, PUTAJ – Humanities and Social Sciences, Vol.25, No.1-2 (Special Issue-Media Matters), p.78
- Paul G. Paris, (2004) “E-Learning: A study on Secondary Students’ Attitudes towards Online Web Assisted learning”, International Education Journal, Vol 5, No 1, p. 111.
Cite This Work
To export a reference to this article please select a referencing stye below:

Academic Master Education Team is a group of academic editors and subject specialists responsible for producing structured, research-backed essays across multiple disciplines. Each article is developed following Academic Master’s Editorial Policy and supported by credible academic references. The team ensures clarity, citation accuracy, and adherence to ethical academic writing standards
Content reviewed under Academic Master Editorial Policy.


