Abstract
Governments are primarily concerned with ensuring that all citizens of the world have access to education regardless of their disabilities. This article presents a method for predicting dropout rates among disabled students in order to offer recommendations and alternative pathways for their career enhancement. To achieve this, data on training students’ learning behaviour was collected through an online survey completed by various student organizations, both dropout and non-dropouts. The collected data was pre-processed to improve classification performance and shorten training, after which the data was used to extract relevant characteristics. To further condense these extracted features, probabilistically quadratic discriminant assessment (ENT-QDA) was employed. Using the condensed features, fuzzy data-based rules were created, and the system was trained using a classification method called Linear Scaling Owl Optimal Control Method with CNN (LSOWL-CNN). Finally, testing was carried out by collecting educational and other information from the students and entering it into the dropout prediction network for classification. The proposed framework showed improved performance compared to current models. The article’s contributions include the use of an LSOWL-CNN method for dropout prediction, the application of ENT-QDA for feature condensation, and the use of fuzzy data-based rules. Overall, the article provides valuable insights for improving the education system for disabled students and highlights the importance of early intervention in preventing dropout rates.
Introduction
The ability to stop pupil drop-outs and successfully maintain participation rates are critical issues that authorities in both secondary and higher education across the globe face. [1]. Students with special needs encounter numerous obstacles on their path to success in every area. Numerous obstacles stand in the way of disabled students succeeding academically. According to a variety of studies, students with disabilities decreased at a greater rate than students without disabilities. The attrition rate for students with disabilities is still double that of students without disabilities, despite government efforts to assist their educational needs [2]. A learning difficulty may make it difficult for a child to acquire and utilise expertise. Every child has a different learning disability [3]. Children with special needs are very skilled. Children who are disabled can, even so, accomplish high academic standards and learn strategies for overcoming their impairments. Children who are disabled can learn effectively with the right support [4]. Numerous studies indicate that high-education students with disabilities are not making the same amount of progress as those without disabilities [5]. Those who are much less inclined to continue with their higher schooling, less inclined to live independently, more likely to leave high school, and more likely to be unemployed or underemployed [6]. Over 1.2 million students are noted to graduate from high school each year, with the drop-out rate for both pupils with and without disabilities rising alarmingly each year [7]. With the exception of students with emotional disturbances, learners with learning disabilities have a higher dropout rate than classmates who have any other category of disabilities [8]. Dropout has a detrimental effect on organisations by lowering enrolment and hindering the accomplishment of the organization’s objectives. [9]. For the sake of ongoing training, high dropout protection and prognostication are crucial [10]. Therefore, issues pertaining to identifying the causes of student dropouts, as well as potential prevention and control measures, have grown to be of interest to scholars utilising data analysis in schooling. [11]. Two distinct fields—EDM and LA—are used to describe the use and implementation of information extraction in higher education and other school environments [12]. EDM is evolving into a resource for educators and educational institute supervisors to find new understanding and trends of student academic data to support judgement for the challenges of learning in the digital world [13]. Additionally, learning analytics is a way of evaluating different student-related problems from the vast amount of educational data. Forecasting future performance and determining danger are both involved in this [14]. EDM is also the process of using data mining (DM) methods to answer information, such as presenting queries using a special type of set of data that originates from education settings [15]. EDM predicts students’ test scores by integrating timing information and the amount of assistance a student needs to solve problems. It converts raw data that comes from different learning environments or educational settings into useful information for research. One key goal of using EDM is the ability to predict students’ academic behaviour since this would allow mentors and relevant academic personnel to intervene with students who are facing various challenges and offer support. Substantial work has been done on the usage of data mining techniques in education, but still, there are many areas that are untouched, and no unified approach has been followed. In addition to offering advice for both drop-outs and non-dropout students, this study indicates a fuzzy rule and LSOWL-CNN methodology for the prediction of school drop-outs having to hear students. The contribution of this paper is described below:
Addressing the issue of high dropout rates among students with disabilities and proposing a solution to anticipate such dropouts earlier and offer recommendations and alternative career pathways for their enhancement.
Data on the learning behaviour of students (both dropouts and non-dropouts) will be gathered using an online survey to create a dataset for further analysis.
Pre-processing the data to improve classification performance and reduce training time.
Probabilistically quadratic discriminant assessment (ENT-QDA) was used to extract the most relevant features from the pre-processed data and shorten the characteristics.
Developing rules based on fuzzy data using the condensed characteristics.
A new classification method, Linear Scaling Owl Optimal Control Method with CNN (LSOWL-CNN), is introduced to train the system using the created rules.
Testing the proposed framework by collecting educational and other information from students and using the dropout prediction network for classification.
The following is how the paper is set up: The review of literature is introduced in segment 2, the proposed method is described in detail in portion 3, the results and discussions are explained in section 4, and the article is deduced with a conversation of its future path in segment 5.
Literature Survey
“Some of the recent research works related to hearing-impaired student’s educational dropout prediction were reviewed in this section.”
Fernandes et al. [16] have presented a detailed Predictive analysis of the academic performance of public school students in the capital of Brazil. A descriptive statistical analysis to gain insight from data. Subsequently, two datasets were obtained. The Classification models based on the Gradient Boosting Machine (GBM) were created to predict academic outcomes of student performance at the end of the school year for each dataset.
Suresh et al. [17] proposed a method for utilizing an Inexperienced Bayesian classification model to identify drop-outs. The information was gathered using a questionnaire form. The information was initially gathered using a questionnaire form. Pre-survey and comment were the two survey forms that were created. Pre-survey work was done at the time of students’ admission. The comment was finished in the course’s medium term. The pre/post data on students were collected in textual form. In a dataset, this message was transformed into ones and zeros. After that, the dataset’s missing hypotheses were removed. Following the division, the updated values for nulls used information from others with similar values. A Naive Bayesian classifier was then employed to determine which individuals are most likely to be decreased. This method wo not, however, assess predictions of pupil dropout rates.
Meedech et al. [18] expanded the use of the conceptual approach for predicting student dropout. The aim set of data was initially created by combining several various types of information. To prevent bias and mistakes discovered in the data, the phase of the data preparation used conventional methods for filling in null values and normalisation. In order to classify data and make it easily decipherable, various rule-based models were investigated. Due to its simplicity and effectiveness, an IF-THEN principle was a traditional method for formulating decisions. The experimental studies using classification methods and the information redistribution method produced outcomes that showed classifiers with a more hopeful precision than some other designs. On the other hand, a broad range of volatility in the prediction consequence had been caused by the product’s disparity in learning.
Singer et al. [19] have suggested using a tree structure to predict the effects of intellectual difficulties and accommodation facilities on the stabilisation of engineering degree students’ school tasks. When the LD and lodging factors are taken into account, the designs perform much better at forecasting the stabilisation classification for a particular student. Depending on the student pattern, various accommodation actions have different impacts on the stabilisation of school tasks.
Bhat et al. [20] have proposed a Smartphone-Based Real-Time CNN, Especially With regard to hard-listening Audiences. The Speaking Enhancement (SE) technique uses a multi-objective learning CNN to augment how well speakers are understood by those wearing hearing aids. An implementation that needs to perform real-time SE is used to enforce the suggested method on a mobile phone. Technology for HA is provided by this agreement. Using a mapping-based CNN model, a speech signals frequency band is cleaned up using a multi-objective learning structure with both primary and secondary characteristics.
Lee and Chung [21] patterned a method to enhance the effectiveness of a dropout early detection method (a) by attempting to address this same imbalanced class problem utilising synthesised minority up sampling techniques (SMOTE) and the evolutionary algorithms in computer vision and (b) by assessing the qualified classifier with both recipients able to operate characteristic and highly precise (PR) bends. As a consequence of just using machine learning’s SMOTE and ensemble techniques to address the problem of class imbalance, experimental findings revealed that this prototype maximised the likelihood of continuing to support the effective studying of every student and minimised the cost of interference. The original learning access to the NEIS dataset was restricted, which posed a number of challenges. It was unable to access a variety of characteristics in the NEIS dataset, like teachers’ evaluations of students when we first met, and analyzation, despite the fact that it involves the key risk factors for dropout estimation in this assessment.
Gil et al. [22] familiarised with a technique for predicting dropout hazard maps utilising data mining techniques. Data screening came first in the procedure. The norms for data were then checked to see if they were aligned and to reduce the impact of forecast errors during the modelling process. Additionally, the values of the parent’s earnings variable were filled in with their median using the inferred value method to minimize bias inside the set of data. According to the outcomes, the accuracy level utilising C4.5 was 98.9474%, whereas the accuracy level utilising Naive Bayes was 97.8947%. As a result, it has been demonstrated that the C4.5 woman’s precision in determining student dropout cases based on the data gathering is superior. Key limitations of this study include the fact that its elements were a single test with a small student sample.
Lottering et al. [23] depicted a machine-learning strategy to find participants who were in danger of quitting school. The set of data used in this original study determination of the at-risk classmates was applied with the Extracting Knowledge in Databases (KDD) strategy. The KDD method involved pre-processing the chosen data, which included removing anomalies and imputed values for incomplete data. The dataset was then transformed or subjected to dimensionality reduction techniques to lower the actual number of variables. The set of data was then run through a variety of algorithms in an effort to find patterns. In order to learn more, the mining process pattern was construed. The outcomes suggested that the advanced model showed better performance than other cutting-edge approaches. On the other hand, it applied to the smaller group of students who had a narrower range of degrees. Additionally, because the data came from a particular school of technology, the result could not be generalised.
Ahmad et al. [24] have proposed a machine learning-based strategy for measuring student achievement in educational data mining. Contrasting ANN and RF machine learning designs for forecasting students’ achievement considering their evaluation and demographic data, the models were assessed after using functionality methods and an analysis of OULAD.
Azizan et al. [25] present an Individual Promote Value The assignment and justification in Malaysian Polytechnics for Students with Profound Hearing Loss, Gratification and Adjustment’s Mediator in the Relationship Impacts. Academic success was related positively to both the personality-major fit and the need fit. This connection was discovered to be mediated by the adaptation. Around each other, these findings suggest that the user constructs influence the academic success of students with hearing loss and that adaptation plays a key role in illuminating this connection.
Proposed Framework
The pandemic of student dropouts is among the most severe and enduring issues the education system has to deal with. The term “dropout” refers to an individual who left a school, college, or other academic establishment before finishing a registration course. Thousands of students leave their respective organisations each year without completing their courses. The majority of the pupils in this has disorders. Therefore, it is essential to make an early prediction of student dropout by looking at their academic performance, learning styles, personal information, health issues, etc. By making recommendations about their careers and potential educational trends, this study will aid in preventing them from quitting school. As a result, using the instructional mining algorithm, it is suggested in this paper that an early prediction of student dropouts can be made by classifying students according to their learning resources and gathering survey information from certain students. Alternative suggestions are also given to students who dropped out of school or had poor academic performance. The training and testing phases of this suggested model are comprised of educational datasets. To predict the dropout behaviour of students, this study collects data, cleans the data, extracts features, reduces features, generates fuzzy rules, and classifies the data. Fig 1 below models the suggested framework.
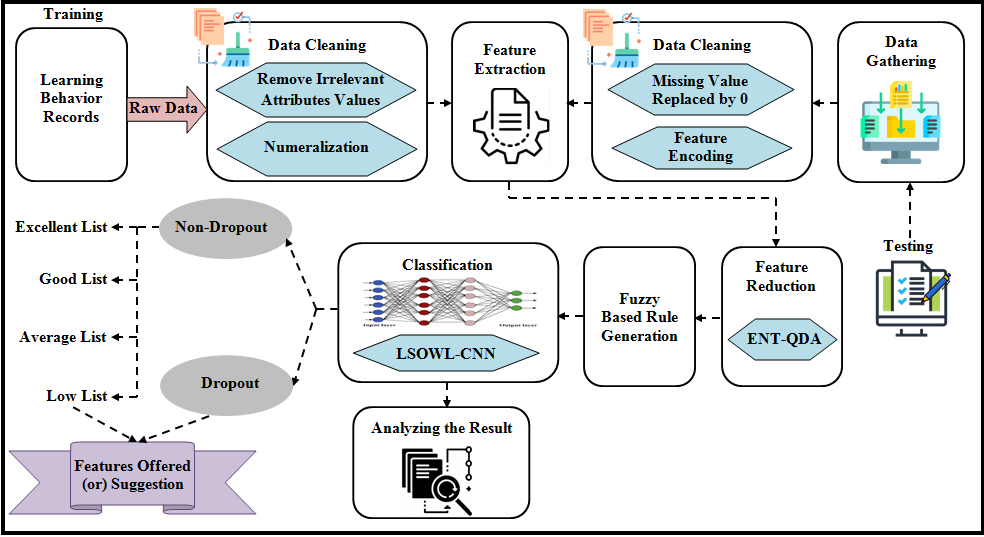
Fig 1: Model suggested for predicting student dropouts
Training Phase
Data Cleaning
First, different groups of students (Dropped and non-dropouts) will be asked to complete the Online survey in order to gather data on learning behaviour. The Online survey includes the following information: Student Number, Physical intimacy, Number Of dependents, Household Income, Maturity level, Mode of Instruction, Fortnight of Exam Appearance for the 10th Grade, Merit list in Personal Subjects, Overall Marks, Proportion, Knowledge Level Of difficulty, etc. The information set is based on these specifics acquired from the Online questionnaire. Data cleaning is then done to improve the accuracy of classification and shorten training schedules. There are two main processes in the data screening step. They are numeric transformations as well as the withdrawal of unimportant attributes. Here is an explanation of these procedures.
Irrelevant attribute removal
The dataset’s unimportant data may cause the classification performance to suffer, which lowers the system’s quality. The information that is not required for the forecasting of drop-outs is referred to as irrelevant attributes. For example, the suggested dropout prognostication process does not require the dataset’s ascribed date stamp. Therefore, in order to increase the system’s accuracy rate, these characteristics have been removed from the data. Numerization occurs after irrelevant information has been removed.
Numeralization
It involves transforming all of the dataset’s quasi-data into a numeric form for further categorization. Sexual identity, dept, and other non-numerical data in the set of data can’t be directly controlled by the classification model. Numeration, which converts any integer number between 1 and distinct value systems based on the type of data, is done to add value to such data. Each of the data in the set of data is converted to numbers at the conclusion of this procedure, which are then utilised for additional analysis.
Feature Extraction
The values are extracted out of the cleaned data in this phase. To achieve accurate categorization, extracted features are used to extract characteristics from the original dataset. It is described as the process of identifying the set of characteristics that will represent the information required for analysis and categorization the most effectively or purposefully. Additionally, it lowers the resources required to explain the vast amounts of data. Starting with a base set of measurement values, the extraction of features creates an integral approach that is meant to be insightful and non-redundant. In order to complete the desired action using this reduced representation rather than the full initial data, it is expected that the extracted features will encompass the pertinent data from the input data. Here, characteristics like name, age, sex, and other characteristics are extracted before being further lowered to lessen the dimensions.
Feature Reduction with ENT-QDA
The definition of dimension reduction is the removal of some characteristics from the derived set of features without sacrificing any significant data. The scheme becomes more effective by cutting down the number of features because this reduces the computational burden. Electron density Quadratic Linear discriminate Assessment is used to reduce the characteristics in the suggested technique (ENT-QDA). To ascertain the function that distinguishes among two or more characteristics, the dimension reduction technique known as quadratic discriminant analysis (QDA) is used. Assuming that the metrics are uniformly distributed, QDA is tightly linked to linear regression techniques. In contrast to LDA, QDA does not assume that the multicollinearity of each characteristic is the same. However, the variable of each feature must be determined by calculating for dimensionality reduction utilising QDA. Such a co-variance computation is extremely difficult and yields unreliable results for dimensionality reduction. In addition to making this tool facilitate dimension reduction, the covariance computation is supplanted with entropy computation (ENT). ENT-QDA stands for the ENT substitute in the QDA prototype. Listed below are the ENT-QDA stages:
Stage 1: Think about a group of extracted features whose dimensionality must be minimised. Let the likelihoods of these characteristics be. Next, a random sample is chosen in a way that displays the variety of groups.
Stage 2: Estimate the multivariate Gaussian distribution system and the Gaussian probability density function, which are the foundations of the QDA.
Stage 3: The QDA formula can be obtained by using the log transformation of the equation.
Were, . Finding the ordinary classifier coefficient after calculating the mean and fractal dimension values allows for the identification of the process’s most beneficial characteristics.
The overall decrease in the supply is shown here. The system for generating fuzzy rules is then fed these characteristics.
Fuzzy-based Rule Generation
By taking into account the students’ grades, the fuzzy-based rules from Fig 2 will be produced from the collection of the decrease in the supply. In order to control the classification, fuzzy-based rule generators use a set of specifications and IF-THEN circumstances on the input data. Modelling inputs into fuzzy sets with components that have a level of affiliation calculated utilising a member status function is the procedure of “fuzzification.”
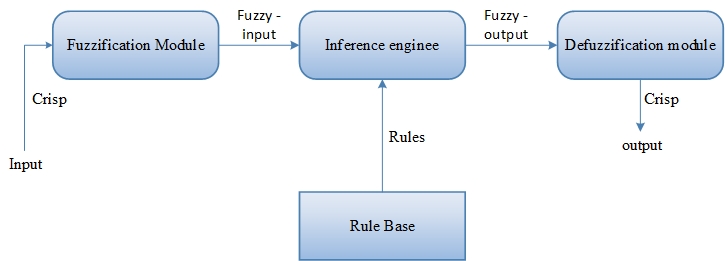
Fig 2: Block diagram of Fuzzy based Rule Generation
An element’s likelihood of being classed grammatically is expressed by the membership value. Since linguistic terms are used as both their antecedent factors and implications, the system with fuzzy rules is the most helpful in simulating some complicated systems that may be viewed by people. If is and is, then is, where are the variables, and where are the input features? This is how the regulations in this fuzzy rule-based system can be depicted.
The rule’s consequence in this layout can take any workable format, though quadratic formats are the most prevalent. We construct a fuzzy regulation scheme by forming an amount of fuzzification and incorporating them into a set of IF-THEN circumstances and findings. According to the suggested system, a set of rules is created based on the student’s grades, other educational activities, and an established decrease in the supply. The fuzzy sets produced by the proposed methodology are listed as,
If the learners decide their grade level (sixth, ninth, eleventh, or twelfth) and their record variety is superior to 90 per cent or superior to 80 per cent, They also actively participate in extracurriculars, they are considered to be “Excellent Students both in Research and Extracurricular activities Actions.”
The student is an “Absolutely brilliant Scholar in Studies but must Take part in Extracurricular Actions” if they choose their benchmark (6th, 9th, 11th, or 12th), and their mark variety is larger than 90percentage points or larger than 80percent, and they do not actively participate in the extracurriculars.
In this manner, the education rates of a set of guidelines are calculated using fuzzy-based rule generator sets. This same classifier categorises the child’s individual background and dropout information based on such rules.
Classification using LSOWL-CNN
Linear Scaling Owl Optimal Control (LSOOC) is a method for solving optimal control problems that involve large-scale systems. This method is based on the idea of using a neural network to approximate the solution to the optimal control problem and then using the neural network to iteratively refine the solution until convergence is achieved. In LSOOC, the neural network used to approximate the solution is typically a Convolutional Neural Network (CNN). This is because CNNs are particularly well-suited for processing large-scale data, such as images, which have a similar structure to many dynamical systems. The CNN is trained using a combination of supervised and reinforcement learning techniques, with the goal of minimizing the difference between the neural network’s predictions and the true solution to the optimal control problem. Once the neural network is trained, it can be used to iteratively refine the solution to the optimal control problem. This is done by first using the neural network to compute an initial guess for the optimal control and then solving a modified version of the optimal control problem using the initial guess as a starting point. The solution to this modified problem is then used to update the neural network, which in turn is used to compute a new initial guess for the optimal control. This process is repeated until convergence is achieved. One of the key advantages of LSOOC with a CNN is that it allows for the efficient solution of large-scale optimal control problems that would be difficult or impossible to solve using traditional methods. Additionally, because the neural network is used to iteratively refine the solution, the method is particularly well-suited for problems with complex, nonlinear dynamics. In summary, LSOOC with a CNN is a powerful method for solving large-scale optimal control problems that combines the strengths of neural networks and optimization algorithms.
Following the creation of fuzzy rules, classification is carried out using the generated rules by the Sequential Scaling Owl Optimization Technique with CNN (LSOWL-CNN). Dropouts and non-dropouts are the two classes into which the classification algorithm divides the outcome. Prospective recommendations will be made based on this categorization for both non-dropout and dropout students, helping the former to enhance their level of study and helping the latter to decrease the number of classmates who intend to discontinue their research. There are three layers in CNN: input, hidden, and output. The concealed layer contains the convolution layer, which carries out the alignment with the mission, which is a dot product of a convolution layers kernel and the layers’ input matrix. By trying to apply a variable of biases and weights, each neuron in the CNN computes the outcome. To obtain a more accurate classifier performance, these weights must be modified in each know prior to the loss function. CNN learning persists in the event that the least error function occurs. The Linear Scalability Owl Optimization Algorithm is used to keep updating the weighting factors; however, it is used if the error function is high (LSOWL). LSOWL-CNN is the term used to describe the merged use of the LSOWL optimization algorithm in the basic CNN. Fig 3 below illustrates the structural layout of a traditional CNN.
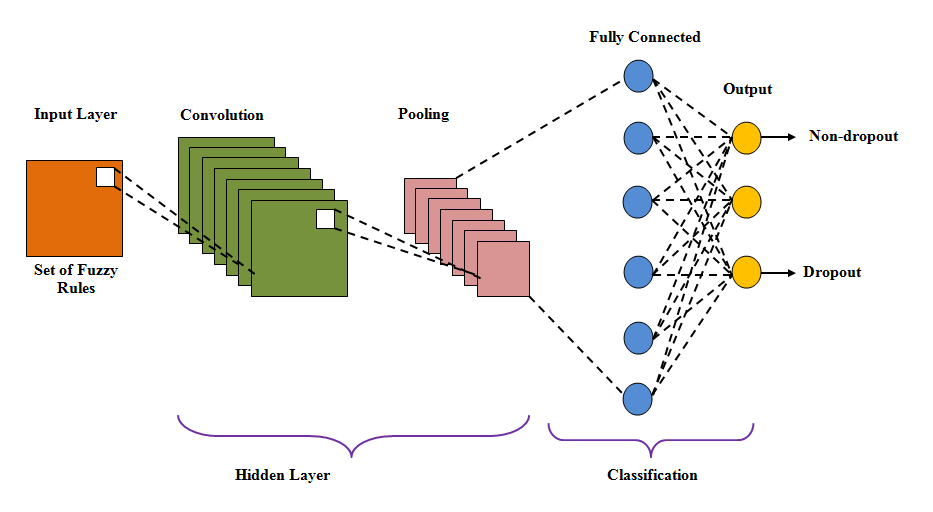
Fig 3: Building design for CNN
The list of ambiguous regulations is entered into the CNN’s input nodes. The weight and bias morals of each neuron are multiplied in the input layer.
Here, it signifies the ReLU activation function, illustrates the input layer weight bias values, and uses the LSOWL technique to update the vector, defining the number of layers in the CNN. Then, this output is fed into the convolutional layer.
The convolution operation combines the insight before sending the outcome to the following layer. It has a 5*5 filter that is used for specifically designed to support. Making use of the convolutional layer is the convolution operation, which displays how many filters there are in the convolutional layer.
The pooling coat is applied following the convolution layers. Down-sampling is the main principle of accumulation, which is used to lessen the sophistication of extra layers. As a result, less computing power is needed to process the information. Incorporating the neuron output data from one stack into a nerve cell in the following layer lessens the aspect of the data input. The data is transferred to the completely connected layer after dimension reduction in the pooling layer. Every neuron inside one layer is linked to every other gradient neuron through the completely linked coating. To generate the categorisation performance, the in-it data is passed through the completely connected layer.
Therefore, the discriminator generates the categorization outcome as dropout and non-dropout. Based on academic tiers and extracurriculars, the non-dropout level will also be divided into Excellent, Good, Average, and Low categories. In the interim, the graduates are organised according to their semester grades. Both dropout and non-dropout students will receive study advice and educational recommendations in order to enhance their schooling and reduce the likelihood of dropping out. The following criteria are used to categorise the drop-outs.
Students who don’t perform better academically or in extracurricular activities.
Students who perform well academically but poorly in extracurriculars.
Then, based on their level of studies and activities, recommendations are given to the dropout students.
Weight updation by means of LSOWL
The meta-heuristic algorithm known as OWL is based on how owls hunt. As opposed to just using one ‘s eyes, owls chase at night, utilising their hearing abilities. The central nervous system of the owl creates an aural map whenever the prey tends to make audio and the noise reaches it. The place of the prey can be determined by owls using this map, which includes details on intertemporal moment and severity. The starting view of the owls, which is chosen at random from a set of possible positions, results in the optimal local solution and slows integration. The position of the owls is normalised using the Linear Scaling (LS) technique in order to increase the optimum solutions and get a better convergence rate. LSOWL is the name for this type of LS integration into the OWL. The following describes the LSOWL procedure.
Stage 1: Initially, the first inhabitants (weight values) include owls, each of which is depicted by a dimensional array.
Stage 2: Using linear contractual capacity, each owl’s initial location in the forest is then determined.
Stage 3: The concentration of prey helps to communicate with each owl while in its present role; it is then calculated on the basis of its best fitness, which is determined by the owl’s position.
Stage 4: The great owl is decided by the fitness value based on the owl that hears the noise, and the bad owl is the 1 who hears the least noise. The data on normalised intensity follows.
Stageone5: Following that, the Euclidean range is used to determine how far apart each owl is from its prey.
Stage 6: The owl detects changes in sound intensity as it approaches the prey and calculates them.
Stage 7: In this stage, the owl’s location is updated because of the prey’s movement.
It indicates the likelihood of a feast moving is steady from 1.9 to 0, decreases linearly and has a random number with a uniform distribution in the range [0, 0.5]. This approach results in the best owl positions being selected as the best solution (optimized weight values of CNN). Fig 4 illustrates the LSOWL’s pseudocode.
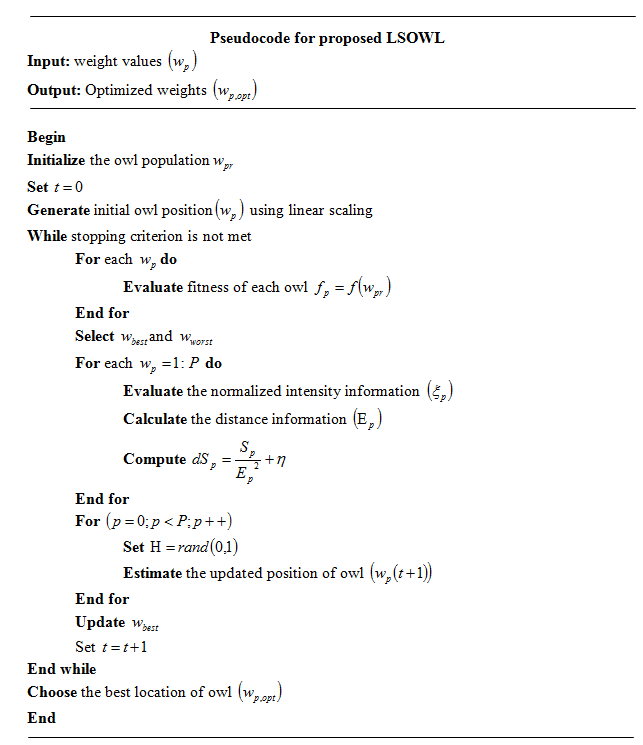
Fig 4: LSOWL proposed pseudocode
Testing Phase
Data Gathering
Students are asked to complete application forms in order to collect the data required for testing in this segment. Information gathered from the students includes details about their education and other facts. The information gathered includes the person’s name, age, impairment (such as being deaf or dumb), family members, schooling, family earnings, how many hours per week those devote to writing tasks, how long it takes them to get to college, whether they have access to the internet at residence, whether they have involved in any non-technical activities, how socially engaged they are, and the number of extracurricular activities they involved in. The students are also asked to provide some data so that their educational levels and categorizations can be determined.
Data Cleaning
Pre-processing is completed following the collection of student information. The replacement of missing values and feature encoding occurs during pre-processing. For the purpose of making the collected data useful for additional analysis, data cleaning is done.
Missing value replacement
The data that was gathered lacked certain information that the students failed to fill in. Not all students will respond to all of the application’s questions. The students leave out some information on the form when it doesn’t match their educational and personal information. Such incomplete form questions will decrease the classification accuracy and result in errors throughout the overall process. The suggested technique will, therefore, substitute zero for any missing form information in order to address these problems. The next step is feature encoding.
Feature encoding
To increase the accuracy of classification, all of the attributes of the checking data are then encoded with numerical data. A group has a different group that is converted into a variable and used for further processing through the process of feature encoding. Fig 5 depicts the upcoming encoding prototype.
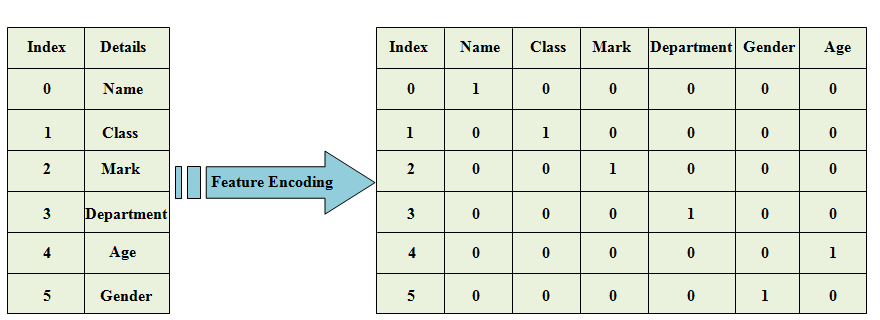
Fig 5: Feature encoding as a model
The process of extracting features, feature extraction, fuzzy-based guidelines, and classification are carried out in the same manner as during the training stage after the data has been cleaned. In the end, the classifier assigns the students to groups according to the data they supplied on the form.
Result And Discussion
By contrasting the results of the suggested protocol with those of the currently used methodologies, the suggested drop – outs estimation framework is examined. Some performance metrics are used to make the comparison. The suggested model’s set of data was compiled using the survey strategy. The following is a discussion of the suggested new framework-specific supremacy measure.
Performance evaluation of the suggested LSOWL -CNN
Using measurements such as accuracy, recall, precision f-measure with precision and sensitivity, as well as NPV, FPR, FNR, MCC, and False Rejection Rate, the effectiveness of the proposed classification method is approximated (FRR). CNN, ANN, RNN, and deep neural networks are the methods currently used for evaluation (DNN). Following is a graphical representation of exact precision.
Table 1: The accuracy and accuracy of the proposed and extant tricks of the trade outcomes
| TECHNIQUES | PROPOSED LSOWL-CNN | CNN | ANN | RNN | DNN |
| ACCURACY (%) | 96.8176 | 94.4105 | 91.7162 | 88.2044 | 85.3719 |
| PRECISION (%) | 94.6501 | 92.1415 | 88.0522 | 87.4834 | 83.0622 |
Table 1 above can be visualised as the following graph:
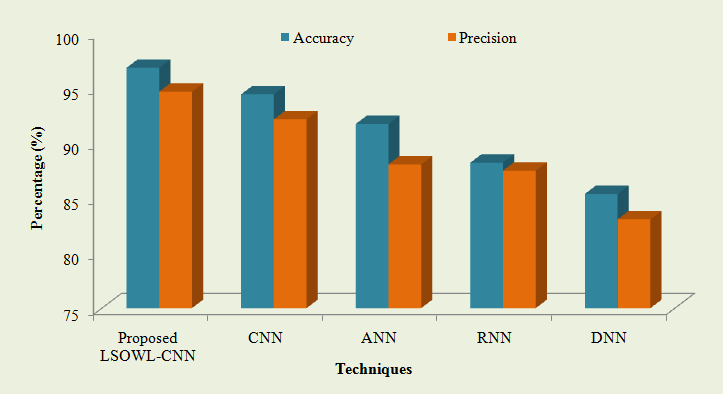
Fig 6: Performance evaluation based on precision and accuracy
The accuracy and precision performance measures of the proposed and current categorization techniques are shown in Table 1 and Fig 6. The suggested LSOWL-CNN classification method achieved accuracy and precision of 96.8176% and 94.6501%, both of which are shown in the aforementioned table and graph. The accuracy of the current classifiers, however, was 91.7162% for the ANN, 88.2044% for the RNN, and 94.4105% for the CNN (DNN). The current classifiers have a precision of CNN scored 92.1415%, ANN 88.0522%, RNN 87.4834%, and CNN 83.0622%. (DNN). It is evident from the findings that the suggested classifier outperforms the current methods based on the outcomes obtained by the proposed and existing classifiers. Recall, F-measure, Sensitivity, and Specificity tabulation results are shown as,
Table 2: Comparison of the proposed LSOWL-superiority CNNs to existing methods
| Techniques | Proposed LSOWL-CNN | CNN | ANN | RNN | DNN |
| Recall (%) | 97.4687 | 95.4255 | 92.3462 | 90.3584 | 89.1552 |
| F-measure (%) | 95.71357 | 93.19112 | 90.19112 | 87.34007 | 84.39142 |
| Sensitivity (%) | 97.4687 | 95.4255 | 92.3462 | 90.3584 | 89.1552 |
| Specificity (%) | 92.8338 | 91.3958 | 88.6115 | 84.7415 | 83.0451 |
The outcomes of the suggested high dropout prediction model are presented in Table 2, along with a variety of Recall, F-measure, responsiveness, and selectivity, which are examples of performance measures. The precise way in which the method classifies the outcome is determined by recall. The greater recall rate indicates that the system results in good results. Outcome: The recommended work recall score is 97.4687%. Despite the low recall achieved by the current methods. The f-score measures the weighted harmonic mean of its recall and precision in a manner similar to that. Perfect recall and precision are indicated by the maximum f-measure. As an outcome, compared to other currently employed methods, the proposed scheme for predicting student drop-outs achieves an f-measure of 95.71357%, which is greater. Sensitivity measures the proportion of actual positive instances that were assumed to be positive, much like specificity does the same for actual negative cases that were predicted to be negative. This accurate forecast of both adverse and favourable outcomes, when compared to earlier works, demonstrates the system’s peak performance. The suggested method, therefore, offers the greatest f-measure sensitivity, specificity, recall and sensitivity. As a result, it is clearer than ever that the suggested method is better than the other standard technology. NPV and MCC’s overall performance are illustrated visually in the examples that follow:
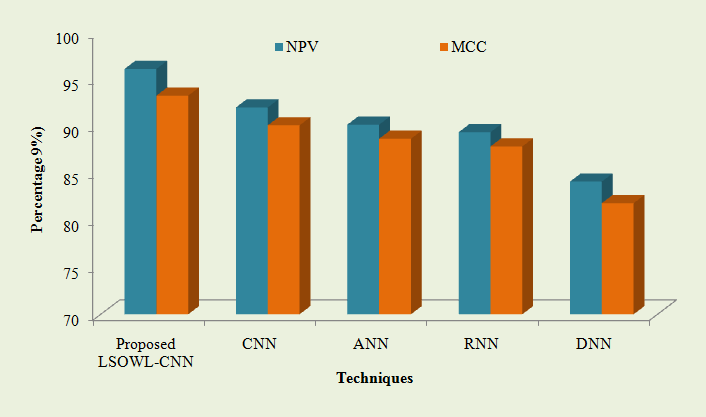
Fig 7: The suggested LSOWL is compared -performance CNNs NPV and MCC are utilized with CNN, ANN, RNN, and DNN.
Fig 7 shows that the proposed method’s NPV and MCC achieve impressive results when compared to the current classification models. The suggested LSOWL-NPV CNN is 96.1132%, and its MCC is 93.2673%, according to the graph. On the other hand, the currently used methods only achieve Limited NPV and MCC of 84.1211%, 81.8258%, 92.0128%, 90.1079% (CNN), 90.1785%, 88.6775% (ANN), 89.3753%, 87.8561% (RNN), and 90.1785%, 88.6775% (ANN). (DNN). In light of this, the suggested system involves predicting drop-outs among students while getting higher NPV and MCC. Below are the tabulated results of the measuring performance for FPR and FNR.
Table 3: Analysis of proposed and existing classification techniques’ performance using FPR and FNR
| TECHNIQUES | PROPOSED LSOWL-CNN | CNN | ANN | RNN | DNN |
| FPR | 0.02137 | 0.18401 | 0.21259 | 0.49962 | 0.61539 |
| FNR | 0.01584 | 0.10747 | 0.25168 | 0.29289 | 0.48128 |
The aforementioned table evaluates the effectiveness of the proposed LSOWL-CNN classifier by contrasting its FPR and FNR results with those of various other methods already in use. According to experimental results based on FPR and FNR, the suggested dropout predictive algorithm is capable of achieving an FPR of 0.02137 and an FNR of 0.01584. Comparing these values to the classifiers currently in use, they are incredibly low. The FPR for the current methods is 0.18401 for the CNN, 0.21259 for the ANN, 0.49962 for the RNN, and 0.61539 for the RNNN (DNN). Likewise, the FNR values of the current models are also high. Consequently, the recommended LSOWL-low CNN’s FPR and FNR. The structure demonstrates the improved effectiveness of the layout due to the fact that FNR is a measurement of incorrectly classifying the absence of certain conditions when they are actually present, while FPR defines the inaccurate categorization of the presence of certain situations when they are missing. Therefore, the lowest value of these metrics exhibits the excellent performance of the proposed system. Fig 8 displays graphically the FRR rate of the present scheme.
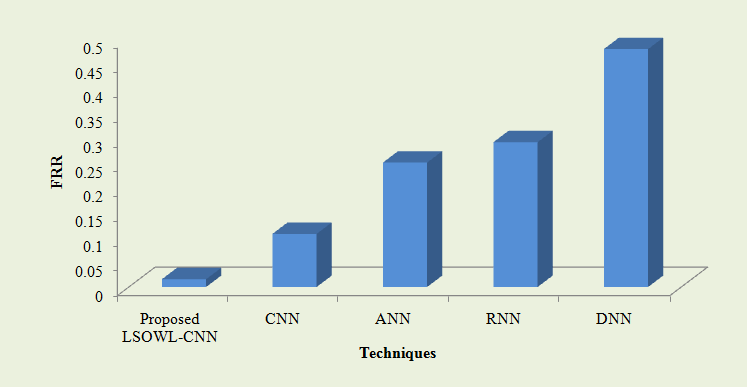
Fig 8: Evaluation of the proposed LSOWL-performance CNNs with that of the FRR-based CNN, ANN, RNN, and DNN currently in use
Fig 8 compares the suggested LSOWL-CNN with current methods based on FRR. The probability that the system will incorrectly dismiss the precise outcome is measured by the FRRLow FRR, which indicates improved performance results. As a result, the suggested system’s FRR achieves a low FRR of 0.01584. In contrast, the current CNN has an FRR of 0.10747, which is barely greater than the suggested design. Additionally, the suggested system’s FRR is 0.25168 compared to the current ANN’s 0.25168. Similar to the proposed method, the other established classifiers have a higher FRR rate. It follows that the suggested system performs more effectively than the current drop-out prediction. As a result, it is clear from the entire conversation that the suggested drop-out prediction framework produces excellent results and performs better than other cutting-edge techniques. In the meantime, according to the suggested framework, the dropout rate also gradually declines. It is made public below.
Table 4: According to the advice given to the students, the suggested framework will calculate the drop-outs and non-dropout rates.
| TECHNIQUE | PROPOSED DROPOUT PREDICTION MODEL |
| Dropout (%) | 28 |
| Non-Dropout (%) | 72 |
Below is a graphic representation of the aforementioned table.
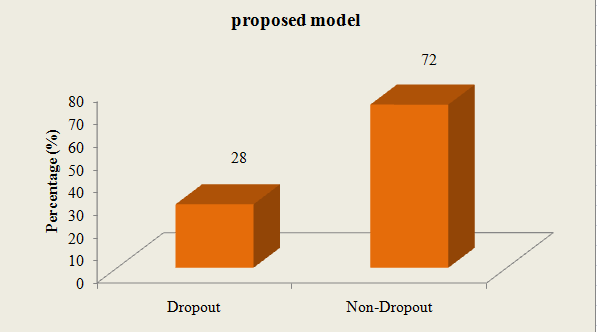
Fig 9: A visual representation of the suggested system’s drop-out rate
Utilizing the suggested framework has resulted in a reduction in the drop-out rate, as shown in Table 4 and Fig 9The suggested student dropout prediction system reduces the likelihood of students dropping out of their studies by offering advice to both drop-outs and non-dropout students. The dropout rate is reduced by 28% per 100 students when the suggested model is used. This is due to the suggested work’s early identification of students who intend to discontinue their studies and the subsequent provision of the appropriate suggestions to those students in order to change their original plan. This makes the suggested system superior to other drop-out prediction methods.
Conclusion
Around the world, crucial issues with early leaving and student retention affect both secondary and higher education. Recent research has been very interested in issues like predicting student performance, preventing failure, and figuring out what causes students to drop out. This study proposes a method for classifying dropout rates using LSOWL-CNN and makes recommendations in line with it using education data mining. The training and testing data for this model are drawn from a dataset that is available publicly and includes some personal and academic information about the students as well as survey information created based on the responses provided by the students on the online application. In the beginning, characteristics are extracted from the cleaned data. A collection of fuzzy rules is then developed for better classification after the characteristics have been further lowered. Based on the information given by the students, the classifier divides the students into drop-outs and non-drop-outs. The suggested model’s FPR and FNR are 0.02137 and 0.01584, respectively, and the classification algorithm accurately categorises the student’s educational level with an accuracy of 96.8176%. Due to the proposed system’s low FPR, FNR, and high accuracy, it outperforms all other techniques. Additionally, by making recommendations based on the suggested classification, the dropout rate of the students is reduced while the non-dropout rate, which is 72%, rises. Thus, it can be said that the suggested system is superior in terms of categorisation and non-dropout rate. By boosting the non-dropout rate and categorization precision by utilising deep learning models, this system can be further enhanced in the coming years. The goal of this work’s future versions is to enhance the methodology by identifying the variations in students’ personas and skills using a longitudinal design.
References
Marcell Nagy and Roland Molontay, “Predicting dropout in higher education based on
secondary school performance”, 22nd IEEE International Conference on Intelligent Engineering Systems, June 21-23, Las Palmas de Gran Canaria, Spain, 2018.
Robert S. Dembo and Jennifer La Fleur, “Community health contexts and school suspensions of students with disabilities”, Children and Youth Services Review, vol. 102, pp. 120-127, 2019.
Ambili K and Afsar P, “A framework for learning disability prediction in school children using artificial neural networks”, International Journal of Advanced Research in Science,
Engineering and Technology, vol. 3, no. 6, pp. 2312-2316, 2016.
Coussement, K., Phan, M., De Caigny, A., Benoit, D.F. and Raes, A., 2020. Predicting student dropout in subscription-based online learning environments: The beneficial impact of the logit leaf model. Decision Support Systems, 135, p.113325.
Kabathova, J. and Drlik, M., 2021. Towards predicting student’s dropout in university courses using different machine learning techniques. Applied Sciences, 11(7), p.3130.
Angela M. T Prince, Janie Hodge, William C. Bridges and Antonis Katsiyannis, “Predictors of postschool education/ training and employment outcomes for youth with disabilities”, Career Development and Transition for Exceptional Individuals, vol. 41, no. 2, pp. 1-11, 2017.
Dale Rennard Rose, “A quantitative correlational study of Georgia high school graduation and retention rates of students with disabilities”, Thesis, Northcentral University, 2018.
Dass, S., Gary, K. and Cunningham, J., 2021. Predicting student dropout in self-paced MOOC course using random forest model. Information, 12(11), p.476.
Mayra Alban and David Mauricio, “Predicting university dropout through data mining a systematic literature”, Indian Journal of Science and Technology, vol. 12, no. 4, pp. 1-12, 2019.
Jong Hyuk Lee, Mihye Kim, Daehak Kim and Joon-Min Gil, “Evaluation of predictive models for early identification of dropout students”, Journal of Information Processing Systems, vol. 17, no. 3, pp. 630-644, 2021.
Isiaka R. M, Babatunde R. S, Ajao F. J and Abdulsalam S. O, “A machine learning approach to dropout early warning system modeling”, International Journal of Advanced Studies in Computer Science And Engineering, vol. 8, no. 2, pp. 1-1, 2019.
Hanan Aldowah, Hosam Al-Samarraie and Wan Mohamad Fauzy, “Educational data mining and learning analytics for 21st century higher education a review and synthesis”, Telematics and Informatics, vol. 37, pp. 13-49, 2019.
Thiago M. Barros, Plácido A. Souza Neto, Ivanovitch Silva and Luiz Affonso Guedes, “Predictive models for imbalanced data a school dropout perspective”, Education Sciences, vol. 9, no. 4, pp. 1-17, 2019.
Hasniza Hassan, Syahid Anuar and Nor Bahiah Ahmad, “Students performance prediction model using meta-classifier approach”, Medizinische Verlags-Und, 2019, ISBN: 978-3929851380.
Cristobal Romero and Sebastian Ventura, “Educational data mining and learning analytics an updated survey”, WIREs Data Mining and Knowledge Discovery, 2020.
Raheela Asif, Agathe Merceron, Syed Abbas Ali and Najmi Ghani Haider, “Analyzing undergraduate students performance using educational data mining”, Computers and Education, vol. 113, pp. 177-194, 2017.
Aishwarya Suresh, Sushma Rao H. S and Vinayak Hegde, “Academic dashboard prediction of institutional student dropout numbers using a naïve Bayesian algorithm”, Springer, 2017, ISBN: 978-981-10-3934-8.
Phanupong Meedech, Natthakan Iam-On and Tossapon Boongoen, “Prediction of student dropout using personal profile and data mining approach”, Springer, 1st ed. 2017, 2016, ISBN: 978-3-319-26999-3.
Gonen Singer, Maya Golan, Neta Rabin and Dvir Kleper, “Evaluation of the effect of learning disabilities and accommodations on the prediction of the stability of academic behaviour of undergraduate engineering students using decision trees”, European Journal of Engineering Education, vol. 45, no. 2, pp. 1-18, 2019.
Bhat, G.S., Shankar, N., Reddy, C.K. and Panahi, I.M., 2019. A real-time convolutional neural network-based speech enhancement for hearing impaired listeners using smartphone. IEEE Access, 7, pp.78421-78433.
Sunbok Lee and Jae Young Chung, “The machine learning-based dropout early warning system for improving the performance of dropout prediction”, Applied Sciences, vol. 9, no. 15, pp. 1-14, 2019.
Jay S. Gil, Allemar Jhone P. Delima, Ramcis N. Vilchez, “Predicting students dropout indicators in public school using data mining approaches”, International Journal of Advanced Trends in Computer Science and Engineering, vol. 9, no. 1, pp. 774-778, 2020.
Roderick Lottering, Robert Hans and Manoj Lall, “A machine learning approach to identifying students at risk of dropout a case study”, (IJACSA) International Journal of Advanced Computer Science and Applications, vol. 11, no. 10, pp. 417-422, 2020.
Muhammad Sammy Ahmad, Ahmed H. Asad and Ammar Mohammed, “A machine learning based approach for student performance evaluation in educational data mining”, 26-27 May, Cairo, Egypt, 2021.
Azizan, C.R., Roslan, S., Abdullah, M.C., Asimiran, S., Zaremohzzabieh, Z. and Ahrari, S., 2021. Does a Person-Environment-Fit Promote the Academic Achievement of Hearing-Impaired Students in Malaysian Polytechnics? The Mediating Effects of Satisfaction and Adjustment. International journal of environmental research and public health, 18(24), p.13381.
Cite This Work
To export a reference to this article please select a referencing stye below:

Academic Master Education Team is a group of academic editors and subject specialists responsible for producing structured, research-backed essays across multiple disciplines. Each article is developed following Academic Master’s Editorial Policy and supported by credible academic references. The team ensures clarity, citation accuracy, and adherence to ethical academic writing standards
Content reviewed under Academic Master Editorial Policy.


