The Coriolis Effect forms the principal basis for the conception of the Coriolis flow meter. The Coriolis effect comes about as a result of the Coriolis force. The force is one of the two primary forces that on a body on rotating frame, the other one being centrifugal force. Centrifugal force comes about when Newton’s laws of motion are applied to a rotating frame. In essence, the centrifugal force is an inertial force that acts on a body as it rotates. The force acts away from the axis of rotation and has the effect of propelling a body tangentially from the rotational frame. In comparison, the Coriolis force acts in a direction perpendicular to the axis of rotation. It is proportional to the velocity component of the body acting perpendicular to the axis.
History of the Coriolis Effect
The history of the Coriolis force dates back to the late 16th century and mid 17th century. A French mathematician, Gustave-Gaspard Coriolis, who doubled up as a highway engineer is credited for the earliest mathematical equations describing the phenomenon. In fact, the Coriolis phenomenon is named after him. The mathematician conducted his research while working as a professor at the Ecole Centrale des Arts Manufactures and the Ecole des Ponts et Chausses. His research majored in the motion of machine parts in the broader context of applied mechanics. In fact, he is the one who gave the terms ‘kinetic energy’ and ‘work’ their scientific meanings. His works on the Coriolis effect led to the publication of several books on the subject. Some of the most famous ones include ‘Du Calcul de l’effect des Machines’; whose English translation is ‘the calculation of mechanical action.’ Another is the ‘Theorie math, matique des effect due jeu de billiard,’ the English translation of the book titles it ‘the mathematical theory of the game of billiards.’ The most widely circulated and famous book on the subject is termed ‘Sur les equations du movement relative des systems des corps,’ whose translation is ‘on the equation of relative motion of systems of body.’ At the time of his research, the professor used his understanding of the Coriolis effect to describe the phenomena in nature, thereby transforming nature-based sciences of the time such as meteorology and oceanography. It was until later, did the Coriolis effect begin its application into machines and real mechanics.
Earliest understanding of the Coriolis effect
The earliest applications of the Coriolis effect were related to offering explanations about the earth’s rotation. In fact, the earliest development of the theory came from the observation that as the earth rotates, it deflects projectiles and bodies experiencing free fall. In more detail, scientists at the time observed that when a body is dropped from a high position, it does not fall directly perpendicularly below the point of drop. On the contrary, it falls slightly away from the path of the drop. The explanation for this is that the body has a momentum deflecting it from the original path termed as the Coriolis force. A pictorial explanation, as presented by the early scientists, is presented below.
(Graney, 2017)
A body dropped from F will not fall at G but I due to the effect of arc FHLG created by the earths rotation.
Modern understanding of the Coriolis Effect
Scientists have since refined the theory to enable its applications in the field of applied mechanics. A modern understanding of the theory poses that the Coriolis force results only during the rotation of bodies around an axis. In such times, the force acts like a real force. In that regard, it leads to acceleration and other effects associated with real Newtonian forces. The force is, however, a consequence of inertia, and as such, it cannot be attributed to the body on which it acts. This distinguishes the forces from other forces which are linked to their respective bodies. For example, nuclear forces originate from within the matter in question. The force comes about from the changes in velocity as a body moves about a rotational frame of reference. Here, two changes in velocity emerge. The first occurs as the object changes velocity over time, the second happens as the velocity changes over the space of rotation. Thus, velocity, time and space come out as the dominant parameters affecting Coriolis force. A dimensionless number, termed ad the Rossby’s number, describes the relationship between these parameters. Rossby’s number is given by the velocity of the body under rotation, divided by the product of a Coriolis parameter and the length of the scale of motion. In essence, the number represents the ratio of the forces of inertia to the Coriolis forces. Thus, a high Rossby’s number is indicative that the body is experiencing high inertial as compared to Coriolis forces. A small Rossby’s number, on the other hand, indicates that Coriolis forces dominate a system as compared to inertial forces.
Application of the Coriolis Effect to flow meters
Advantages of Coriolis Flow meters
Coriolis effect is often applied to the construction of flow metering devices, where it presents multiple advantages. First, Coriolis flow meters can measure the mass flow rate. This is a huge advantage considering that many flow meters that are based on pressure differentials, only measure volumetric flow. Measuring volumetric flow, though common, poses a challenge when the products being measured are sold in mass as opposed to volumetric quantities. For example, in the chemical industry, fluids are sold based on their mass as opposed to volume due to density changes. Similarly, mass flow is important as a basis for measurement in the gas industry because gasses are more susceptible to temperature changes as compared to liquids. Secondly, coriolis flow meters have a high degree of accuracy as compared to convectional meters. For example, many magnetic flow meters pose an accuracy level of about 0.5 %. In comparison, Coriolis flow meters have an accuracy level of about 0.1 %. Thus, many companies that seek highly accurate measurements for their flows often turn to Coriolis Flowmeters as opposed to conventional meters.
How the Coriolis Effect is deployed in flow meters
Coriolis flowmeters take advantage of the fact that when fluids flow through tubes in an oscillatory motion, the tubes will twist due to the Coriolis effect. The degree of twist is, however, proportional to the mass flow rate of the fluid in the tube. Thus, a typical Coriolis flow meter will have two tubes. The tubes will be made to vibrate in opposite directions using a magnetic coil, with sensors situated at the inlets and the outlets of the tubes. Usually, the sensors are made of magnetic coils; thus, as the tubes move, the magnetic coils will also move, generating sine waves. At zero or no flow conditions, the sine waves at the inlet and outlet sections of the tubes will remain in phase. However, during flow conditions, the tubes will twist in the proportion of their masses. The degree of twist can be accurately depicted by the phase shifts as detected by the sine waves generated by the sensors at the inlet and outlet of the tubes. Given that the shifts are directly proportional to the mass flow rate, then, the mass flow rate is easily calculated from the phase shifts indicated by the sensors.
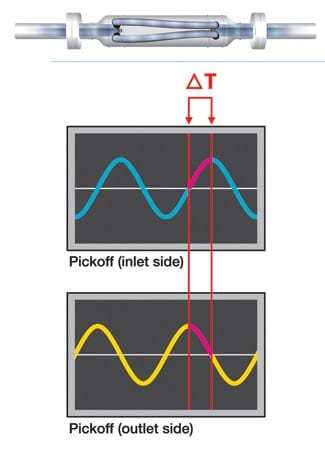
(Yoder, 2018)
Coriolis flow meter in oil bunker industry
Coriolis flow meters have been routed for the bunker industry largely because of their ability to measure mass flow. Previously, the oil bunkering industry extensively relied on volumetric flow measurement using conventional metering devices. This has since led to several limitations such as inaccuracy in measurements. Consequently, many companies in the oil bunkering industry are now considering mass flow measurement using Coriolis flow meters. The use of Coriolis flow meters in the bunker industry provides additional advantages applicable to the industry. Most notably, the accuracy that results from the use of Coriolis flowmeters enhances tighter control in the industry. This leads to increased visibility in the amount of fuel consumed, which in turn augments efforts aimed at improving fuel efficiency. Other reasons why Coriolis meters are being considered for the bunker industry are discussed below.
Faulty volumetric flow meters
As pointed out earlier, many meters in the bunker industry are volumetric based. Usually, such meters are highly susceptible to wear and tear due to the presence of several moving parts in the devices. The wear and tear in the devices are likely to lead to huge errors and malfunctioning meters. Moreover, huge costs are required to restore the meters to an optimal state. Here, Coriolis flow meters provide an excellent alternative considering that the device does not have several moving parts. Thus, the meter is less susceptible to the effects of wear and tear and the subsequent demerits created by the same. What is more, the meters do not require much maintenance leading to cost savings.
Tampering of metering devices
Conventional metering devices used in the bunker industry have separate pressure and temperature gauges. The gauges could be easily tampered with particularly when working with gauges filled with non-aqueous fluids such as silicon and glycerin. In comparison, Coriolis flow meters and other mass flow based meters can measure pressure and temperature simultaneously through the use of in-built sensors. This makes them more suitable than traditional metering devices.
Entrenched air in the system
In many cases within the bunker industry, air enters the system especially when changing tanks or changing valves. Air may also be trapped in the system due to deliberate actions such using a hose to blow compressed air into the system. This is mostly done by conmen in the industry who blow air instead of fluid into the system to give the impression that the fuel is being pumped just as ordered. Unfortunately, volumetric flow meters cannot detect such air in the system. In comparison, Coriolis flow meters can easily detect air in the system mainly because they rely on mass flow as opposed to volumetric flow measurement. Again, this gives it an edge over conventional metering devices.
Quantity tolerance
Coriolis flow meters have been proven to provide a much less tolerance level as compared to conventional flow meters. In fact, experiments have shown that Coriolis flow meters can give an average tolerance level of 0.5 %. Taking this value for the case of large sterns of over 2000 tones yields huge benefits for bunker companies.
Errors
Volumetric flow meters are susceptible to errors created due to variations in temperature and density. These errors can easily become huge quantities especially when compounded together. This calls for adjustments during calculations to cater for the expected errors. In comparison, Coriolis flow meters measure mass directly by taking into account temperature and pressure changes. This eliminates the efforts needed in adjusting calculations.
Literature review
Literature on the viscosity and mass flow rate of oil and water
The concept of viscosity
Viscosity refers to the rate of fluid resistance to deformation under stress from shear or tensile forces. The phenomenon comes about as the molecules in a fluid interact during the motion of the fluid. Other words used to describe the phenomenon include fluid thickness or the internal stress of a fluid.
An ideal fluid is another important concept when discussing the viscosity of a fluid. Such a fluid is one that does not exhibit any form of internal resistance at all. In reality, ideal fluids do not exist because all fluids have some degree of internal resistance. Thus, the term is used on a theoretical basis. The subject of viscosity falls within the wider science of rheology. The science focuses on flowing matter and related properties that include viscosity.
The mathematics of viscosity begins with the assumption that fluids exist in layers during any type of flow. The layers flow at different velocities over each other. Viscosity arises due to the stress that exists between each of the layers as they exhibit some form of flow. The stress resists the force seeking to create the flow. The concept is elaborated using the below diagram. 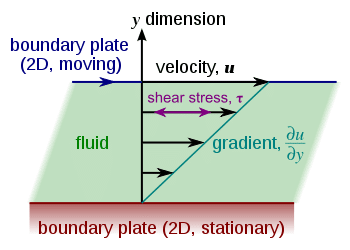
The image assumes two plates spaced at a distance y, and separated by a homogenous substance. Assuming the plates are infinitely large as to have an area denoted by A, then, the effects of the boundaries can be ignored. Applying a force F to the upper plate when the lower plate is stationary will result in the fluid undergoing some form of flow across the velocity gradient indicated by the diagram as u. ideally, the applied force will be proportional to the area denoted by A. The velocity gradient, on the other hand, will be inversely proportional to the distance between the upper and lower plates. Combining all these, as shown in the next diagram, will result in the following equations 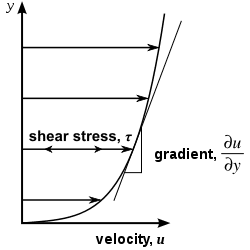
F=(µAu)/y, where µ denotes the proportionality factor termed as viscosity. The equation can be expressed in terms of shear stress, where stress=F/A. The stated equations are sometimes referred to Newton’s laws of viscosity. The law holds for some materials commonly called Newtonian fluids. In comparison, non-Newtonian fluids exhibit a more complicated relationship. Other types of viscosity include shear thickening. This refers to a situation where the viscosity will increase with the rate of shear. Another is shear thinning. In this case, the viscosity decreases with the rate of shear. Thixotropic materials refer to fluids that reduce their viscosity over time particularly when shaken or stressed. Rheopectic materials, on the other hand, increase in viscosity when subjected to stress over time. Lastly, Magnetorheological fluids, commonly called smart fluids will increase in viscosity when subjected to a magnetic fluid.
The concept of viscosity coefficients is also important when discussing viscosity. Kinematic viscosity coefficient refers to the ratio of dynamic viscosity and density of the fluid. Shear viscosity, which is the most common connotation of viscosity, refers to the ratio of pressure asserted on a fluid to the change in velocity of the fluid as it moves over a plane of reference. Bulk or volume viscosity is applied when dealing with the degree of compressibility of fluids. The ratio between bulk and shear viscosity is termed as extensional viscosity. Fluidity is another term used in the science of viscosity. This refers to the reciprocal or inverse of viscosity. In essence, the term refers to the ability to flow as opposed to resistance to flow. The concept is usually used when analyzing ideal fluids. Viscosity index describes the change in kinematic viscosity over time.
Rheometers and viscometers are some of the common devices used to measure viscosity. The former is used for fluids that vary in viscosity over a range of parameters such as temperature. The latter is used for fluids that have a relatively stable viscosity value over a range of parameters.
The gas capillary viscometers are used for measuring the kinematic viscosity of fluids. The Zahn cup is the most widely used device in industrial scales. The efflux time is the output of the device. The output can be easily converted to relevant viscosity values using standard equations. A ford viscosity cup is another device for measuring viscosity in industrial scales. The device measures the rate of fluid flow. The value is often proportional to kinematic viscosity making it possible to obtain the value using relevant equations.
The Greek term µ is the most widely used symbol to describe the phenomenon of viscosity. Pascal-second is the main SI unit for measuring it. Here, one Pascal-second refers to a situation where the shear stress of one Pascal pushes a fluid over the thickness of the boundary layer between two plates in one second. The Poise is the cgs physical unit for describing viscosity. The British system of measurement uses a separate unit termed as the Reyn to denote viscosity.
Relationship between viscosity and mass flow rate in oil and water
In general, the law governing the relationship between viscosity and mass flow rate can be derived from Poiseuille’s law describing laminar flow in a closed tube. The law poses that the flow rate in a closed tube is given by the ratio of pressure drop in the tube to the resistance to flow. Noting that the resistance to flow is directly proportional to viscosity, then, the conclusion that viscosity is inversely related to the mass flow rate of a fluid is correct. 
The above image illustrates the relationship. The image shows flow along a pipe. From the diagram, the flow rate is given by the pressure drop divided by the internal resistance to flow as indicated by the second equation. R is directly proportional to viscosity. Thus, mass flow rate and viscosity have an inverse relationship.
Viscosity of oil
The American society of tribologists and lubrication engineers identifies viscosity as one of the most important material properties of Oil. Its importance stems from the fact that the value of viscosity can give vital information on the condition of oil for industrial and other applications. Usually, kinematic and dynamic viscosity are the two types of viscosity used to describe the property of oil. The former refers to the resistance of the oil to flow. It comes about due to shear and gravitational forces. The latter, on the other hand, refers to the viscosity of the oil due to internal friction.
The measurement of the viscosity of oil increases its usability because the functionality of the fluid largely depends on its viscosity. For instance, a huge reduction of the viscosity of oil may lead to increased wear in the area of application. Additionally, it may lead to increased friction and oil failure. Similarly, a sudden increase in viscosity may lead to increased cavitations in pumps and lubrication starvation. The former usually results due to the formation of air bubbles at high oil temperature; whereas, the latter comes about due to inadequate oil flow.
Capillary tubes are the most common devices used to measure the viscosity of oils. A standard process of measuring the viscosity will begin with the fluid being placed in a capillary tube. Suction is then applied to the fluid until it reaches the start position indicated on the side of the capillary tube. After that, the suction is released, allowing the fluid to flow back into the device under the forces of gravity. The flow rate of the fluid is obtained and used to gauge viscosity. Here, oil of high viscosity will take longer to flow into the tube as compared to oil of lower viscosity. The capillary tube reports viscosity of oil in centistokes.
For standardization, the viscosity of many oils is measured at temperatures of around 40 degrees. This is the standard ISO temperature for measuring viscosity. Different temperatures are sometimes used. For example, the viscosity of many engine oils is measured at 100 degrees due to regulations by the SAE. What is more, measurements at 100 degrees reduces interference and the contamination of engine oil. Viscosity index is another common feature when measuring the viscosity of oils. The term denotes the changes in the kinematic viscosity in relation to temperature. Usually, the figures are presented in tables.
The importance of the viscosity of oils is reemphasized in the bunker industry. Information on the viscosity of oil in the sector is important for several reasons. For example, the value is used to determine the temperature handling the oil when injecting it into the engine. In many cases, oil suppliers will publish and use viscosity charts, which are based on the data for large samples. Estimations from the charts are however not entirely accurately. Thus, other suppliers have opted for flow meters from which the flow rate is obtained and used to find the value of the viscosity at specified temperatures. The following table shows the injection temperatures for specific viscosity values in the oil bunker industry.
| Injection temperatures for range of viscosities | |||||
| Injection Viscosity | Injection Viscosity | ||||
| Fuel | 13 cSt | 17 cSt | |||
| IF 180 | 119°c | 109°c | |||
| IF 200 | 121°c | 111°c | |||
| IF 220 | 123°c | 113°c | |||
| IF 240 | 125°c | 115°c | |||
| IF 380 | 134°c | 124°c | |||
| IF 400 | 135°c | 125°c | |||
| IF 240 | 136°c | 126°c | |||
| IF 460 | 138°c | 127°c | |||
Viscosity of water
The measurement of the viscosity of water is equally important to enhance its functionality. For instance, low values of water viscosity enhance the properties of the fluids as a solvent in chemical reactions. Accurate values for water viscosity are also important for the industrial application of the fluid. The viscosity of water is usually presented in tables such as the one below. The table shows viscosity, temperature, and density of water, all of which are interrelated.
Viscosity of Water
|
An important property of the viscosity of water that can be deduced from the table is the fact that for water, viscosity reduces consistently with temperature from the freezing point; while this is happening, the density remains the same up to about 4 degrees. .
Viscosity of water in oil emulsions
Water in oil emulsions are a common feature in the oil industry. During production, the quantity of water can be as high as 60 %. Additionally, the quality of water in the oil is relatively low during the refining process. Thus, information on the viscosity of water in oil emulsions is highly important in the industry. The viscosity of water in oil emulsions depends on several variables. These include the viscosity of the oil or continuous phase of the fluid; the volumetric fraction; Newtonian properties such as shear and temperature. Of these, two have the largest effect on viscosity namely temperature and volume fraction.
Recent literature has further indicated that packing droplets in the dispersion phase of the oil-water emulsion further influences its viscosity. The way the water droplets affects viscosity is not well understood. However, several recent experiments can give insights in to the phenomenon. For example, in a study seeking to investigate the relationship between viscosity of an emulsion and its drop size distribution in the dispersion phase, conducted by Pal (2000), the researchers made some noteworthy observations. Using stress-controlled rheometers, the researchers observed that the emulsion displays Newtonian behavior at low to moderate values of water cut. At higher values, the fluid displayed shear-thinning behavior, where a significant increases in viscosity were observed with reduced droplet size.
In a separate research by Abivin et al. (2009), the researcher observed that at low shear rates, the emulsions display Newtonian behavior of viscosity. However, at higher shear rates, shear thinning results where the viscosity increased with reduced sizes of droplets. In summation, the two pieces of research provided that the viscosity of water-oil emulsions is affected by the size and geometry of droplets in the dispersed phase of the emulsion. Other researches, particularly on petroleum reservoir, have shown that pressure also plays an important role in determining the viscosity of the oil-water emulsion. Sadly, research in this area remains limited.
Coriolis flow meters and the measurement of viscosity
Coriolis flow meters can be adapted for the measurement of viscosity. This practice is common in the oil industry. Usually, a pressure differential meter is placed across the Coriolis device. The meter records the pressure difference across the meter as the fluid passes through it. The viscosity is then obtained using calculations as per Poiseuille’s equations. This method for measuring viscosity, despite its wide adoption, has several limitations. For instance, Poiseuille’s equations are valid only during a laminar flow of Reynold number below 2000. This creates the need for expensive meters to reduce the flow velocity to laminar.
Literature on the coriolis flow meter in the bunker industry
Literature on the bunker industry presents it as a multibillion-dollar sector. Henry (2010) observes that as of 2006, the industry transacted over 350 million tons of fuel. This amounted to about 150 billion dollars in revenue for the industry. At present, the Asia pacific forms the main market for the bunker industry. Two nations in this region, namely Singapore and china have collectively made the largest contributions to the industry. Europe comes second in bunker fuel consumption. Russia, on the other hand, stands out as the main supplier of oil in the industry. The prices in Europe are comparatively lower than the prices in other places because of the close proximity to Russia. Moreover, the bunkering facilities in Europe are also modernized and well developed. Consequently, the turnaround or vessels in the region is much faster than in other places around the globe. Some of the notable ports in Europe that account for a bulk of the bunking operations include Rotterdam, Piraeus and Antwerp.
What is more, the outlook of the industry shows that is likely to experience tremendous growth in the future. Increasing off shore activities is one of the main reasons for this expansion. About that, a huge proportion of firms in the industry have relocated their operations to off shore destinations and strategic ports that are nearer to fuel resource sites. This development is expected to boost profits for the companies and to lead to an expansion of the bunker market in general. A reduction in the prices of crude oil is the second positive trend in the industry. Concerning that, recently, the crude oil prices have faced significant drops around the globe. this has led to increased bulk purchases and storage in the industry. This, in turn, has led to increased movement of crude oil tankers around the world thereby boosting the demand for bunker fuel on a global scale.
Environmental concerns have emerged as the main challenge in the industry. Here, marine pollution and emissions in the industry have attracted much attention from worldwide governments and activist groups. This has led to increased scrutiny and regulations in the industry. The development if not well checked and addressed is likely to lead to adverse effects to many companies in the industry.
Companies in the industry are enjoying huge profits as the industry expands. Taking the case of a major player in the industry such as Eclosops, a firm that specializes in the recycling of fuels in the bunker industry; the company boasted of double profit figures in 2017 as compared to the previous year. The company notes that this impeccable performance came about because it sold all its production to prospective customers. The firm further notes, that the refined product category now accounts for over 60 % of its sales, an increase from 30% in the previous year.
Many bunker suppliers are also planning for huge expansions as the future of the bunker industry continues to look attractive. For example, just recently, the media came alive to the news of planned expansions by many suppliers in Singapore. The nation is strategically located in the bunker industry. In that concern, the country is situated in one the busiest water ways in the world. Reports from the Maritime and Port authority of the country, give a figure of 138, 998 vessels arriving in the country every year. Consequently, the nation doubles up as the biggest bunkering port in the world. In 2016, the bunker fuel sales in the nation rose by 7.7 %. Thus, bunker suppliers in the industry are planning to seize the favorable outlook to expand operations.
Measurement is an integral part of the industry. In that regard, the economic and environmental value of the bunker industry is strongly tied o the accuracy of the measurements in the sector. Typically, measurements happen during the bunkering process. The bunkering process refers to the physical transfer of fuel in ships at specific material properties such as density, viscosity, and sulfur content. The process demands an accurate system of measuring and monitoring the quantity and the properties of fuel involved in the bunkering process.
Typically, two types of fuel exist in the bunkering industry. These are distillate grade of fuels and residual grades of fuels. The former describes fuels that exist in oil or gaseous states. The latter, on the other hand, describe the oil that remains after all the valuable components are removed during the refining process. Residual grade is sometimes referred to as crude oil. At present, this type of fuel comprises of about 90 % of the fuel in the bunkering industry.
Another feature of the bunker industry is what is commonly termed as tank stripping. This refers to the process where the last batch of fuel in a storage tank together with air are pumped out of the tank before another batch of fuels is pumped into the bunker. Usually, many modern tanks have a capacity of about 4000 tons. A standard process will have about 10 storage tanks. Thus, the time taken for any bunking process will comprise of the time taken for fuel transfer and bunk stripping.
Nowadays, the most common system of measuring the rate of fuel transfer in the bunker industry is referred to as tank dipping. Here, the quantity of fuel in each storage tank is measured and recorded together with its corresponding properties such as temperature and density. The procedure is conducted at the beginning and end of the transfer process. The dip levels from the tank dipping process are mapped out to their corresponding volumes using standard tables. The volumes at the beginning at the beginning and the end of the process are then compared, with the difference indicating the transferred volume of fuels. Typically, the tables are created from calculations. Thus, in many case the results are then reconciled using adjusting calculations. Density adjustments, in particular are used to derive the mass of the fuel transferred. Alternatively, volumetric flow meters are some time used. Nevertheless, regardless of the system of measuring the quantity of transferred fuel, errors are a big a challenge particularly those that results from entrenched air into the system.
Several companies in the bunker industry have highlighted this issue. For example, Maersk, one of the biggest shipping companies on the globe, has posted an average error of 1.5 % in its measurements. This translates into huge losses on the part of the company, considering that the firm buys over 13 million tons of fuel each year amounting to over 12, 000 bunker operations annually. The company has since lobbied industry players to adopt a new system of measuring the quantity of fuel transferred. The coriolis flow meter, in particular has received much backing as the measuring device of choice that should be used as a basis for making payments to suppliers.
Visibly, the main reason for routing the coriolis meter in the bunker industry is to address the challenge of entrenched air into the system, which leads to in accurate measurements of the mass of fuel transferred. A coriolis meter used for such operations will have a set of vibrating flow tubes in which the fuel to be measured will pass. Typically, the diameters of the flow tubes will range from one millimeter to about 12 inches. The principle of application is the same for all such meters. In that regard, across the flow tubes, two pipes will be forced to vibrate using electromagnetic systems. The degree of vibration in the system will be limited to about less than a millimeter. The frequency of vibration, on the other hand, will range between 50 to 1000 Hz depending on the system adopted. Density is also a huge factor in determining the frequency of the vibrations to be used. Sensors are the second component of coriolis meters. These are installed at the end and the beginning of the tubes. The sensors generate signals, which are transmitted via an electronic transmitter. Based on the signals, the mass flow and density of the fluid can be easily established.
Using coriolis meters has been proven to provide the most accurate measurements in the industry. However, the older generation of coriolis meters still faced the challenge of dealing with aerated flow, where air was entrenched into the system. Luckily, modern designs of coriolis meters have been constructed with this issue mind. Consequently, they perform exceptionally well even during aerated flows. What is more, the new generation of meters can detect the presence of air in the system and measure it accurately.
The main change of the older generation, coriolis meters that made it imppossible for them to display superb performance during aerated flow, touches on the use of drive signals in the flow tubes. Here, when a single-phase flow is happening in the tube, the frequency of oscillation is kept steady with an appropriate drive current of about 10 to 20 mill amperes. Unfortunately, when the current has to be maintained within a safety range, it becomes exceedingly difficult to maintain a steady frequency of oscillation . the resulting unsteady oscillation accounts for the errors in the system.
Modern generation coriolis flow meters have found a ways of addressing the challenge. In the new systems, signal processing techniques are used to track the sensor signals and to update the drive signal in every half cycle of the waveform. Moreover, many modern generation meters have adopted the science of modellling in their operations. This has made it possible for the meters to compensate for systematic errors in the system. The new generations of coriolis meters have, thus, been accepted as the most accurate way of measuring mass flow rate in the bunker industry, particularly for two-phase flows.
Despite the obvious benefits presented by the use of Coriolis flow meters in the industry, the rate of absorption of the technology remains limited. In fact, only major players in the industry such as Maersk are fully embracing the technology due to the obvious revenue benefits on their part. The company expects to fit all its vessels with Coriolis flowmeters by the year 2023. The cost of installation is high totaling to about 70,000 dollars per meter. Nevertheless, the company will go ahead with the plan because the corresponding benefits are huge compared to the costs. From this case, it emerges that huge costs are the main challenge impeding the adoption of the technology. Many companies are simply not willing to bear the huge costs despite the obvious future benefits.
The absence of credible suppliers is the second major reason that has impeded the adoption of the technology in the bunker industry. About that, very few trustworthy suppliers exist in the industry. What is more, the existing suppliers do not have the production capacity to supply meters for large companies such as Maersk and others. Those with the ability, on the other hand, are overwhelmed by demand. Luckily, this trend is slowly changing as more and more players penetrate the market. Currently, Emerson is the major player in the supply of Coriolis meters. The company accounts for over 70 % of the global supply of the meters. Others suppliers present in the market include Invensys process systems and Yokogawa.
The absence of goodwill from all the players in the industry is the other challenge facing the adoption of the technology. About that, few players in the industry are fully committed to adopting the technology in full. Many remain lukewarm. In fact, Maersk and BP have emerged as the only two major players that have demonstrated a commitment to adopting the technology. Hopefully, with increased lobbying by these two companies, the other players in the industry will come on board plans to utilize the technology fully.
The absence of detailed trials is the other major reason impeding the adoption of the technology. About that, many companies rely on justifications from scientific trials before adopting a technology. Sadly, few trials exist regarding the suitability of the Coriolis flow meter in the bunker industry. This has proved a huge challenge to the technology. The situation is not entirely hopeless. In fact, several institutions have conducted trials on the suitability of the Coriolis meter for the bunker industry. The trials have been a great success.
For example, the UK’s Natural Flow facilities and the National Engineering laboratory conducted separate and joint trials to test the application of the coriolis meter in the bunker industry. In one such trial conducted by the two institutions, a Coriolis flow tube of 200 mm diameters was experimented based on typical bunker industry flow rates. In that regard, a flow rate of about 140 kgs/s or 504 tonnes per hour was used. The test fluid comprised of a light gas oil of viscosity -200Cst at 15 degrees Celsius. The experiment conducted both single phase flow and two-phase flow tests. On the single-phase flow test, the flow readings, which were mass based gave an error of about 0.15 % across a flow of 40kg/s to 140 kg/s. In tones per hour, the flow is 144 T/hr to 504T/hr. The density readings for the single flow gave a value of 0.1 %. Regarding the two-phase flow tests, the errors in the device had an average of 3 % with the highest error value clocking 6 %. Visibly, the errors for the two-phase flow experiments are significantly higher, than those of single-phase flow experiments. The probable explanation for this observation is the fact that during two-phase flow, the flow rates and gas void fractions vary. This leads to the cancelation of the negative and positive flow errors. In another set of experiments conducted in Singapore, the errors from the use of Coriolis flow meters gave values of less than 2.5 %.
Summary of literature review
The literature review had two sections; the first section discussed the concept of viscosity and mass flow rate as they applied to oil and water. It was established that viscosity is a quantity that measures the rate of resistance of a fluid to flow. Viscosity has an inverse relationship to mass flow rate. The review also explored viscosity as it applies to the oil industry. It was established that accurate measurement of viscosity is important for the industry because usually, the viscosity of an oil can be used to judge its functionality. Similarly, details on the viscosity of water can be relied on to increase is industrial applications. Viscosity of water in oil emulsions was also discussed. It was established that the viscosity of the emulsion is dependent on pressure, the viscosity of the oil and the size of particles in the dispersed phase. Research in this area, however, remains limited. The first part of the literature concluded with a review of how Coriolis flowmeters could be adapted to measure viscosity. Here, pressure differentials could be added to the devices and Poiseuille’s equations used to calculate viscosity.
The second part of the literature review explored the adoption of the Coriolis flow meter for the bunker industry. First, the evaluation noted that the bunker industry is a multibillion-dollar sector that has high growth prospects. The adoption of the technology in the sector presents huge benefits stemming from the highly accurate nature of the Coriolis meters. Nevertheless, the absorption of the technology in the industry remains limited due to several reasons discussed in the literature review.


